Races in Windsor, Connecticut (CT) Detailed Stats
Ancestries, Foreign-born residents, place of birth

Discuss Windsor, Connecticut races on our local forum with over 2,400,000 registered users
Latest news about races in Windsor, CT collected exclusively by city-data.com from local newspapers, TV, and radio stations
11.8% of Windsor, CT residents are foreign-born (6.3% born in Latin America, 2.4% born in Europe, 2.4% born in Asia), which is 27.4% less than the foreign-born rate of 15.0% across the entire state of Connecticut.
Race distribution in Windsor

- 17,75862.9%White alone
- 7,52926.7%Black alone
- 1,4055.0%Hispanic
- 8803.1%Asian alone
- 5702.0%Two or more races
- 520.2%Other race alone
- 350.1%American Indian alone
- 80.03%Native Hawaiian and Other
Pacific Islander alone

2000
2022
-
- 2,638,84577.5%White alone
- 320,3239.4%Hispanic
- 295,5718.7%Black alone
- 81,5642.4%Asian alone
- 52,8961.6%Two or more races
- 8,1410.2%Other race alone
- 7,2670.2%American Indian alone
- 9580.03%Native Hawaiian and Other
Pacific Islander alone

-
- 2,246,91362.0%White alone
- 658,97818.2%Hispanic
- 353,9739.8%Black alone
- 172,9294.8%Asian alone
- 159,6314.4%Two or more races
- 29,7610.8%Other race alone
- 3,4280.09%American Indian alone
- 5920.02%Native Hawaiian and Other
Pacific Islander alone

Income and house value in Windsor
- Median household income in 2022
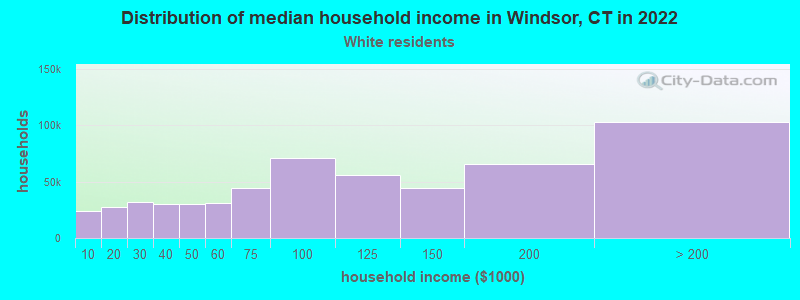
- $104,859White non-Hispanic householders
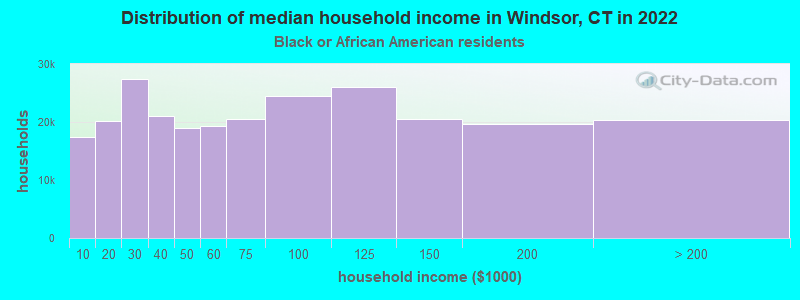
- $112,236Black householders
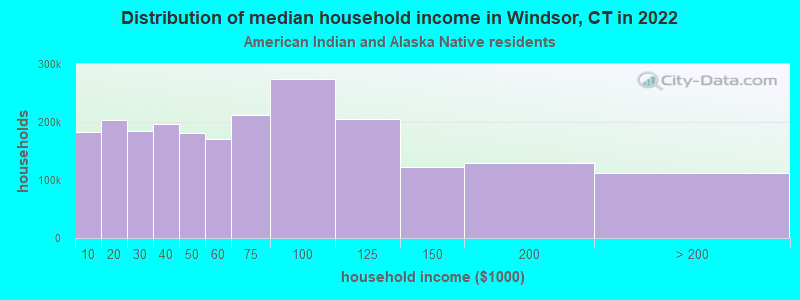
- $72,374American Indian and Alaska Native householders
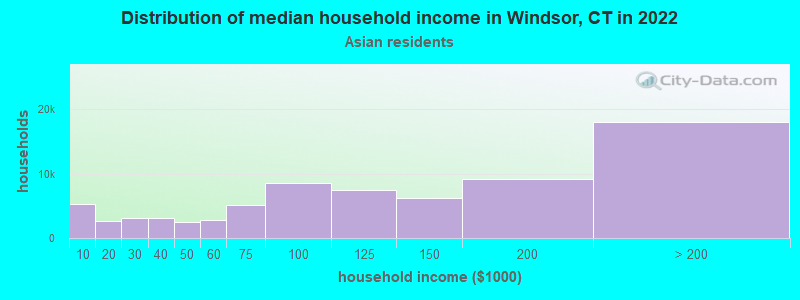
- $134,851Asian householders
- $140,182Some other race householders
- $108,830Two or more races householders
- $126,769Hispanic or Latino race householders
- Median 2022 house value
- $318,230White Non-Hispanic householders
- $289,909Black or African American householders
- $212,946American Indian or Alaska Native householders
- $314,987Asian householders
- $294,233Some other race householders
- $271,317Two or more races householders
- $295,530Hispanic or Latino householders
Household income for White non-Hispanic householders
Household income for Black householders
Household income for American Indian and Alaska Native householders
Household income for Asian householders
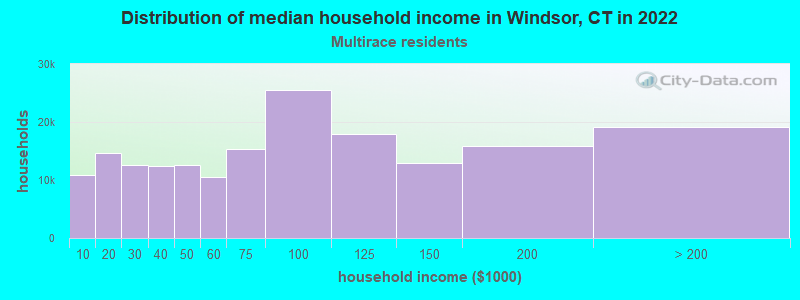
Household income for Two or more races householders
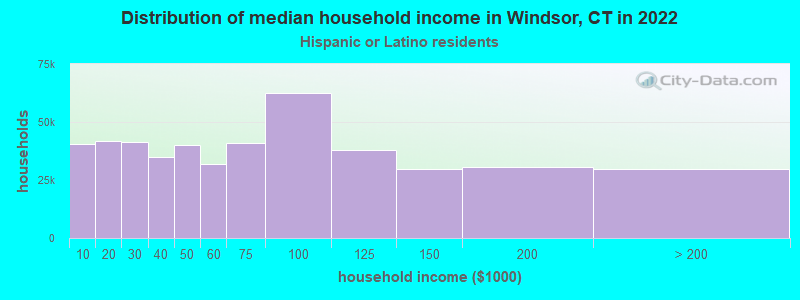
Household income for Hispanic or Latino race householders
Foreign-born residents in Windsor
3,324 residents are foreign born (6.3% Latin America, 2.4% Europe, 2.4% Asia).
| This city: | 11.8% |
| Connecticut: | 10.9% |
Ancestries in Windsor

- 8,64126.7%Other
- 3,95212.2%Irish
- 3,31810.2%Italian
- 2,7948.6%English
- 2,2567.0%Polish
- 2,1146.5%German
- 1,7945.5%West Indian
- 1,4914.6%French
- 1,0593.3%French Canadian
- 8312.6%United States
- 5251.6%Portuguese
- 5251.6%Scottish
- 4191.3%Lithuanian
- 4131.3%Swedish
- 3881.2%Russian
- 3131.0%Scotch-Irish
- 2320.7%Ukrainian
- 1880.6%Welsh
- 1860.6%Danish
- 1590.5%Subsaharan African
- 1510.5%Dutch
- 1480.5%Norwegian
- 1270.4%Greek
- 1020.3%Hungarian
- 950.3%Arab
- 920.3%Slovak
- 510.2%Czech
- 310.10%Swiss

Zip codes: 06095.