Races in Wood Dale, Illinois (IL) Detailed Stats
Data:
Races - White alone (%)
Races - White alone (% change since 2000)
Races - Black alone (%)
Races - Black alone (% change since 2000)
Races - American Indian alone (%)
Races - American Indian alone (% change since 2000)
Races - Asian alone (%)
Races - Asian alone (% change since 2000)
Races - Hispanic (%)
Races - Hispanic (% change since 2000)
Races - Native Hawaiian and Other Pacific Islander alone (%)
Races - Native Hawaiian and Other Pacific Islander alone (% change since 2000)
Races - Two or more races(%)
Races - Two or more races(% change since 2000)
Races - Other race alone (%)
Races - Other race alone (% change since 2000)
Racial diversity
Place of birth - Born in state of residence (%)
Place of birth - Born in state of residence (%) - White
Place of birth - Born in state of residence (%) - Black or African American
Place of birth - Born in state of residence (%) - Asian
Place of birth - Born in state of residence (%) - Hispanic or Latino
Place of birth - Born in state of residence (%) - American Indian and Alaska Native
Place of birth - Born in state of residence (%) - Multirace
Place of birth - Born in state of residence (%) - Other Race
Place of birth - Born in other state (%)
Place of birth - Born in other state (%) - White
Place of birth - Born in other state (%) - Black or African American
Place of birth - Born in other state (%) - Asian
Place of birth - Born in other state (%) - Hispanic or Latino
Place of birth - Born in other state (%) - American Indian and Alaska Native
Place of birth - Born in other state (%) - Multirace
Place of birth - Born in other state (%) - Other Race
Place of birth - Native, outside of US (%)
Place of birth - Native, outside of US (%) - White
Place of birth - Native, outside of US (%) - Black or African American
Place of birth - Native, outside of US (%) - Asian
Place of birth - Native, outside of US (%) - Hispanic or Latino
Place of birth - Native, outside of US (%) - American Indian and Alaska Native
Place of birth - Native, outside of US (%) - Multirace
Place of birth - Native, outside of US (%) - Other Race
Place of birth - Foreign born (%)
Place of birth - Foreign born (%) - White
Place of birth - Foreign born (%) - Black or African American
Place of birth - Foreign born (%) - Asian
Place of birth - Foreign born (%) - Hispanic or Latino
Place of birth - Foreign born (%) - American Indian and Alaska Native
Place of birth - Foreign born (%) - Multirace
Place of birth - Foreign born (%) - Other Race
Residents speaking English at home (%)
Residents speaking English at home - Born in the United States (%)
Residents speaking English at home - Native, born elsewhere (%)
Residents speaking English at home - Foreign born (%)
Residents speaking Spanish at home (%)
Residents speaking Spanish at home - Born in the United States (%)
Residents speaking Spanish at home - Native, born elsewhere (%)
Residents speaking Spanish at home - Foreign born (%)
Residents speaking other language at home (%)
Residents speaking other language at home - Born in the United States (%)
Residents speaking other language at home - Native, born elsewhere (%)
Residents speaking other language at home - Foreign born (%)
Marital status - Never married (%)
Marital status - Now married (%)
Marital status - Separated (%)
Marital status - Widowed (%)
Marital status - Divorced (%)
Ancestries Reported - Arab (%)
Ancestries Reported - Czech (%)
Ancestries Reported - Danish (%)
Ancestries Reported - Dutch (%)
Ancestries Reported - English (%)
Ancestries Reported - French (%)
Ancestries Reported - French Canadian (%)
Ancestries Reported - German (%)
Ancestries Reported - Greek (%)
Ancestries Reported - Hungarian (%)
Ancestries Reported - Irish (%)
Ancestries Reported - Italian (%)
Ancestries Reported - Lithuanian (%)
Ancestries Reported - Norwegian (%)
Ancestries Reported - Polish (%)
Ancestries Reported - Portuguese (%)
Ancestries Reported - Russian (%)
Ancestries Reported - Scotch-Irish (%)
Ancestries Reported - Scottish (%)
Ancestries Reported - Slovak (%)
Ancestries Reported - Subsaharan African (%)
Ancestries Reported - Swedish (%)
Ancestries Reported - Swiss (%)
Ancestries Reported - Ukrainian (%)
Ancestries Reported - United States (%)
Ancestries Reported - Welsh (%)
Ancestries Reported - West Indian (%)
Ancestries Reported - Other (%)
Geographical mobility - Same house 1 year ago (%)
Geographical mobility - Same house 1 year ago (%) - White
Geographical mobility - Same house 1 year ago (%) - Black or African American
Geographical mobility - Same house 1 year ago (%) - Asian
Geographical mobility - Same house 1 year ago (%) - Hispanic or Latino
Geographical mobility - Same house 1 year ago (%) - American Indian and Alaska Native
Geographical mobility - Same house 1 year ago (%) - Multirace
Geographical mobility - Same house 1 year ago (%) - Other Race
Geographical mobility - Moved within same county (%)
Geographical mobility - Moved within same county (%) - White
Geographical mobility - Moved within same county (%) - Black or African American
Geographical mobility - Moved within same county (%) - Asian
Geographical mobility - Moved within same county (%) - Hispanic or Latino
Geographical mobility - Moved within same county (%) - American Indian and Alaska Native
Geographical mobility - Moved within same county (%) - Multirace
Geographical mobility - Moved within same county (%) - Other Race
Geographical mobility - Moved from different county within same state (%)
Geographical mobility - Moved from different county within same state (%) - White
Geographical mobility - Moved from different county within same state (%) - Black or African American
Geographical mobility - Moved from different county within same state (%) - Asian
Geographical mobility - Moved from different county within same state (%) - Hispanic or Latino
Geographical mobility - Moved from different county within same state (%) - American Indian and Alaska Native
Geographical mobility - Moved from different county within same state (%) - Multirace
Geographical mobility - Moved from different county within same state (%) - Other Race
Geographical mobility - Moved from different state (%)
Geographical mobility - Moved from different state (%) - White
Geographical mobility - Moved from different state (%) - Black or African American
Geographical mobility - Moved from different state (%) - Asian
Geographical mobility - Moved from different state (%) - Hispanic or Latino
Geographical mobility - Moved from different state (%) - American Indian and Alaska Native
Geographical mobility - Moved from different state (%) - Multirace
Geographical mobility - Moved from different state (%) - Other Race
Geographical mobility - Moved from abroad (%)
Geographical mobility - Moved from abroad (%) - White
Geographical mobility - Moved from abroad (%) - Black or African American
Geographical mobility - Moved from abroad (%) - Asian
Geographical mobility - Moved from abroad (%) - Hispanic or Latino
Geographical mobility - Moved from abroad (%) - American Indian and Alaska Native
Geographical mobility - Moved from abroad (%) - Multirace
Geographical mobility - Moved from abroad (%) - Other Race
Place of birth for the foreign-born population - Ireland (%)
Place of birth for the foreign-born population - Denmark (%)
Place of birth for the foreign-born population - Norway (%)
Place of birth for the foreign-born population - Sweden (%)
Place of birth for the foreign-born population - United Kingdom (%)
Place of birth for the foreign-born population - England (%)
Place of birth for the foreign-born population - Scotland (%)
Place of birth for the foreign-born population - Other Northern Europe (%)
Place of birth for the foreign-born population - Austria (%)
Place of birth for the foreign-born population - Belgium (%)
Place of birth for the foreign-born population - France (%)
Place of birth for the foreign-born population - Germany (%)
Place of birth for the foreign-born population - Netherlands (%)
Place of birth for the foreign-born population - Switzerland (%)
Place of birth for the foreign-born population - Other Western Europe (%)
Place of birth for the foreign-born population - Greece (%)
Place of birth for the foreign-born population - Italy (%)
Place of birth for the foreign-born population - Portugal (%)
Place of birth for the foreign-born population - Spain (%)
Place of birth for the foreign-born population - Other Southern Europe (%)
Place of birth for the foreign-born population - Albania (%)
Place of birth for the foreign-born population - Belarus (%)
Place of birth for the foreign-born population - Bosnia and Herzegovina (%)
Place of birth for the foreign-born population - Bulgaria (%)
Place of birth for the foreign-born population - Croatia (%)
Place of birth for the foreign-born population - Czechoslovakia (%)
Place of birth for the foreign-born population - Hungary (%)
Place of birth for the foreign-born population - Latvia (%)
Place of birth for the foreign-born population - Lithuania (%)
Place of birth for the foreign-born population - North Macedonia (Macedonia) (%)
Place of birth for the foreign-born population - Moldova (%)
Place of birth for the foreign-born population - Poland (%)
Place of birth for the foreign-born population - Romania (%)
Place of birth for the foreign-born population - Russia (%)
Place of birth for the foreign-born population - Serbia (%)
Place of birth for the foreign-born population - Ukraine (%)
Place of birth for the foreign-born population - Other Eastern Europe (%)
Place of birth for the foreign-born population - China (%)
Place of birth for the foreign-born population - Hong Kong (%)
Place of birth for the foreign-born population - Taiwan (%)
Place of birth for the foreign-born population - Japan (%)
Place of birth for the foreign-born population - Korea (%)
Place of birth for the foreign-born population - Other Eastern Asia (%)
Place of birth for the foreign-born population - Afghanistan (%)
Place of birth for the foreign-born population - Bangladesh (%)
Place of birth for the foreign-born population - India (%)
Place of birth for the foreign-born population - Iran (%)
Place of birth for the foreign-born population - Kazakhstan (%)
Place of birth for the foreign-born population - Nepal (%)
Place of birth for the foreign-born population - Pakistan (%)
Place of birth for the foreign-born population - Sri Lanka (%)
Place of birth for the foreign-born population - Uzbekistan (%)
Place of birth for the foreign-born population - Other South Central Asia (%)
Place of birth for the foreign-born population - Burma (%)
Place of birth for the foreign-born population - Cambodia (%)
Place of birth for the foreign-born population - Indonesia (%)
Place of birth for the foreign-born population - Laos (%)
Place of birth for the foreign-born population - Malaysia (%)
Place of birth for the foreign-born population - Philippines (%)
Place of birth for the foreign-born population - Singapore (%)
Place of birth for the foreign-born population - Thailand (%)
Place of birth for the foreign-born population - Vietnam (%)
Place of birth for the foreign-born population - Other South Eastern Asia (%)
Place of birth for the foreign-born population - Armenia (%)
Place of birth for the foreign-born population - Iraq (%)
Place of birth for the foreign-born population - Israel (%)
Place of birth for the foreign-born population - Jordan (%)
Place of birth for the foreign-born population - Kuwait (%)
Place of birth for the foreign-born population - Lebanon (%)
Place of birth for the foreign-born population - Saudi Arabia (%)
Place of birth for the foreign-born population - Syria (%)
Place of birth for the foreign-born population - Turkey (%)
Place of birth for the foreign-born population - Yemen (%)
Place of birth for the foreign-born population - Other Western Asia (%)
Place of birth for the foreign-born population - Eritrea (%)
Place of birth for the foreign-born population - Ethiopia (%)
Place of birth for the foreign-born population - Kenya (%)
Place of birth for the foreign-born population - Somalia (%)
Place of birth for the foreign-born population - Uganda (%)
Place of birth for the foreign-born population - Zimbabwe (%)
Place of birth for the foreign-born population - Other Eastern Africa (%)
Place of birth for the foreign-born population - Cameroon (%)
Place of birth for the foreign-born population - Congo (%)
Place of birth for the foreign-born population - Democratic Republic of Congo (Zaire) (%)
Place of birth for the foreign-born population - Other Middle Africa (%)
Place of birth for the foreign-born population - Egypt (%)
Place of birth for the foreign-born population - Morocco (%)
Place of birth for the foreign-born population - Sudan (%)
Place of birth for the foreign-born population - Other Northern Africa (%)
Place of birth for the foreign-born population - South Africa (%)
Place of birth for the foreign-born population - Other Southern Africa (%)
Place of birth for the foreign-born population - Cabo Verde (%)
Place of birth for the foreign-born population - Ghana (%)
Place of birth for the foreign-born population - Liberia (%)
Place of birth for the foreign-born population - Nigeria (%)
Place of birth for the foreign-born population - Senegal (%)
Place of birth for the foreign-born population - Sierra Leone (%)
Place of birth for the foreign-born population - Other Western Africa (%)
Place of birth for the foreign-born population - Australia (%)
Place of birth for the foreign-born population - New Zealand (%)
Place of birth for the foreign-born population - Fiji (%)
Place of birth for the foreign-born population - Micronesia (%)
Place of birth for the foreign-born population - Bahamas (%)
Place of birth for the foreign-born population - Barbados (%)
Place of birth for the foreign-born population - Cuba (%)
Place of birth for the foreign-born population - Dominica (%)
Place of birth for the foreign-born population - Dominican Republic (%)
Place of birth for the foreign-born population - Grenada (%)
Place of birth for the foreign-born population - Haiti (%)
Place of birth for the foreign-born population - Jamaica (%)
Place of birth for the foreign-born population - St. Vincent and the Grenadines (%)
Place of birth for the foreign-born population - Trinidad and Tobago (%)
Place of birth for the foreign-born population - West Indies (%)
Place of birth for the foreign-born population - Other Caribbean (%)
Place of birth for the foreign-born population - Belize (%)
Place of birth for the foreign-born population - Costa Rica (%)
Place of birth for the foreign-born population - El Salvador (%)
Place of birth for the foreign-born population - Guatemala (%)
Place of birth for the foreign-born population - Honduras (%)
Place of birth for the foreign-born population - Mexico (%)
Place of birth for the foreign-born population - Nicaragua (%)
Place of birth for the foreign-born population - Panama (%)
Place of birth for the foreign-born population - Other Central America (%)
Place of birth for the foreign-born population - Argentina (%)
Place of birth for the foreign-born population - Bolivia (%)
Place of birth for the foreign-born population - Brazil (%)
Place of birth for the foreign-born population - Chile (%)
Place of birth for the foreign-born population - Colombia (%)
Place of birth for the foreign-born population - Ecuador (%)
Place of birth for the foreign-born population - Guyana (%)
Place of birth for the foreign-born population - Peru (%)
Place of birth for the foreign-born population - Uruguay (%)
Place of birth for the foreign-born population - Venezuela (%)
Place of birth for the foreign-born population - Other South America (%)
Place of birth for the foreign-born population - Canada (%)
Place of birth for the foreign-born population - Other Northern America (%)
Place of birth for the foreign-born population - Other (%)
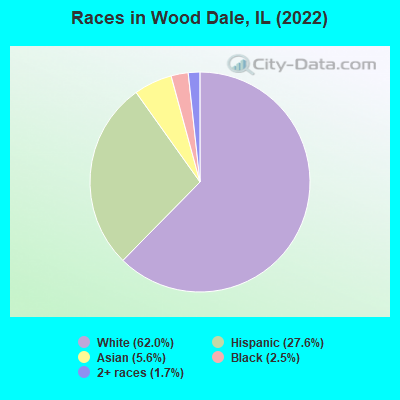
According to 2022 data, the most numerous races in Wood Dale, IL are White alone (8,534 residents), Hispanic (3,798 residents), and Black alone (350 residents). 51.1% of Wood Dale residents speak English at home. 29.4% of Wood Dale, IL residents are foreign-born (15.4% born in Europe, 9.2% born in Latin America, 3.8% born in Asia), which is 52.3% greater than the foreign-born rate of 14.0% across the entire state of Illinois.
Race distribution in Wood Dale
2000 2022
8,424,140 67.8% White alone 1,856,152 14.9% Black alone 1,530,262 12.3% Hispanic 419,916 3.4% Asian alone 153,996 1.2% Two or more races 13,479 0.1% Other race alone 18,232 0.1% American Indian alone 3,116 0.03% Native Hawaiian and Other
7,356,301 58.5% White alone 2,299,726 18.3% Hispanic 1,660,423 13.2% Black alone 747,296 5.9% Asian alone 458,599 3.6% Two or more races 45,386 0.4% Other race alone 10,405 0.08% American Indian alone 3,896 0.03% Native Hawaiian and Other
Income and house value in Wood Dale Median household income in 2022 $82,018 White non-Hispanic householders$96,837 Black householders$131,696 Asian householders$116,884 Some other race householders$88,443 Two or more races householders$81,303 Hispanic or Latino race householdersMedian 2022 house value $301,055 White Non-Hispanic householders$164,180 American Indian or Alaska Native householders $289,995 Asian householders$253,875 Some other race householders$297,599 Two or more races householders$266,664 Hispanic or Latino householders
Median age by race in Wood Dale
47.8 Median age for White residents44.1 49.4 31.0 Median age for Black or African American residents35.5 26.4 43.7 Median age for American Indian / Alaska Native residents45.2 -545,253,862.6 43.1 Median age for Asian residents42.8 43.0 29.6 Median age for Native Hawaiian / Pacific Islander residents10.7 -576,015,108.0 36.9 Median age for Other race residents34.2 49.6 24.4 Median age for Two or more races residents16.2 37.0 47.5 Median age for White alone residents46.6 49.0 32.0 Median age for Hispanic or Latino residents27.2 37.7
Owner/renter occupied households by race in Wood Dale
House owners and renters - White residents 3,205 85.9% Owner occupied527 14.1% Renter occupiedHouse owners and renters - Black or African American residents 60 35.6% Owner occupied109 64.4% Renter occupiedHouse owners and renters - American Indian / Alaska Native residents 27 100.0% Owner occupiedHouse owners and renters - Asian residents 147 66.4% Owner occupied74 33.6% Renter occupiedHouse owners and renters - Native Hawaiian / Pacific Islander residents 14 36.7% Owner occupied24 63.3% Renter occupiedHouse owners and renters - Other race residents 210 66.3% Owner occupied106 33.7% Renter occupiedHouse owners and renters - Two or more races residents 378 48.4% Owner occupied404 51.6% Renter occupiedHouse owners and renters - White alone residents 3,084 86.1% Owner occupied499 13.9% Renter occupiedHouse owners and renters - Hispanic or Latino residents 583 57.5% Owner occupied432 42.5% Renter occupied
Language usage in Wood Dale
English speakers - Total 51.1% of residents of Wood Dale speak English at home.
20.6% of residents speak Spanish at home 1,693 63.1% Speak English very well992 36.9% Speak English less than very well28.5% of residents speak other language at home 2,249 60.5% Speak English very well1,469 39.5% Speak English less than very well
English speakers - Born in the United States 95.2% of residents of Wood Dale speak English at home.
3.7% of residents speak Spanish at home 19 73.1% Speak English very well7 26.9% Speak English less than very well
English speakers - Native, born elsewhere 21.2% of residents of Wood Dale speak English at home.
33.4% of residents speak Spanish at home 79 53.4% Speak English very well69 46.6% Speak English less than very well41.5% of residents speak other language at home 164 89.1% Speak English very well20 10.9% Speak English less than very well
English speakers - Foreign-born 7.4% of residents of Wood Dale speak English at home.
31.1% of residents speak Spanish at home 428 34.2% Speak English very well824 65.8% Speak English less than very well62.3% of residents speak other language at home 1,135 45.3% Speak English very well1,373 54.7% Speak English less than very well
White (Caucasian) - Speak only English Native:
80.5% (5,151)Foreign-born:
8.1% (174)
White (Caucasian) - Speak another language Native:
15.7% (1,006)Foreign-born:
90.5% (1,951)
Black or African American - Speak only English Native:
100.0% (352)Foreign-born:
75.5% (7)
American Indian / Alaska Native - Speak only English Native:
80.4% (8)Foreign-born:
39.2% (52)
Asian - Speak only English Native:
35.9% (108)Foreign-born:
6.7% (29)
Asian - Speak another language Native:
58.8% (177)Foreign-born:
93.8% (410)
Other race - Speak only English Native:
22.0% (154)Foreign-born:
3.3% (25)
Other race - Speak another language Native:
75.5% (527)Foreign-born:
97.3% (721)
Two or more races - Speak only English Native:
39.0% (594)Foreign-born:
8.2% (32)
Two or more races - Speak another language Native:
65.7% (1,000)Foreign-born:
92.3% (361)
White alone - Speak only English Native:
83.1% (5,084)Foreign-born:
8.4% (192)
White alone - Speak another language Native:
15.9% (974)Foreign-born:
91.2% (2,094)
Hispanic or Latino - Speak only English Native:
28.1% (566)Foreign-born:
6.4% (84)
Hispanic or Latino - Speak another language Native:
72.5% (1,458)Foreign-born:
93.7% (1,241)
Foreign-born residents in Wood Dale 4,040 residents are foreign born (15.4% Europe , 9.2% Latin America , 3.8% Asia ).
This city:
29.4%Illinois:
14.1%
Marital status for residents in Wood Dale Marital status - White (Caucasian) population 15 years and over
Males 33.2% Never married61.6% Now married0.0% Separated1.5% Widowed3.8% DivorcedFemales 25.0% Never married53.4% Now married0.2% Separated11.0% Widowed10.5% DivorcedWomen who gave birth in the past 12 months Now married:
87.4% (203)Unmarried:
12.6% (29)
Women who did not give birth in the past 12 months Now married:
44.2% (787)Unmarried:
55.8% (993)
Marital status - Black or African American population 15 years and over
Males 13.0% Never married61.7% Now married6.2% Separated0.0% Widowed19.1% DivorcedFemales 34.1% Never married60.0% Now married0.0% Separated5.9% Widowed0.0% DivorcedWomen who did not give birth in the past 12 months Now married:
48.9% (45)Unmarried:
51.1% (47)
Marital status - American Indian / Alaska Native population 15 years and over
Males 15.9% Never married84.1% Now married0.0% Separated0.0% Widowed0.0% DivorcedFemales 48.1% Never married51.9% Now married0.0% Separated0.0% Widowed0.0% DivorcedWomen who did not give birth in the past 12 months Now married:
0.0% (0)Unmarried:
100.0% (22)
Marital status - Asian population 15 years and over
Males 12.8% Never married72.9% Now married0.0% Separated14.3% Widowed0.0% DivorcedFemales 0.0% Never married70.8% Now married0.0% Separated29.2% Widowed0.0% DivorcedWomen who gave birth in the past 12 months Now married:
100.0% (12)Unmarried:
0.0% (0)
Women who did not give birth in the past 12 months Now married:
100.0% (140)Unmarried:
0.0% (0)
Marital status - Native Hawaiian / Pacific Islander population 15 years and over
Males 0.0% Never married100.0% Now married0.0% Separated0.0% Widowed0.0% DivorcedFemales 0.0% Never married100.0% Now married0.0% Separated0.0% Widowed0.0% DivorcedWomen who did not give birth in the past 12 months Now married:
100.0% (26)Unmarried:
0.0% (0)
Marital status - Other race population 15 years and over
Males 26.5% Never married56.5% Now married0.0% Separated13.6% Widowed3.4% DivorcedFemales 25.8% Never married60.4% Now married0.0% Separated12.3% Widowed1.5% DivorcedWomen who gave birth in the past 12 months Now married:
27.8% (21)Unmarried:
72.2% (54)
Women who did not give birth in the past 12 months Now married:
68.8% (246)Unmarried:
31.2% (112)
Marital status - Two or more races population 15 years and over
Males 70.4% Never married26.4% Now married0.0% Separated1.7% Widowed1.5% DivorcedFemales 25.6% Never married18.7% Now married0.0% Separated5.1% Widowed50.7% DivorcedWomen who gave birth in the past 12 months Now married:
73.8% (44)Unmarried:
26.2% (16)
Women who did not give birth in the past 12 months Now married:
11.2% (50)Unmarried:
88.8% (396)
Marital status - White alone, not Hispanic / Latino population 15 years and over
Males 31.9% Never married62.3% Now married0.0% Separated1.6% Widowed4.1% DivorcedFemales 24.3% Never married52.9% Now married0.3% Separated11.3% Widowed11.3% DivorcedWomen who gave birth in the past 12 months Now married:
83.4% (157)Unmarried:
16.6% (31)
Women who did not give birth in the past 12 months Now married:
45.8% (805)Unmarried:
54.2% (951)
Marital status - Hispanic or Latino population 15 years and over
Males 46.4% Never married46.8% Now married0.0% Separated5.5% Widowed1.3% DivorcedFemales 27.5% Never married43.4% Now married0.0% Separated7.4% Widowed21.6% DivorcedWomen who gave birth in the past 12 months Now married:
68.6% (113)Unmarried:
31.4% (52)
Women who did not give birth in the past 12 months Now married:
36.5% (276)Unmarried:
63.5% (480)
Ancestries in Wood Dale
1,465 20.1% Polish757 10.4% Italian256 3.5% German216 3.0% American213 2.9% Ukrainian165 2.3% English161 2.2% European142 1.9% Irish133 1.8% Bulgarian101 1.4% French Canadian101 1.4% Yugoslavian97 1.3% Serbian71 1.0% Greek64 0.9% Iraqi64 0.9% Scottish58 0.8% Lithuanian41 0.6% Swedish37 0.5% Dutch34 0.5% Czech25 0.3% Norwegian24 0.3% Czechoslovakian23 0.3% French22 0.3% Eastern European22 0.3% African19 0.3% Croatian18 0.2% Russian13 0.2% Lebanese13 0.2% Romanian13 0.2% Alsatian11 0.2% Belgian11 0.2% Slovak10 0.1% Jamaican9 0.1% Danish8 0.1% Hungarian8 0.1% Scotch-Irish6 0.08% Assyrian6 0.08% Finnish6 0.08% Luxembourger4 0.05% Armenian4 0.05% Austrian4 0.05% British
Geographical mobility in Wood Dale Same house 1 year ago 7,931 89.7% White (Caucasian)333 85.7% Black or African American169 99.7% American Indian / Alaska Native555 73.2% Asian101 100.0% Native Hawaiian / Pacific Islander1,398 96.7% Other race2,214 96.0% Two or more races7,584 89.7% White alone, not Hispanic / Latino3,472 94.1% Hispanic or LatinoMoved within same county 382 4.3% White / Caucasian3 0.8% Black or African American57 7.5% Asian348 4.1% White alone, not Hispanic / Latino51 1.4% Hispanic or LatinoMoved within same state 473 5.3% White / Caucasian45 11.6% Black or African American208 27.5% Asian25 1.8% Other race85 3.7% Two or more races500 5.9% White alone, not Hispanic / Latino63 1.7% Hispanic or LatinoMoved from different state 28 0.3% White / Caucasian5 1.3% Black or African American2 0.3% Asian18 0.8% Two or more races9 0.1% White alone, not Hispanic / Latino86 2.3% Hispanic or LatinoMoved from abroad 33 0.4% White31 0.4% White alone, not Hispanic / Latino6 0.2% Hispanic or Latino
Children Nativity (place of birth) in Wood Dale
Children under 6 years - Living with two parents Both parents native 264 100.0% NativeBoth parents foreign-born 148 100.0% NativeOne native, one foreign-born parent 51 100.0% NativeChildren under 6 years - Living with one parent Native parent 303 100.0% NativeForeign-born parent 19 100.0% NativeChildren 6 to 17 years - Living with two parents Both parents native 389 100.0% NativeBoth parents foreign-born 422 86.8% Native64 13.2% Foreign-bornOne native, one foreign-born parent 264 93.3% Native19 6.7% Foreign-bornChildren 6 to 17 years - Living with one parent Native parent 291 100.0% NativeForeign-born parent 189 48.1% Native205 51.9% Foreign-born
Grandparents responsible for own grandchildren in Wood Dale
Grandparents (30 to 59 years) White / Caucasian 10 30.8% Responsible for grandchildren24 69.2% Not responsible for grandchildrenBlack or African American 13 100.0% Responsible for grandchildrenAsian 6 100.0% Responsible for grandchildrenWhite alone, not Hispanic / Latino 12 100.0% Responsible for grandchildrenHispanic or Latino 6 12.4% Responsible for grandchildren42 87.6% Not responsible for grandchildrenGrandparents (60 years and over) White / Caucasian 12 29.0% Responsible for grandchildren28 71.0% Not responsible for grandchildrenBlack or African American 9 100.0% Responsible for grandchildrenAsian 34 100.0% Not responsible for grandchildrenWhite alone, not Hispanic / Latino 13 31.0% Responsible for grandchildren28 69.0% Not responsible for grandchildrenHispanic or Latino 249 100.0% Not responsible for grandchildren