Races in Wood Village, Oregon (OR) Detailed Stats
Data:
Races - White alone (%)
Races - White alone (% change since 2000)
Races - Black alone (%)
Races - Black alone (% change since 2000)
Races - American Indian alone (%)
Races - American Indian alone (% change since 2000)
Races - Asian alone (%)
Races - Asian alone (% change since 2000)
Races - Hispanic (%)
Races - Hispanic (% change since 2000)
Races - Native Hawaiian and Other Pacific Islander alone (%)
Races - Native Hawaiian and Other Pacific Islander alone (% change since 2000)
Races - Two or more races(%)
Races - Two or more races(% change since 2000)
Races - Other race alone (%)
Races - Other race alone (% change since 2000)
Racial diversity
Place of birth - Born in state of residence (%)
Place of birth - Born in state of residence (%) - White
Place of birth - Born in state of residence (%) - Black or African American
Place of birth - Born in state of residence (%) - Asian
Place of birth - Born in state of residence (%) - Hispanic or Latino
Place of birth - Born in state of residence (%) - American Indian and Alaska Native
Place of birth - Born in state of residence (%) - Multirace
Place of birth - Born in state of residence (%) - Other Race
Place of birth - Born in other state (%)
Place of birth - Born in other state (%) - White
Place of birth - Born in other state (%) - Black or African American
Place of birth - Born in other state (%) - Asian
Place of birth - Born in other state (%) - Hispanic or Latino
Place of birth - Born in other state (%) - American Indian and Alaska Native
Place of birth - Born in other state (%) - Multirace
Place of birth - Born in other state (%) - Other Race
Place of birth - Native, outside of US (%)
Place of birth - Native, outside of US (%) - White
Place of birth - Native, outside of US (%) - Black or African American
Place of birth - Native, outside of US (%) - Asian
Place of birth - Native, outside of US (%) - Hispanic or Latino
Place of birth - Native, outside of US (%) - American Indian and Alaska Native
Place of birth - Native, outside of US (%) - Multirace
Place of birth - Native, outside of US (%) - Other Race
Place of birth - Foreign born (%)
Place of birth - Foreign born (%) - White
Place of birth - Foreign born (%) - Black or African American
Place of birth - Foreign born (%) - Asian
Place of birth - Foreign born (%) - Hispanic or Latino
Place of birth - Foreign born (%) - American Indian and Alaska Native
Place of birth - Foreign born (%) - Multirace
Place of birth - Foreign born (%) - Other Race
Residents speaking English at home (%)
Residents speaking English at home - Born in the United States (%)
Residents speaking English at home - Native, born elsewhere (%)
Residents speaking English at home - Foreign born (%)
Residents speaking Spanish at home (%)
Residents speaking Spanish at home - Born in the United States (%)
Residents speaking Spanish at home - Native, born elsewhere (%)
Residents speaking Spanish at home - Foreign born (%)
Residents speaking other language at home (%)
Residents speaking other language at home - Born in the United States (%)
Residents speaking other language at home - Native, born elsewhere (%)
Residents speaking other language at home - Foreign born (%)
Marital status - Never married (%)
Marital status - Now married (%)
Marital status - Separated (%)
Marital status - Widowed (%)
Marital status - Divorced (%)
Ancestries Reported - Arab (%)
Ancestries Reported - Czech (%)
Ancestries Reported - Danish (%)
Ancestries Reported - Dutch (%)
Ancestries Reported - English (%)
Ancestries Reported - French (%)
Ancestries Reported - French Canadian (%)
Ancestries Reported - German (%)
Ancestries Reported - Greek (%)
Ancestries Reported - Hungarian (%)
Ancestries Reported - Irish (%)
Ancestries Reported - Italian (%)
Ancestries Reported - Lithuanian (%)
Ancestries Reported - Norwegian (%)
Ancestries Reported - Polish (%)
Ancestries Reported - Portuguese (%)
Ancestries Reported - Russian (%)
Ancestries Reported - Scotch-Irish (%)
Ancestries Reported - Scottish (%)
Ancestries Reported - Slovak (%)
Ancestries Reported - Subsaharan African (%)
Ancestries Reported - Swedish (%)
Ancestries Reported - Swiss (%)
Ancestries Reported - Ukrainian (%)
Ancestries Reported - United States (%)
Ancestries Reported - Welsh (%)
Ancestries Reported - West Indian (%)
Ancestries Reported - Other (%)
Geographical mobility - Same house 1 year ago (%)
Geographical mobility - Same house 1 year ago (%) - White
Geographical mobility - Same house 1 year ago (%) - Black or African American
Geographical mobility - Same house 1 year ago (%) - Asian
Geographical mobility - Same house 1 year ago (%) - Hispanic or Latino
Geographical mobility - Same house 1 year ago (%) - American Indian and Alaska Native
Geographical mobility - Same house 1 year ago (%) - Multirace
Geographical mobility - Same house 1 year ago (%) - Other Race
Geographical mobility - Moved within same county (%)
Geographical mobility - Moved within same county (%) - White
Geographical mobility - Moved within same county (%) - Black or African American
Geographical mobility - Moved within same county (%) - Asian
Geographical mobility - Moved within same county (%) - Hispanic or Latino
Geographical mobility - Moved within same county (%) - American Indian and Alaska Native
Geographical mobility - Moved within same county (%) - Multirace
Geographical mobility - Moved within same county (%) - Other Race
Geographical mobility - Moved from different county within same state (%)
Geographical mobility - Moved from different county within same state (%) - White
Geographical mobility - Moved from different county within same state (%) - Black or African American
Geographical mobility - Moved from different county within same state (%) - Asian
Geographical mobility - Moved from different county within same state (%) - Hispanic or Latino
Geographical mobility - Moved from different county within same state (%) - American Indian and Alaska Native
Geographical mobility - Moved from different county within same state (%) - Multirace
Geographical mobility - Moved from different county within same state (%) - Other Race
Geographical mobility - Moved from different state (%)
Geographical mobility - Moved from different state (%) - White
Geographical mobility - Moved from different state (%) - Black or African American
Geographical mobility - Moved from different state (%) - Asian
Geographical mobility - Moved from different state (%) - Hispanic or Latino
Geographical mobility - Moved from different state (%) - American Indian and Alaska Native
Geographical mobility - Moved from different state (%) - Multirace
Geographical mobility - Moved from different state (%) - Other Race
Geographical mobility - Moved from abroad (%)
Geographical mobility - Moved from abroad (%) - White
Geographical mobility - Moved from abroad (%) - Black or African American
Geographical mobility - Moved from abroad (%) - Asian
Geographical mobility - Moved from abroad (%) - Hispanic or Latino
Geographical mobility - Moved from abroad (%) - American Indian and Alaska Native
Geographical mobility - Moved from abroad (%) - Multirace
Geographical mobility - Moved from abroad (%) - Other Race
Place of birth for the foreign-born population - Ireland (%)
Place of birth for the foreign-born population - Denmark (%)
Place of birth for the foreign-born population - Norway (%)
Place of birth for the foreign-born population - Sweden (%)
Place of birth for the foreign-born population - United Kingdom (%)
Place of birth for the foreign-born population - England (%)
Place of birth for the foreign-born population - Scotland (%)
Place of birth for the foreign-born population - Other Northern Europe (%)
Place of birth for the foreign-born population - Austria (%)
Place of birth for the foreign-born population - Belgium (%)
Place of birth for the foreign-born population - France (%)
Place of birth for the foreign-born population - Germany (%)
Place of birth for the foreign-born population - Netherlands (%)
Place of birth for the foreign-born population - Switzerland (%)
Place of birth for the foreign-born population - Other Western Europe (%)
Place of birth for the foreign-born population - Greece (%)
Place of birth for the foreign-born population - Italy (%)
Place of birth for the foreign-born population - Portugal (%)
Place of birth for the foreign-born population - Spain (%)
Place of birth for the foreign-born population - Other Southern Europe (%)
Place of birth for the foreign-born population - Albania (%)
Place of birth for the foreign-born population - Belarus (%)
Place of birth for the foreign-born population - Bosnia and Herzegovina (%)
Place of birth for the foreign-born population - Bulgaria (%)
Place of birth for the foreign-born population - Croatia (%)
Place of birth for the foreign-born population - Czechoslovakia (%)
Place of birth for the foreign-born population - Hungary (%)
Place of birth for the foreign-born population - Latvia (%)
Place of birth for the foreign-born population - Lithuania (%)
Place of birth for the foreign-born population - North Macedonia (Macedonia) (%)
Place of birth for the foreign-born population - Moldova (%)
Place of birth for the foreign-born population - Poland (%)
Place of birth for the foreign-born population - Romania (%)
Place of birth for the foreign-born population - Russia (%)
Place of birth for the foreign-born population - Serbia (%)
Place of birth for the foreign-born population - Ukraine (%)
Place of birth for the foreign-born population - Other Eastern Europe (%)
Place of birth for the foreign-born population - China (%)
Place of birth for the foreign-born population - Hong Kong (%)
Place of birth for the foreign-born population - Taiwan (%)
Place of birth for the foreign-born population - Japan (%)
Place of birth for the foreign-born population - Korea (%)
Place of birth for the foreign-born population - Other Eastern Asia (%)
Place of birth for the foreign-born population - Afghanistan (%)
Place of birth for the foreign-born population - Bangladesh (%)
Place of birth for the foreign-born population - India (%)
Place of birth for the foreign-born population - Iran (%)
Place of birth for the foreign-born population - Kazakhstan (%)
Place of birth for the foreign-born population - Nepal (%)
Place of birth for the foreign-born population - Pakistan (%)
Place of birth for the foreign-born population - Sri Lanka (%)
Place of birth for the foreign-born population - Uzbekistan (%)
Place of birth for the foreign-born population - Other South Central Asia (%)
Place of birth for the foreign-born population - Burma (%)
Place of birth for the foreign-born population - Cambodia (%)
Place of birth for the foreign-born population - Indonesia (%)
Place of birth for the foreign-born population - Laos (%)
Place of birth for the foreign-born population - Malaysia (%)
Place of birth for the foreign-born population - Philippines (%)
Place of birth for the foreign-born population - Singapore (%)
Place of birth for the foreign-born population - Thailand (%)
Place of birth for the foreign-born population - Vietnam (%)
Place of birth for the foreign-born population - Other South Eastern Asia (%)
Place of birth for the foreign-born population - Armenia (%)
Place of birth for the foreign-born population - Iraq (%)
Place of birth for the foreign-born population - Israel (%)
Place of birth for the foreign-born population - Jordan (%)
Place of birth for the foreign-born population - Kuwait (%)
Place of birth for the foreign-born population - Lebanon (%)
Place of birth for the foreign-born population - Saudi Arabia (%)
Place of birth for the foreign-born population - Syria (%)
Place of birth for the foreign-born population - Turkey (%)
Place of birth for the foreign-born population - Yemen (%)
Place of birth for the foreign-born population - Other Western Asia (%)
Place of birth for the foreign-born population - Eritrea (%)
Place of birth for the foreign-born population - Ethiopia (%)
Place of birth for the foreign-born population - Kenya (%)
Place of birth for the foreign-born population - Somalia (%)
Place of birth for the foreign-born population - Uganda (%)
Place of birth for the foreign-born population - Zimbabwe (%)
Place of birth for the foreign-born population - Other Eastern Africa (%)
Place of birth for the foreign-born population - Cameroon (%)
Place of birth for the foreign-born population - Congo (%)
Place of birth for the foreign-born population - Democratic Republic of Congo (Zaire) (%)
Place of birth for the foreign-born population - Other Middle Africa (%)
Place of birth for the foreign-born population - Egypt (%)
Place of birth for the foreign-born population - Morocco (%)
Place of birth for the foreign-born population - Sudan (%)
Place of birth for the foreign-born population - Other Northern Africa (%)
Place of birth for the foreign-born population - South Africa (%)
Place of birth for the foreign-born population - Other Southern Africa (%)
Place of birth for the foreign-born population - Cabo Verde (%)
Place of birth for the foreign-born population - Ghana (%)
Place of birth for the foreign-born population - Liberia (%)
Place of birth for the foreign-born population - Nigeria (%)
Place of birth for the foreign-born population - Senegal (%)
Place of birth for the foreign-born population - Sierra Leone (%)
Place of birth for the foreign-born population - Other Western Africa (%)
Place of birth for the foreign-born population - Australia (%)
Place of birth for the foreign-born population - New Zealand (%)
Place of birth for the foreign-born population - Fiji (%)
Place of birth for the foreign-born population - Micronesia (%)
Place of birth for the foreign-born population - Bahamas (%)
Place of birth for the foreign-born population - Barbados (%)
Place of birth for the foreign-born population - Cuba (%)
Place of birth for the foreign-born population - Dominica (%)
Place of birth for the foreign-born population - Dominican Republic (%)
Place of birth for the foreign-born population - Grenada (%)
Place of birth for the foreign-born population - Haiti (%)
Place of birth for the foreign-born population - Jamaica (%)
Place of birth for the foreign-born population - St. Vincent and the Grenadines (%)
Place of birth for the foreign-born population - Trinidad and Tobago (%)
Place of birth for the foreign-born population - West Indies (%)
Place of birth for the foreign-born population - Other Caribbean (%)
Place of birth for the foreign-born population - Belize (%)
Place of birth for the foreign-born population - Costa Rica (%)
Place of birth for the foreign-born population - El Salvador (%)
Place of birth for the foreign-born population - Guatemala (%)
Place of birth for the foreign-born population - Honduras (%)
Place of birth for the foreign-born population - Mexico (%)
Place of birth for the foreign-born population - Nicaragua (%)
Place of birth for the foreign-born population - Panama (%)
Place of birth for the foreign-born population - Other Central America (%)
Place of birth for the foreign-born population - Argentina (%)
Place of birth for the foreign-born population - Bolivia (%)
Place of birth for the foreign-born population - Brazil (%)
Place of birth for the foreign-born population - Chile (%)
Place of birth for the foreign-born population - Colombia (%)
Place of birth for the foreign-born population - Ecuador (%)
Place of birth for the foreign-born population - Guyana (%)
Place of birth for the foreign-born population - Peru (%)
Place of birth for the foreign-born population - Uruguay (%)
Place of birth for the foreign-born population - Venezuela (%)
Place of birth for the foreign-born population - Other South America (%)
Place of birth for the foreign-born population - Canada (%)
Place of birth for the foreign-born population - Other Northern America (%)
Place of birth for the foreign-born population - Other (%)
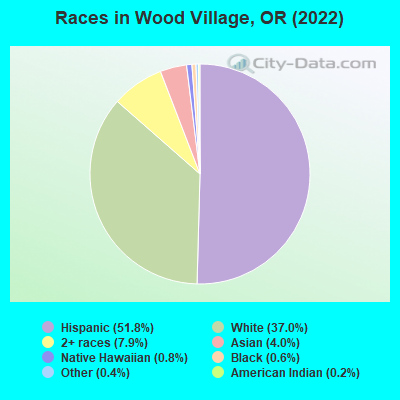
According to 2022 data, the most numerous races in Wood Village, OR are White alone (1,654 residents), Hispanic (2,319 residents), and Two or more races (352 residents). 55.0% of Wood Village residents speak English at home. 28.9% of Wood Village, OR residents are foreign-born (24.0% born in Latin America), which is 68.9% greater than the foreign-born rate of 9.0% across the entire state of Oregon.
Race distribution in Wood Village
2000 2022
2,857,616 83.5% White alone 275,314 8.0% Hispanic 100,333 2.9% Asian alone 82,733 2.4% Two or more races 53,325 1.6% Black alone 40,130 1.2% American Indian alone 7,398 0.2% Native Hawaiian and Other 4,550 0.1% Other race alone
3,037,571 71.6% White alone 609,538 14.4% Hispanic 252,744 6.0% Two or more races 191,283 4.5% Asian alone 78,228 1.8% Black alone 29,399 0.7% American Indian alone 25,731 0.6% Other race alone 15,643 0.4% Native Hawaiian and Other
Income and house value in Wood Village Median household income in 2022 $61,181 White non-Hispanic householders$68,481 American Indian and Alaska Native householders$79,784 Some other race householders$81,567 Two or more races householders$67,226 Hispanic or Latino race householdersMedian 2022 house value $359,566 White Non-Hispanic householders $213,534 Asian householders$412,546 Some other race householders$268,935 Two or more races householders$380,005 Hispanic or Latino householders
Median age by race in Wood Village
33.1 Median age for White residents34.2 31.8 54.1 Median age for Black or African American residents-689,161,553.5 -647,116,323.9 33.4 Median age for American Indian / Alaska Native residents41.3 19.1 31.6 Median age for Asian residents20.9 42.5 40.7 Median age for Native Hawaiian / Pacific Islander residents-677,852,348.3 -573,295,984.5 26.9 Median age for Other race residents24.0 30.6 30.5 Median age for Two or more races residents30.3 37.0 39.0 Median age for White alone residents40.0 36.2 23.9 Median age for Hispanic or Latino residents25.6 21.7
Owner/renter occupied households by race in Wood Village
House owners and renters - White residents 527 62.5% Owner occupied317 37.5% Renter occupiedHouse owners and renters - Black or African American residents 10 100.0% Owner occupiedHouse owners and renters - American Indian / Alaska Native residents 24 44.3% Owner occupied30 55.7% Renter occupiedHouse owners and renters - Asian residents 31 69.1% Owner occupied14 30.9% Renter occupiedHouse owners and renters - Native Hawaiian / Pacific Islander residents 14 100.0% Renter occupiedHouse owners and renters - Other race residents 146 63.5% Owner occupied84 36.5% Renter occupiedHouse owners and renters - Two or more races residents 219 83.1% Owner occupied44 16.9% Renter occupiedHouse owners and renters - White alone residents 414 61.2% Owner occupied262 38.8% Renter occupiedHouse owners and renters - Hispanic or Latino residents 299 62.5% Owner occupied179 37.5% Renter occupied
Language usage in Wood Village
English speakers - Total 55.0% of residents of Wood Village speak English at home.
38.1% of residents speak Spanish at home 668 43.6% Speak English very well864 56.4% Speak English less than very well7.9% of residents speak other language at home 128 40.3% Speak English very well190 59.7% Speak English less than very well
English speakers - Born in the United States 80.4% of residents of Wood Village speak English at home.
14.9% of residents speak Spanish at home 105 76.1% Speak English very well33 23.9% Speak English less than very well4.6% of residents speak other language at home 11 25.6% Speak English very well32 74.4% Speak English less than very well
English speakers - Native, born elsewhere 91.7% of residents of Wood Village speak English at home.
English speakers - Foreign-born 5.8% of residents of Wood Village speak English at home.
89.5% of residents speak Spanish at home 263 25.9% Speak English very well753 74.1% Speak English less than very well11.0% of residents speak other language at home 45 36.0% Speak English very well80 64.0% Speak English less than very well
White (Caucasian) - Speak only English Native:
82.0% (1,458)Foreign-born:
3.8% (17)
White (Caucasian) - Speak another language Native:
14.7% (262)Foreign-born:
86.4% (392)
American Indian / Alaska Native - Speak another language Native:
22.8% (24)Foreign-born:
100.0% (180)
Asian - Speak only English Native:
36.4% (45)Foreign-born:
28.1% (18)
Asian - Speak another language Native:
62.5% (77)Foreign-born:
74.1% (47)
Native Hawaiian / Pacific Islander - Speak another language Native:
97.5% (6)Foreign-born:
86.1% (31)
Other race - Speak only English Native:
33.9% (153)Foreign-born:
9.3% (36)
Other race - Speak another language Native:
65.2% (294)Foreign-born:
89.7% (346)
Two or more races - Speak only English Native:
89.7% (481)Foreign-born:
7.9% (13)
Two or more races - Speak another language Native:
9.2% (49)Foreign-born:
92.1% (149)
White alone - Speak only English Native:
92.0% (1,319)Foreign-born:
26.1% (18)
White alone - Speak another language Native:
7.8% (112)Foreign-born:
73.4% (50)
Hispanic or Latino - Speak only English Native:
46.9% (468)Foreign-born:
4.3% (46)
Hispanic or Latino - Speak another language Native:
52.7% (526)Foreign-born:
93.4% (1,003)
Foreign-born residents in Wood Village 1,294 residents are foreign born (24.0% Latin America ).
This city:
28.9%Oregon:
9.8%
Marital status for residents in Wood Village Marital status - White (Caucasian) population 15 years and over
Males 45.4% Never married33.0% Now married1.5% Separated4.5% Widowed15.5% DivorcedFemales 32.3% Never married44.9% Now married3.1% Separated4.8% Widowed14.9% DivorcedWomen who gave birth in the past 12 months Now married:
100.0% (31)Unmarried:
0.0% (0)
Women who did not give birth in the past 12 months Now married:
42.6% (218)Unmarried:
57.4% (294)
Marital status - Black or African American population 15 years and over
Males 33.3% Never married66.7% Now married0.0% Separated0.0% Widowed0.0% DivorcedFemales 0.0% Never married42.9% Now married0.0% Separated0.0% Widowed57.1% DivorcedMarital status - American Indian / Alaska Native population 15 years and over
Males 63.3% Never married36.7% Now married0.0% Separated0.0% Widowed0.0% DivorcedFemales 37.2% Never married32.1% Now married0.0% Separated0.0% Widowed30.8% DivorcedWomen who did not give birth in the past 12 months Now married:
32.9% (25)Unmarried:
67.1% (51)
Marital status - Asian population 15 years and over
Males 100.0% Never married0.0% Now married0.0% Separated0.0% Widowed0.0% DivorcedFemales 61.4% Never married0.0% Now married38.6% Separated0.0% Widowed0.0% DivorcedWomen who did not give birth in the past 12 months Now married:
0.0% (0)Unmarried:
100.0% (40)
Marital status - Native Hawaiian / Pacific Islander population 15 years and over
Males 0.0% Never married100.0% Now married0.0% Separated0.0% Widowed0.0% DivorcedFemales 0.0% Never married68.2% Now married0.0% Separated31.8% Widowed0.0% DivorcedWomen who did not give birth in the past 12 months Now married:
100.0% (16)Unmarried:
0.0% (0)
Marital status - Other race population 15 years and over
Males 63.9% Never married27.3% Now married0.0% Separated0.0% Widowed8.8% DivorcedFemales 66.4% Never married33.2% Now married0.0% Separated0.0% Widowed0.4% DivorcedWomen who gave birth in the past 12 months Now married:
100.0% (1)Unmarried:
0.0% (0)
Women who did not give birth in the past 12 months Now married:
34.3% (116)Unmarried:
65.7% (223)
Marital status - Two or more races population 15 years and over
Males 72.3% Never married22.1% Now married1.0% Separated0.0% Widowed4.5% DivorcedFemales 11.9% Never married54.1% Now married0.0% Separated16.4% Widowed17.6% DivorcedWomen who did not give birth in the past 12 months Now married:
73.3% (97)Unmarried:
26.7% (35)
Marital status - White alone, not Hispanic / Latino population 15 years and over
Males 34.1% Never married36.1% Now married2.2% Separated7.0% Widowed20.6% DivorcedFemales 28.9% Never married49.4% Now married0.0% Separated7.5% Widowed14.2% DivorcedWomen who gave birth in the past 12 months Now married:
100.0% (10)Unmarried:
0.0% (0)
Women who did not give birth in the past 12 months Now married:
44.4% (126)Unmarried:
55.6% (158)
Marital status - Hispanic or Latino population 15 years and over
Males 69.0% Never married25.7% Now married0.0% Separated0.0% Widowed5.3% DivorcedFemales 46.8% Never married35.8% Now married3.6% Separated1.2% Widowed12.6% DivorcedWomen who gave birth in the past 12 months Now married:
100.0% (26)Unmarried:
0.0% (0)
Women who did not give birth in the past 12 months Now married:
38.1% (252)Unmarried:
61.9% (408)
Ancestries in Wood Village
111 4.5% German76 3.1% Irish68 2.7% American57 2.3% Italian50 2.0% Ukrainian28 1.1% English20 0.8% Croatian17 0.7% Polish11 0.4% Scandinavian10 0.4% Greek10 0.4% Norwegian9 0.4% Danish8 0.3% French7 0.3% European4 0.2% Swiss
Children Nativity (place of birth) in Wood Village
Children under 6 years - Living with two parents Both parents native 139 100.0% NativeBoth parents foreign-born 24 41.4% Native34 58.6% Foreign-bornOne native, one foreign-born parent 106 100.0% NativeChildren under 6 years - Living with one parent Native parent 118 100.0% NativeForeign-born parent 64 100.0% NativeChildren 6 to 17 years - Living with two parents Both parents native 194 98.2% Native4 1.8% Foreign-bornBoth parents foreign-born 153 81.8% Native34 18.2% Foreign-bornOne native, one foreign-born parent 104 100.0% NativeChildren 6 to 17 years - Living with one parent Native parent 88 100.0% NativeForeign-born parent 121 59.6% Native82 40.4% Foreign-born
Grandparents responsible for own grandchildren in Wood Village
Grandparents (30 to 59 years) White / Caucasian 18 100.0% Responsible for grandchildrenHispanic or Latino 20 100.0% Responsible for grandchildren
Grandparents (60 years and over) White / Caucasian 25 100.0% Not responsible for grandchildrenHispanic or Latino 9 100.0% Not responsible for grandchildren