Races in Woodland, California (CA) Detailed Stats
Data:
Races - White alone (%)
Races - White alone (% change since 2000)
Races - Black alone (%)
Races - Black alone (% change since 2000)
Races - American Indian alone (%)
Races - American Indian alone (% change since 2000)
Races - Asian alone (%)
Races - Asian alone (% change since 2000)
Races - Hispanic (%)
Races - Hispanic (% change since 2000)
Races - Native Hawaiian and Other Pacific Islander alone (%)
Races - Native Hawaiian and Other Pacific Islander alone (% change since 2000)
Races - Two or more races(%)
Races - Two or more races(% change since 2000)
Races - Other race alone (%)
Races - Other race alone (% change since 2000)
Racial diversity
Place of birth - Born in state of residence (%)
Place of birth - Born in state of residence (%) - White
Place of birth - Born in state of residence (%) - Black or African American
Place of birth - Born in state of residence (%) - Asian
Place of birth - Born in state of residence (%) - Hispanic or Latino
Place of birth - Born in state of residence (%) - American Indian and Alaska Native
Place of birth - Born in state of residence (%) - Multirace
Place of birth - Born in state of residence (%) - Other Race
Place of birth - Born in other state (%)
Place of birth - Born in other state (%) - White
Place of birth - Born in other state (%) - Black or African American
Place of birth - Born in other state (%) - Asian
Place of birth - Born in other state (%) - Hispanic or Latino
Place of birth - Born in other state (%) - American Indian and Alaska Native
Place of birth - Born in other state (%) - Multirace
Place of birth - Born in other state (%) - Other Race
Place of birth - Native, outside of US (%)
Place of birth - Native, outside of US (%) - White
Place of birth - Native, outside of US (%) - Black or African American
Place of birth - Native, outside of US (%) - Asian
Place of birth - Native, outside of US (%) - Hispanic or Latino
Place of birth - Native, outside of US (%) - American Indian and Alaska Native
Place of birth - Native, outside of US (%) - Multirace
Place of birth - Native, outside of US (%) - Other Race
Place of birth - Foreign born (%)
Place of birth - Foreign born (%) - White
Place of birth - Foreign born (%) - Black or African American
Place of birth - Foreign born (%) - Asian
Place of birth - Foreign born (%) - Hispanic or Latino
Place of birth - Foreign born (%) - American Indian and Alaska Native
Place of birth - Foreign born (%) - Multirace
Place of birth - Foreign born (%) - Other Race
Residents speaking English at home (%)
Residents speaking English at home - Born in the United States (%)
Residents speaking English at home - Native, born elsewhere (%)
Residents speaking English at home - Foreign born (%)
Residents speaking Spanish at home (%)
Residents speaking Spanish at home - Born in the United States (%)
Residents speaking Spanish at home - Native, born elsewhere (%)
Residents speaking Spanish at home - Foreign born (%)
Residents speaking other language at home (%)
Residents speaking other language at home - Born in the United States (%)
Residents speaking other language at home - Native, born elsewhere (%)
Residents speaking other language at home - Foreign born (%)
Marital status - Never married (%)
Marital status - Now married (%)
Marital status - Separated (%)
Marital status - Widowed (%)
Marital status - Divorced (%)
Ancestries Reported - Arab (%)
Ancestries Reported - Czech (%)
Ancestries Reported - Danish (%)
Ancestries Reported - Dutch (%)
Ancestries Reported - English (%)
Ancestries Reported - French (%)
Ancestries Reported - French Canadian (%)
Ancestries Reported - German (%)
Ancestries Reported - Greek (%)
Ancestries Reported - Hungarian (%)
Ancestries Reported - Irish (%)
Ancestries Reported - Italian (%)
Ancestries Reported - Lithuanian (%)
Ancestries Reported - Norwegian (%)
Ancestries Reported - Polish (%)
Ancestries Reported - Portuguese (%)
Ancestries Reported - Russian (%)
Ancestries Reported - Scotch-Irish (%)
Ancestries Reported - Scottish (%)
Ancestries Reported - Slovak (%)
Ancestries Reported - Subsaharan African (%)
Ancestries Reported - Swedish (%)
Ancestries Reported - Swiss (%)
Ancestries Reported - Ukrainian (%)
Ancestries Reported - United States (%)
Ancestries Reported - Welsh (%)
Ancestries Reported - West Indian (%)
Ancestries Reported - Other (%)
Geographical mobility - Same house 1 year ago (%)
Geographical mobility - Same house 1 year ago (%) - White
Geographical mobility - Same house 1 year ago (%) - Black or African American
Geographical mobility - Same house 1 year ago (%) - Asian
Geographical mobility - Same house 1 year ago (%) - Hispanic or Latino
Geographical mobility - Same house 1 year ago (%) - American Indian and Alaska Native
Geographical mobility - Same house 1 year ago (%) - Multirace
Geographical mobility - Same house 1 year ago (%) - Other Race
Geographical mobility - Moved within same county (%)
Geographical mobility - Moved within same county (%) - White
Geographical mobility - Moved within same county (%) - Black or African American
Geographical mobility - Moved within same county (%) - Asian
Geographical mobility - Moved within same county (%) - Hispanic or Latino
Geographical mobility - Moved within same county (%) - American Indian and Alaska Native
Geographical mobility - Moved within same county (%) - Multirace
Geographical mobility - Moved within same county (%) - Other Race
Geographical mobility - Moved from different county within same state (%)
Geographical mobility - Moved from different county within same state (%) - White
Geographical mobility - Moved from different county within same state (%) - Black or African American
Geographical mobility - Moved from different county within same state (%) - Asian
Geographical mobility - Moved from different county within same state (%) - Hispanic or Latino
Geographical mobility - Moved from different county within same state (%) - American Indian and Alaska Native
Geographical mobility - Moved from different county within same state (%) - Multirace
Geographical mobility - Moved from different county within same state (%) - Other Race
Geographical mobility - Moved from different state (%)
Geographical mobility - Moved from different state (%) - White
Geographical mobility - Moved from different state (%) - Black or African American
Geographical mobility - Moved from different state (%) - Asian
Geographical mobility - Moved from different state (%) - Hispanic or Latino
Geographical mobility - Moved from different state (%) - American Indian and Alaska Native
Geographical mobility - Moved from different state (%) - Multirace
Geographical mobility - Moved from different state (%) - Other Race
Geographical mobility - Moved from abroad (%)
Geographical mobility - Moved from abroad (%) - White
Geographical mobility - Moved from abroad (%) - Black or African American
Geographical mobility - Moved from abroad (%) - Asian
Geographical mobility - Moved from abroad (%) - Hispanic or Latino
Geographical mobility - Moved from abroad (%) - American Indian and Alaska Native
Geographical mobility - Moved from abroad (%) - Multirace
Geographical mobility - Moved from abroad (%) - Other Race
Place of birth for the foreign-born population - Ireland (%)
Place of birth for the foreign-born population - Denmark (%)
Place of birth for the foreign-born population - Norway (%)
Place of birth for the foreign-born population - Sweden (%)
Place of birth for the foreign-born population - United Kingdom (%)
Place of birth for the foreign-born population - England (%)
Place of birth for the foreign-born population - Scotland (%)
Place of birth for the foreign-born population - Other Northern Europe (%)
Place of birth for the foreign-born population - Austria (%)
Place of birth for the foreign-born population - Belgium (%)
Place of birth for the foreign-born population - France (%)
Place of birth for the foreign-born population - Germany (%)
Place of birth for the foreign-born population - Netherlands (%)
Place of birth for the foreign-born population - Switzerland (%)
Place of birth for the foreign-born population - Other Western Europe (%)
Place of birth for the foreign-born population - Greece (%)
Place of birth for the foreign-born population - Italy (%)
Place of birth for the foreign-born population - Portugal (%)
Place of birth for the foreign-born population - Spain (%)
Place of birth for the foreign-born population - Other Southern Europe (%)
Place of birth for the foreign-born population - Albania (%)
Place of birth for the foreign-born population - Belarus (%)
Place of birth for the foreign-born population - Bosnia and Herzegovina (%)
Place of birth for the foreign-born population - Bulgaria (%)
Place of birth for the foreign-born population - Croatia (%)
Place of birth for the foreign-born population - Czechoslovakia (%)
Place of birth for the foreign-born population - Hungary (%)
Place of birth for the foreign-born population - Latvia (%)
Place of birth for the foreign-born population - Lithuania (%)
Place of birth for the foreign-born population - North Macedonia (Macedonia) (%)
Place of birth for the foreign-born population - Moldova (%)
Place of birth for the foreign-born population - Poland (%)
Place of birth for the foreign-born population - Romania (%)
Place of birth for the foreign-born population - Russia (%)
Place of birth for the foreign-born population - Serbia (%)
Place of birth for the foreign-born population - Ukraine (%)
Place of birth for the foreign-born population - Other Eastern Europe (%)
Place of birth for the foreign-born population - China (%)
Place of birth for the foreign-born population - Hong Kong (%)
Place of birth for the foreign-born population - Taiwan (%)
Place of birth for the foreign-born population - Japan (%)
Place of birth for the foreign-born population - Korea (%)
Place of birth for the foreign-born population - Other Eastern Asia (%)
Place of birth for the foreign-born population - Afghanistan (%)
Place of birth for the foreign-born population - Bangladesh (%)
Place of birth for the foreign-born population - India (%)
Place of birth for the foreign-born population - Iran (%)
Place of birth for the foreign-born population - Kazakhstan (%)
Place of birth for the foreign-born population - Nepal (%)
Place of birth for the foreign-born population - Pakistan (%)
Place of birth for the foreign-born population - Sri Lanka (%)
Place of birth for the foreign-born population - Uzbekistan (%)
Place of birth for the foreign-born population - Other South Central Asia (%)
Place of birth for the foreign-born population - Burma (%)
Place of birth for the foreign-born population - Cambodia (%)
Place of birth for the foreign-born population - Indonesia (%)
Place of birth for the foreign-born population - Laos (%)
Place of birth for the foreign-born population - Malaysia (%)
Place of birth for the foreign-born population - Philippines (%)
Place of birth for the foreign-born population - Singapore (%)
Place of birth for the foreign-born population - Thailand (%)
Place of birth for the foreign-born population - Vietnam (%)
Place of birth for the foreign-born population - Other South Eastern Asia (%)
Place of birth for the foreign-born population - Armenia (%)
Place of birth for the foreign-born population - Iraq (%)
Place of birth for the foreign-born population - Israel (%)
Place of birth for the foreign-born population - Jordan (%)
Place of birth for the foreign-born population - Kuwait (%)
Place of birth for the foreign-born population - Lebanon (%)
Place of birth for the foreign-born population - Saudi Arabia (%)
Place of birth for the foreign-born population - Syria (%)
Place of birth for the foreign-born population - Turkey (%)
Place of birth for the foreign-born population - Yemen (%)
Place of birth for the foreign-born population - Other Western Asia (%)
Place of birth for the foreign-born population - Eritrea (%)
Place of birth for the foreign-born population - Ethiopia (%)
Place of birth for the foreign-born population - Kenya (%)
Place of birth for the foreign-born population - Somalia (%)
Place of birth for the foreign-born population - Uganda (%)
Place of birth for the foreign-born population - Zimbabwe (%)
Place of birth for the foreign-born population - Other Eastern Africa (%)
Place of birth for the foreign-born population - Cameroon (%)
Place of birth for the foreign-born population - Congo (%)
Place of birth for the foreign-born population - Democratic Republic of Congo (Zaire) (%)
Place of birth for the foreign-born population - Other Middle Africa (%)
Place of birth for the foreign-born population - Egypt (%)
Place of birth for the foreign-born population - Morocco (%)
Place of birth for the foreign-born population - Sudan (%)
Place of birth for the foreign-born population - Other Northern Africa (%)
Place of birth for the foreign-born population - South Africa (%)
Place of birth for the foreign-born population - Other Southern Africa (%)
Place of birth for the foreign-born population - Cabo Verde (%)
Place of birth for the foreign-born population - Ghana (%)
Place of birth for the foreign-born population - Liberia (%)
Place of birth for the foreign-born population - Nigeria (%)
Place of birth for the foreign-born population - Senegal (%)
Place of birth for the foreign-born population - Sierra Leone (%)
Place of birth for the foreign-born population - Other Western Africa (%)
Place of birth for the foreign-born population - Australia (%)
Place of birth for the foreign-born population - New Zealand (%)
Place of birth for the foreign-born population - Fiji (%)
Place of birth for the foreign-born population - Micronesia (%)
Place of birth for the foreign-born population - Bahamas (%)
Place of birth for the foreign-born population - Barbados (%)
Place of birth for the foreign-born population - Cuba (%)
Place of birth for the foreign-born population - Dominica (%)
Place of birth for the foreign-born population - Dominican Republic (%)
Place of birth for the foreign-born population - Grenada (%)
Place of birth for the foreign-born population - Haiti (%)
Place of birth for the foreign-born population - Jamaica (%)
Place of birth for the foreign-born population - St. Vincent and the Grenadines (%)
Place of birth for the foreign-born population - Trinidad and Tobago (%)
Place of birth for the foreign-born population - West Indies (%)
Place of birth for the foreign-born population - Other Caribbean (%)
Place of birth for the foreign-born population - Belize (%)
Place of birth for the foreign-born population - Costa Rica (%)
Place of birth for the foreign-born population - El Salvador (%)
Place of birth for the foreign-born population - Guatemala (%)
Place of birth for the foreign-born population - Honduras (%)
Place of birth for the foreign-born population - Mexico (%)
Place of birth for the foreign-born population - Nicaragua (%)
Place of birth for the foreign-born population - Panama (%)
Place of birth for the foreign-born population - Other Central America (%)
Place of birth for the foreign-born population - Argentina (%)
Place of birth for the foreign-born population - Bolivia (%)
Place of birth for the foreign-born population - Brazil (%)
Place of birth for the foreign-born population - Chile (%)
Place of birth for the foreign-born population - Colombia (%)
Place of birth for the foreign-born population - Ecuador (%)
Place of birth for the foreign-born population - Guyana (%)
Place of birth for the foreign-born population - Peru (%)
Place of birth for the foreign-born population - Uruguay (%)
Place of birth for the foreign-born population - Venezuela (%)
Place of birth for the foreign-born population - Other South America (%)
Place of birth for the foreign-born population - Canada (%)
Place of birth for the foreign-born population - Other Northern America (%)
Place of birth for the foreign-born population - Other (%)
Latest news about races in Woodland, CA collected exclusively by city-data.com from local newspapers, TV, and radio stations
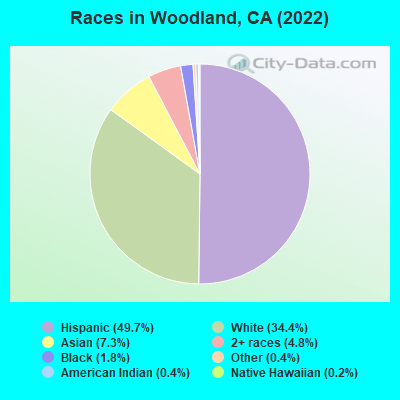
According to 2022 data, the most numerous races in Woodland, CA are Hispanic (29,846 residents), White alone (21,859 residents), and Asian alone (5,005 residents). 56.3% of Woodland residents speak English at home. 23.3% of Woodland, CA residents are foreign-born (16.6% born in Latin America, 5.3% born in Asia), which is 11.8% less than the foreign-born rate of 26.0% across the entire state of California.
Race distribution in Woodland
2000 2022
15,816,790 46.7% White alone 10,966,556 32.4% Hispanic 3,648,860 10.8% Asian alone 2,181,926 6.4% Black alone 903,115 2.7% Two or more races 178,984 0.5% American Indian alone 103,736 0.3% Native Hawaiian and Other 71,681 0.2% Other race alone
15,732,184 40.3% Hispanic 13,160,426 33.7% White alone 5,957,867 15.3% Asian alone 2,025,218 5.2% Black alone 1,663,222 4.3% Two or more races 251,618 0.6% Other race alone 135,777 0.3% Native Hawaiian and Other 103,030 0.3% American Indian alone
Income and house value in Woodland Median household income in 2022 $106,475 White non-Hispanic householders$28,734 Black householders$66,777 American Indian and Alaska Native householders$98,054 Asian householders$63,607 Native Hawaiian and other Pacific Islander householders$68,280 Some other race householders$86,906 Two or more races householders$71,915 Hispanic or Latino race householdersMedian 2022 house value $573,727 White Non-Hispanic householders$512,179 Black or African American householders$420,037 American Indian or Alaska Native householders $552,851 Asian householders$643,554 Native Hawaiian and other Pacific Islander householders$492,383 Some other race householders$506,780 Two or more races householders$504,981 Hispanic or Latino householders
Median age by race in Woodland
39.6 Median age for White residents38.7 40.9 36.3 Median age for Black or African American residents32.7 45.3 39.1 Median age for American Indian / Alaska Native residents40.6 48.8 41.9 Median age for Asian residents47.1 37.2 30.4 Median age for Native Hawaiian / Pacific Islander residents37.4 Median age for Other race residents39.8 34.8 27.4 Median age for Two or more races residents20.0 31.1 46.2 Median age for White alone residents44.3 47.9 32.1 Median age for Hispanic or Latino residents31.3 31.0
Owner/renter occupied households by race in Woodland
House owners and renters - White residents 8,240 57.0% Owner occupied6,226 43.0% Renter occupiedHouse owners and renters - Black or African American residents 72 32.5% Owner occupied150 67.5% Renter occupiedHouse owners and renters - American Indian / Alaska Native residents 170 43.4% Owner occupied222 56.6% Renter occupiedHouse owners and renters - Asian residents 1,160 55.9% Owner occupied915 44.1% Renter occupiedHouse owners and renters - Native Hawaiian / Pacific Islander residents 4 18.3% Owner occupied18 81.7% Renter occupiedHouse owners and renters - Other race residents 663 50.1% Owner occupied661 49.9% Renter occupiedHouse owners and renters - Two or more races residents 1,210 69.3% Owner occupied535 30.7% Renter occupiedHouse owners and renters - White alone residents 6,317 66.0% Owner occupied3,258 34.0% Renter occupiedHouse owners and renters - Hispanic or Latino residents 3,894 43.4% Owner occupied5,085 56.6% Renter occupied
Language usage in Woodland
English speakers - Total 56.3% of residents of Woodland speak English at home.
35.5% of residents speak Spanish at home 13,348 66.7% Speak English very well6,661 33.3% Speak English less than very well8.2% of residents speak other language at home 3,152 68.3% Speak English very well1,461 31.7% Speak English less than very well
English speakers - Born in the United States 87.2% of residents of Woodland speak English at home.
9.4% of residents speak Spanish at home 531 76.8% Speak English very well160 23.2% Speak English less than very well3.3% of residents speak other language at home 235 95.9% Speak English very well10 4.1% Speak English less than very well
English speakers - Native, born elsewhere 49.5% of residents of Woodland speak English at home.
35.1% of residents speak Spanish at home 272 91.6% Speak English very well25 8.4% Speak English less than very well15.6% of residents speak other language at home 123 93.2% Speak English very well9 6.8% Speak English less than very well
English speakers - Foreign-born 7.7% of residents of Woodland speak English at home.
66.9% of residents speak Spanish at home 3,734 40.6% Speak English very well5,454 59.4% Speak English less than very well24.3% of residents speak other language at home 1,925 57.6% Speak English very well1,417 42.4% Speak English less than very well
White (Caucasian) - Speak only English Native:
80.5% (25,144)Foreign-born:
11.8% (589)
White (Caucasian) - Speak another language Native:
18.2% (5,695)Foreign-born:
85.3% (4,254)
Black or African American - Speak only English Native:
84.9% (757)Foreign-born:
29.5% (43)
Black or African American - Speak another language Native:
16.7% (149)Foreign-born:
70.9% (103)
American Indian / Alaska Native - Speak only English Native:
48.5% (383)Foreign-born:
15.3% (27)
American Indian / Alaska Native - Speak another language Native:
61.0% (482)Foreign-born:
83.6% (145)
Asian - Speak only English Native:
43.9% (705)Foreign-born:
5.1% (167)
Asian - Speak another language Native:
54.5% (876)Foreign-born:
94.4% (3,102)
Native Hawaiian / Pacific Islander - Speak another language Native:
26.7% (13)Foreign-born:
96.4% (66)
Other race - Speak only English Native:
38.6% (1,035)Foreign-born:
5.6% (88)
Other race - Speak another language Native:
62.3% (1,672)Foreign-born:
94.4% (1,489)
Two or more races - Speak only English Native:
69.5% (2,882)Foreign-born:
11.2% (79)
Two or more races - Speak another language Native:
21.5% (893)Foreign-born:
81.5% (575)
White alone - Speak only English Native:
99.1% (20,996)Foreign-born:
79.0% (483)
White alone - Speak another language Native:
1.6% (339)Foreign-born:
37.2% (227)
Hispanic or Latino - Speak only English Native:
42.9% (8,344)Foreign-born:
3.4% (301)
Hispanic or Latino - Speak another language Native:
56.6% (11,008)Foreign-born:
96.1% (8,426)
Foreign-born residents in Woodland 14,112 residents are foreign born (16.6% Latin America , 5.3% Asia ).
This city:
23.3%California:
100.0%
Marital status for residents in Woodland Marital status - White (Caucasian) population 15 years and over
Males 34.1% Never married53.0% Now married1.9% Separated2.3% Widowed8.6% DivorcedFemales 29.5% Never married47.7% Now married3.4% Separated7.7% Widowed11.7% DivorcedWomen who gave birth in the past 12 months Now married:
61.4% (215)Unmarried:
38.6% (135)
Women who did not give birth in the past 12 months Now married:
46.5% (4,105)Unmarried:
53.5% (4,733)
Marital status - Black or African American population 15 years and over
Males 52.6% Never married34.0% Now married8.8% Separated0.0% Widowed4.6% DivorcedFemales 36.4% Never married29.5% Now married1.2% Separated15.7% Widowed17.3% DivorcedWomen who did not give birth in the past 12 months Now married:
28.1% (79)Unmarried:
71.9% (202)
Marital status - American Indian / Alaska Native population 15 years and over
Males 31.4% Never married41.2% Now married0.0% Separated2.9% Widowed24.5% DivorcedFemales 20.1% Never married53.6% Now married0.0% Separated13.2% Widowed13.2% DivorcedWomen who gave birth in the past 12 months Now married:
100.0% (20)Unmarried:
0.0% (0)
Women who did not give birth in the past 12 months Now married:
57.6% (138)Unmarried:
42.4% (102)
Marital status - Asian population 15 years and over
Males 27.7% Never married68.2% Now married0.3% Separated3.7% Widowed0.1% DivorcedFemales 25.6% Never married55.4% Now married0.7% Separated5.0% Widowed13.3% DivorcedWomen who gave birth in the past 12 months Now married:
100.0% (83)Unmarried:
0.0% (0)
Women who did not give birth in the past 12 months Now married:
50.8% (706)Unmarried:
49.2% (683)
Marital status - Native Hawaiian / Pacific Islander population 15 years and over
Males 14.8% Never married85.2% Now married0.0% Separated0.0% Widowed0.0% DivorcedFemales 0.0% Never married86.2% Now married0.0% Separated0.0% Widowed13.8% DivorcedWomen who did not give birth in the past 12 months Now married:
100.0% (24)Unmarried:
0.0% (0)
Marital status - Other race population 15 years and over
Males 42.2% Never married51.5% Now married0.3% Separated2.1% Widowed3.9% DivorcedFemales 30.6% Never married56.9% Now married1.5% Separated4.9% Widowed6.1% DivorcedWomen who gave birth in the past 12 months Now married:
73.8% (51)Unmarried:
26.2% (18)
Women who did not give birth in the past 12 months Now married:
52.3% (772)Unmarried:
47.7% (705)
Marital status - Two or more races population 15 years and over
Males 48.4% Never married31.8% Now married0.4% Separated0.9% Widowed18.4% DivorcedFemales 49.7% Never married33.6% Now married0.0% Separated4.3% Widowed12.5% DivorcedWomen who gave birth in the past 12 months Now married:
100.0% (36)Unmarried:
0.0% (0)
Women who did not give birth in the past 12 months Now married:
27.3% (415)Unmarried:
72.7% (1,101)
Marital status - White alone, not Hispanic / Latino population 15 years and over
Males 29.4% Never married55.1% Now married1.0% Separated3.6% Widowed10.8% DivorcedFemales 25.0% Never married49.3% Now married2.8% Separated10.4% Widowed12.5% DivorcedWomen who gave birth in the past 12 months Now married:
67.4% (135)Unmarried:
32.6% (65)
Women who did not give birth in the past 12 months Now married:
47.7% (2,278)Unmarried:
52.3% (2,498)
Marital status - Hispanic or Latino population 15 years and over
Males 41.1% Never married49.9% Now married2.3% Separated0.9% Widowed5.9% DivorcedFemales 34.8% Never married47.1% Now married3.4% Separated4.7% Widowed9.9% DivorcedWomen who gave birth in the past 12 months Now married:
61.1% (182)Unmarried:
38.9% (116)
Women who did not give birth in the past 12 months Now married:
46.0% (3,534)Unmarried:
54.0% (4,155)
Ancestries in Woodland
1,322 3.7% English1,238 3.5% German981 2.8% European704 2.0% American694 2.0% Irish380 1.1% Italian272 0.8% Scottish160 0.5% Norwegian155 0.4% Scotch-Irish151 0.4% Portuguese128 0.4% Swedish124 0.4% Dutch120 0.3% Turkish92 0.3% British85 0.2% French80 0.2% Polish76 0.2% Canadian75 0.2% Swiss69 0.2% Northern European69 0.2% Ukrainian50 0.1% Jamaican48 0.1% Danish48 0.1% French Canadian46 0.1% Moroccan42 0.1% Australian41 0.1% Russian41 0.1% African33 0.09% Lithuanian27 0.08% Lebanese23 0.07% Finnish23 0.07% Afghan21 0.06% Austrian20 0.06% Greek17 0.05% Hungarian16 0.05% Croatian16 0.05% Welsh15 0.04% Slovene14 0.04% Trinidadian and Tobagonian12 0.03% Scandinavian11 0.03% Bulgarian10 0.03% Pennsylvania German10 0.03% Eastern European9 0.03% Armenian9 0.03% Iranian7 0.02% Maltese7 0.02% South African6 0.02% Czech6 0.02% West Indian3 0.01% Serbian
Geographical mobility in Woodland Same house 1 year ago 32,556 90.6% White (Caucasian)895 82.1% Black or African American788 80.2% American Indian / Alaska Native4,223 82.3% Asian70 62.7% Native Hawaiian / Pacific Islander5,617 85.3% Other race6,081 87.4% Two or more races19,622 88.7% White alone, not Hispanic / Latino25,973 89.5% Hispanic or LatinoMoved within same county 2,350 6.5% White / Caucasian91 8.4% Black or African American144 14.6% American Indian / Alaska Native382 7.4% Asian38 34.1% Native Hawaiian / Pacific Islander645 9.8% Other race447 6.4% Two or more races1,687 7.6% White alone, not Hispanic / Latino2,190 7.5% Hispanic or LatinoMoved within same state 815 2.3% White / Caucasian65 6.0% Black or African American28 2.9% American Indian / Alaska Native159 3.1% Asian191 2.9% Other race171 2.5% Two or more races628 2.8% White alone, not Hispanic / Latino582 2.0% Hispanic or LatinoMoved from different state 203 0.6% White / Caucasian39 3.5% Black or African American4 0.4% American Indian / Alaska Native84 1.6% Asian31 0.5% Other race122 1.8% Two or more races161 0.7% White alone, not Hispanic / Latino110 0.4% Hispanic or LatinoMoved from abroad 72 0.2% White135 2.6% Asian18 0.3% Other race80 1.2% Two or more races55 0.2% White alone, not Hispanic / Latino97 0.3% Hispanic or Latino
Children Nativity (place of birth) in Woodland
Children under 6 years - Living with two parents Both parents native 1,433 100.0% NativeBoth parents foreign-born 786 96.0% Native33 4.0% Foreign-bornOne native, one foreign-born parent 559 96.1% Native23 3.9% Foreign-bornChildren under 6 years - Living with one parent Native parent 682 100.0% NativeForeign-born parent 166 100.0% NativeChildren 6 to 17 years - Living with two parents Both parents native 2,548 100.0% NativeBoth parents foreign-born 1,938 89.7% Native223 10.3% Foreign-bornOne native, one foreign-born parent 1,429 96.1% Native58 3.9% Foreign-bornChildren 6 to 17 years - Living with one parent Native parent 2,060 100.0% NativeForeign-born parent 778 52.9% Native692 47.1% Foreign-born
Grandparents responsible for own grandchildren in Woodland
Grandparents (30 to 59 years) White / Caucasian 71 23.7% Responsible for grandchildren227 76.3% Not responsible for grandchildrenAsian 44 100.0% Not responsible for grandchildrenOther race 9 20.0% Responsible for grandchildren36 80.0% Not responsible for grandchildrenTwo or more races 15 100.0% Not responsible for grandchildrenWhite alone, not Hispanic / Latino 29 38.1% Responsible for grandchildren47 61.9% Not responsible for grandchildrenHispanic or Latino 75 18.4% Responsible for grandchildren335 81.6% Not responsible for grandchildrenGrandparents (60 years and over) White / Caucasian 106 24.9% Responsible for grandchildren319 75.1% Not responsible for grandchildrenAsian 18 13.3% Responsible for grandchildren121 86.7% Not responsible for grandchildrenOther race 165 100.0% Not responsible for grandchildrenTwo or more races 199 100.0% Not responsible for grandchildrenWhite alone, not Hispanic / Latino 72 40.5% Responsible for grandchildren105 59.5% Not responsible for grandchildrenHispanic or Latino 100 16.9% Responsible for grandchildren493 83.1% Not responsible for grandchildren