Races in Wyomissing, Pennsylvania (PA) Detailed Stats
Ancestries, Foreign-born residents, place of birth
Settings
X


Recent posts about races in Wyomissing, Pennsylvania on our local forum with over 2,400,000 registered users:
 | Is Taylor Swift the most famous person to ever come from the Philly area? (220 replies) |
| Other than Pittsburgh and Philadelphia what is your favorite smaller city in Pennsylvania? (44 replies) |
| Berks County (Reading) (13 replies) |
| Wyomissing vs. Lititz vs. Lancaster? Family with 9 & 6 yo (7 replies) |
| Where to locate near Reading, PA (6 replies) |
| Reading is safe or not ? (10 replies) |
Latest news about races in Wyomissing, PA collected exclusively by city-data.com from local newspapers, TV, and radio stations
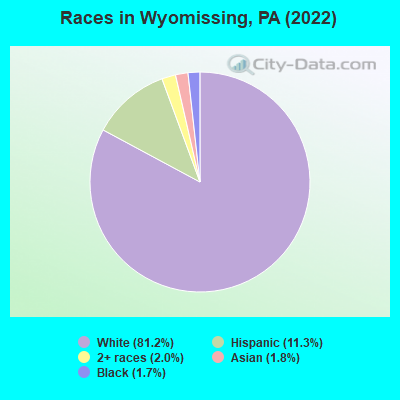
According to 2022 data, the most numerous races in Wyomissing, PA are White alone (9,027 residents), Black alone (190 residents), and Hispanic (1,255 residents). 85.1% of Wyomissing residents speak English at home. 8.1% of Wyomissing, PA residents are foreign-born (2.6% born in Europe, 2.2% born in Latin America, 1.4% born in Asia, 1.3% born in Africa), which is 13.8% greater than the foreign-born rate of 7.0% across the entire state of Pennsylvania.
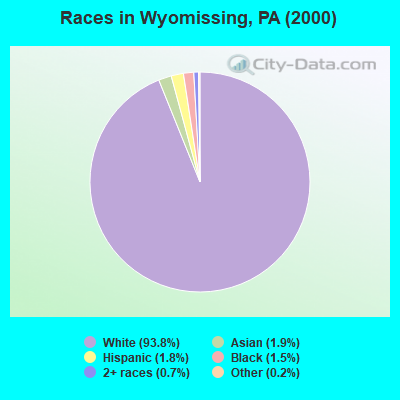
Race distribution in Wyomissing
2000
2022

- 8,05593.8%White alone
- 1631.9%Asian alone
- 1571.8%Hispanic
- 1251.5%Black alone
- 600.7%Two or more races
- 190.2%Other race alone
- 60.07%American Indian alone
- 20.02%Native Hawaiian and Other
Pacific Islander alone
-
- 9,02781.2%White alone
- 1,25511.3%Hispanic
- 2242.0%Two or more races
- 2001.8%Asian alone
- 1901.7%Black alone
- 50.04%American Indian alone
2000
2022
-
- 10,322,45584.1%White alone
- 1,202,4379.8%Black alone
- 394,0883.2%Hispanic
- 218,2961.8%Asian alone
- 113,0970.9%Two or more races
- 13,0860.1%Other race alone
- 14,9040.1%American Indian alone
- 2,6910.02%Native Hawaiian and Other
Pacific Islander alone

-
- 9,487,22873.1%White alone
- 1,311,58110.1%Black alone
- 1,115,9978.6%Hispanic
- 493,9423.8%Two or more races
- 487,1243.8%Asian alone
- 63,5820.5%Other race alone
- 10,1300.08%American Indian alone
- 2,4240.02%Native Hawaiian and Other
Pacific Islander alone

Income and house value in Wyomissing
- Median household income in 2022
- $90,323White non-Hispanic householders
- $54,961Two or more races householders
- $57,247Hispanic or Latino race householders
- Median 2022 house value
- $365,564White Non-Hispanic householders
- $169,452Black or African American householders
- $571,844Asian householders
- $508,356Some other race householders
- $124,264Two or more races householders
- $360,142Hispanic or Latino householders
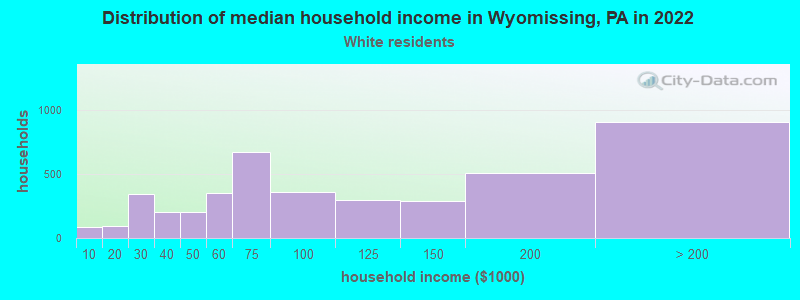
Household income for White non-Hispanic householders
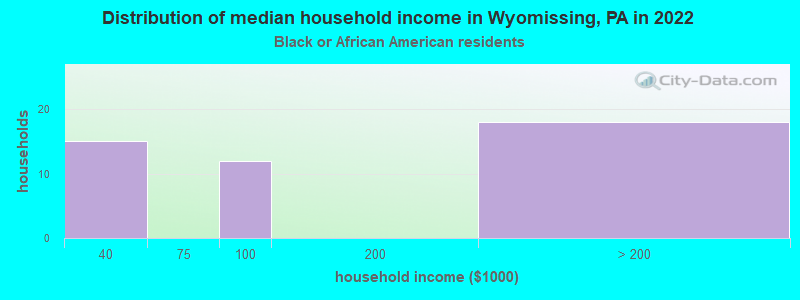
Household income for Black householders
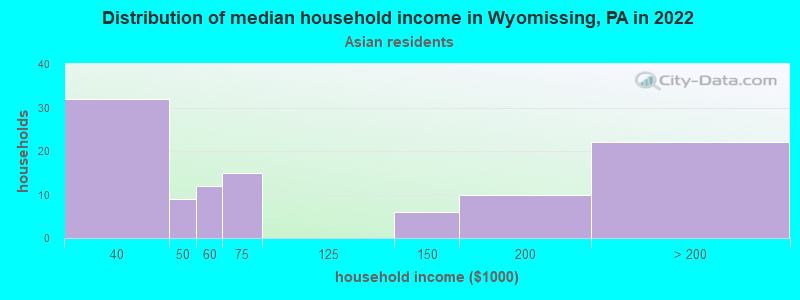
Household income for Asian householders
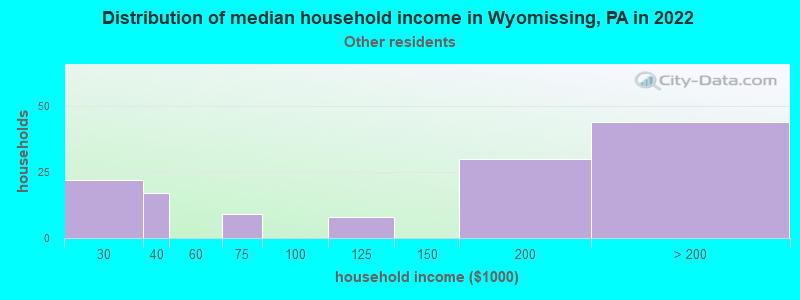
Household income for Some other race householders
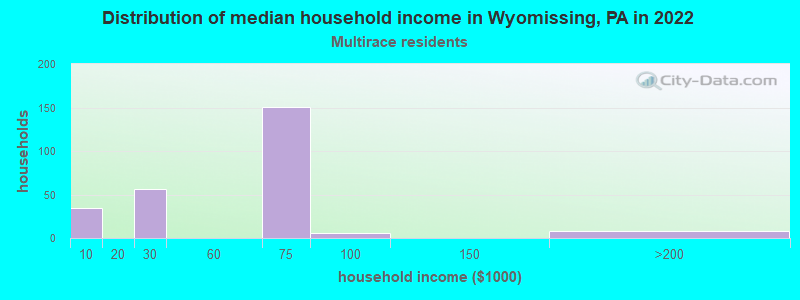
Household income for Two or more races householders
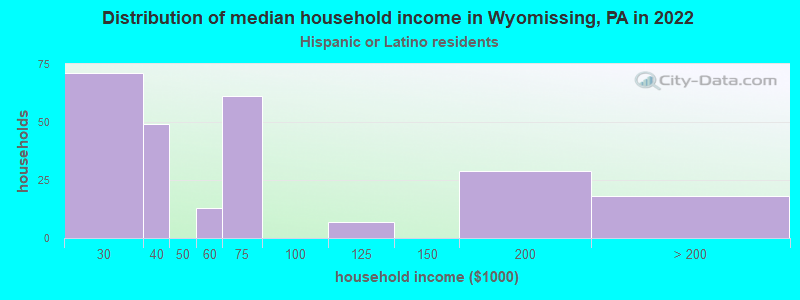
Household income for Hispanic or Latino race householders
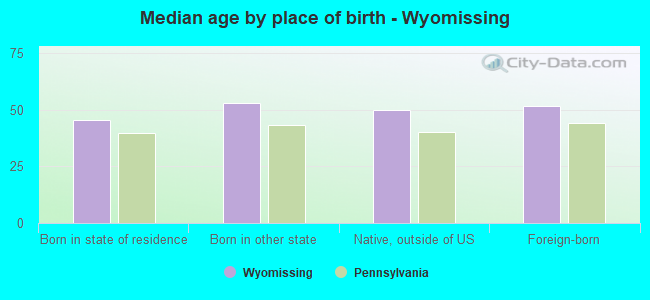
Median age by race in Wyomissing
- 54.8Median age for White residents
- 49.1Males
- 57.3Females
- 40.2Median age for Black or African American residents
- 37.0Males
- 37.0Females
- -773,162,938.5Median age for American Indian / Alaska Native residents
- -720,909,885.5Males
- -663,507,108.3Females
- 58.6Median age for Asian residents
- 46.8Males
- 70.1Females
- -680,432,644.4Median age for Native Hawaiian / Pacific Islander residents
- -649,523,808.9Males
- -747,474,746.7Females
- 28.9Median age for Other race residents
- 43.0Males
- 25.8Females
- 22.1Median age for Two or more races residents
- 17.2Males
- 24.6Females
- 54.5Median age for White alone residents
- 49.9Males
- 57.1Females
- 25.2Median age for Hispanic or Latino residents
- 29.0Males
- 20.5Females
Owner/renter occupied households by race in Wyomissing
- House owners and renters - White residents
- 3,12673.6%Owner occupied
- 1,12026.4%Renter occupied
- House owners and renters - Black or African American residents
- 50100.0%Renter occupied
- House owners and renters - American Indian / Alaska Native residents
- 10100.0%Renter occupied
- House owners and renters - Asian residents
- 3736.6%Owner occupied
- 6463.4%Renter occupied
- House owners and renters - Other race residents
- 3036.4%Owner occupied
- 5363.6%Renter occupied
- House owners and renters - Two or more races residents
- 14867.1%Owner occupied
- 7332.9%Renter occupied
- House owners and renters - White alone residents
- 3,19773.5%Owner occupied
- 1,15226.5%Renter occupied
- House owners and renters - Hispanic or Latino residents
- 9440.9%Owner occupied
- 13559.1%Renter occupied
Language usage in Wyomissing
- English speakers - Total
- 85.1% of residents of Wyomissing speak English at home.
- 7.5% of residents speak Spanish at home
- 51864.0%Speak English very well
- 29236.0%Speak English less than very well
- 6.0% of residents speak other language at home
- 51179.8%Speak English very well
- 12920.2%Speak English less than very well
- English speakers - Born in the United States
- 86.5% of residents of Wyomissing speak English at home.
- 6.9% of residents speak Spanish at home
- 11780.7%Speak English very well
- 2819.3%Speak English less than very well
- 2.5% of residents speak other language at home
- 52100.0%Speak English very well
- English speakers - Native, born elsewhere
- 31.8% of residents of Wyomissing speak English at home.
- 60.9% of residents speak Spanish at home
- 15554.6%Speak English very well
- 12945.4%Speak English less than very well
- English speakers - Foreign-born
- 24.0% of residents of Wyomissing speak English at home.
- 24.0% of residents speak Spanish at home
- 9038.5%Speak English very well
- 14461.5%Speak English less than very well
- 40.1% of residents speak other language at home
- 28172.1%Speak English very well
- 10927.9%Speak English less than very well
White (Caucasian) - Speak only English
| Native: | 99.4% (8,346) |
| Foreign-born: | 68.1% (168) |
White (Caucasian) - Speak another language
| Native: | 1.5% (128) |
| Foreign-born: | 44.8% (111) |
Black or African American - Speak only English
| Native: | 99.9% (41) |
| Foreign-born: | 42.7% (40) |
Asian - Speak another language
| Native: | 66.3% (42) |
| Foreign-born: | 100.0% (183) |
Other race - Speak another language
| Native: | 57.5% (211) |
| Foreign-born: | 100.0% (72) |
Two or more races - Speak only English
| Native: | 38.4% (254) |
| Foreign-born: | 100.0% (74) |
Two or more races - Speak another language
| Native: | 64.8% (428) |
| Foreign-born: | 11.5% (8) |
White alone - Speak only English
| Native: | 97.1% (8,284) |
| Foreign-born: | 67.0% (182) |
White alone - Speak another language
| Native: | 2.8% (240) |
| Foreign-born: | 37.4% (102) |
Hispanic or Latino - Speak another language
| Native: | 55.7% (479) |
| Foreign-born: | 100.0% (246) |
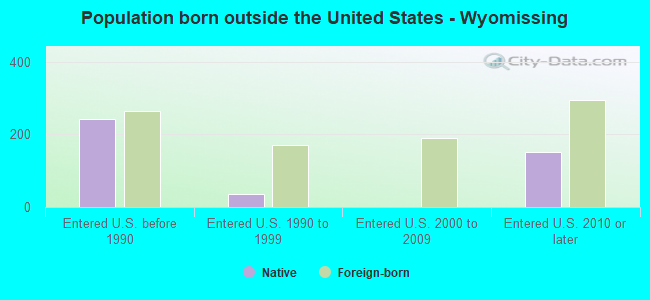
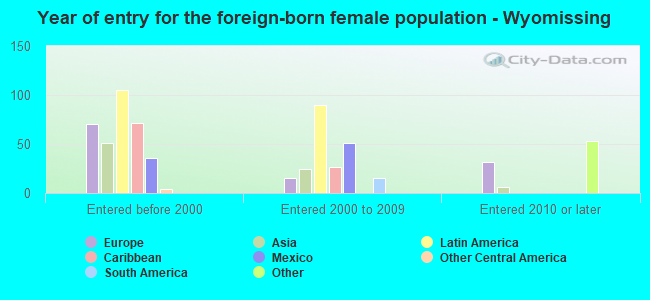
Foreign-born residents in Wyomissing
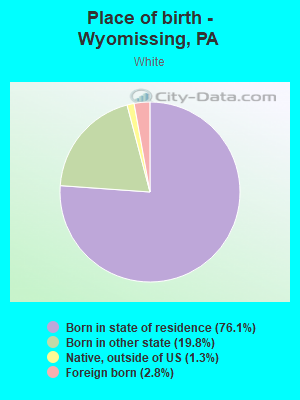
903 residents are foreign born (2.6% Europe, 2.2% Latin America, 1.4% Asia, 1.3% Africa).
| This city: | 8.1% |
| Pennsylvania: | 7.3% |
Marital status for residents in Wyomissing
Marital status - White (Caucasian) population 15 years and over
- Males
- 27.6%Never married
- 57.1%Now married
- 0.8%Separated
- 7.3%Widowed
- 7.3%Divorced
- Females
- 15.3%Never married
- 53.1%Now married
- 1.4%Separated
- 17.4%Widowed
- 12.8%Divorced
Women who gave birth in the past 12 months
| Now married: | 76.9% (36) |
| Unmarried: | 23.1% (11) |
Women who did not give birth in the past 12 months
| Now married: | 57.1% (733) |
| Unmarried: | 42.9% (552) |
Marital status - Black or African American population 15 years and over
- Males
- 56.0%Never married
- 44.0%Now married
- 0.0%Separated
- 0.0%Widowed
- 0.0%Divorced
- Females
- 0.0%Never married
- 100.0%Now married
- 0.0%Separated
- 0.0%Widowed
- 0.0%Divorced
Women who did not give birth in the past 12 months
| Now married: | 100.0% (37) |
| Unmarried: | 0.0% (0) |
Marital status - American Indian / Alaska Native population 15 years and over
- Males
- 0.0%Never married
- 100.0%Now married
- 0.0%Separated
- 0.0%Widowed
- 0.0%Divorced
- Females
- 0.0%Never married
- 100.0%Now married
- 0.0%Separated
- 0.0%Widowed
- 0.0%Divorced
Marital status - Asian population 15 years and over
- Males
- 40.5%Never married
- 52.1%Now married
- 0.0%Separated
- 7.4%Widowed
- 0.0%Divorced
- Females
- 5.9%Never married
- 94.1%Now married
- 0.0%Separated
- 0.0%Widowed
- 0.0%Divorced
Women who did not give birth in the past 12 months
| Now married: | 81.5% (23) |
| Unmarried: | 18.5% (5) |
Marital status - Other race population 15 years and over
- Males
- 36.0%Never married
- 52.7%Now married
- 6.2%Separated
- 0.0%Widowed
- 5.0%Divorced
- Females
- 0.0%Never married
- 100.0%Now married
- 0.0%Separated
- 0.0%Widowed
- 0.0%Divorced
Women who did not give birth in the past 12 months
| Now married: | 100.0% (99) |
| Unmarried: | 0.0% (0) |
Marital status - Two or more races population 15 years and over
- Males
- 66.7%Never married
- 33.3%Now married
- 0.0%Separated
- 0.0%Widowed
- 0.0%Divorced
- Females
- 44.6%Never married
- 42.5%Now married
- 0.0%Separated
- 0.0%Widowed
- 12.9%Divorced
Women who did not give birth in the past 12 months
| Now married: | 40.3% (144) |
| Unmarried: | 59.7% (214) |
Marital status - White alone, not Hispanic / Latino population 15 years and over
- Males
- 27.8%Never married
- 56.5%Now married
- 0.8%Separated
- 7.5%Widowed
- 7.4%Divorced
- Females
- 15.3%Never married
- 53.6%Now married
- 1.4%Separated
- 17.7%Widowed
- 11.9%Divorced
Women who gave birth in the past 12 months
| Now married: | 100.0% (38) |
| Unmarried: | 0.0% (0) |
Women who did not give birth in the past 12 months
| Now married: | 56.6% (765) |
| Unmarried: | 43.4% (587) |
Marital status - Hispanic or Latino population 15 years and over
- Males
- 37.0%Never married
- 56.4%Now married
- 3.6%Separated
- 0.0%Widowed
- 2.9%Divorced
- Females
- 26.3%Never married
- 52.9%Now married
- 0.0%Separated
- 0.0%Widowed
- 20.8%Divorced
Women who gave birth in the past 12 months
| Now married: | 0.0% (0) |
| Unmarried: | 100.0% (13) |
Women who did not give birth in the past 12 months
| Now married: | 55.0% (140) |
| Unmarried: | 45.0% (115) |
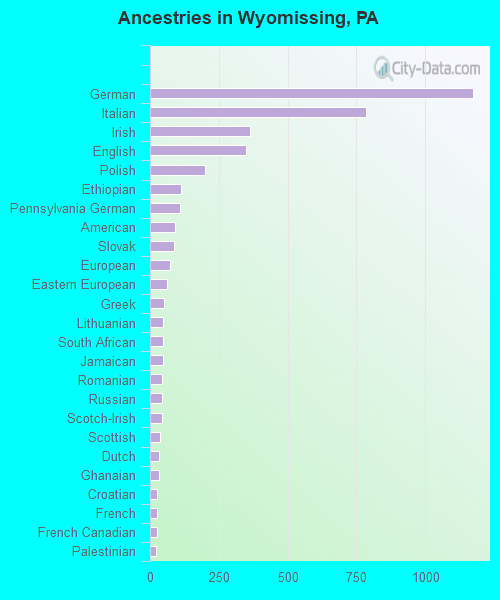
Ancestries in Wyomissing

- 1,17323.1%German
- 78315.5%Italian
- 3647.2%Irish
- 3486.9%English
- 1993.9%Polish
- 1112.2%Ethiopian
- 1082.1%Pennsylvania German
- 901.8%American
- 871.7%Slovak
- 731.4%European
- 601.2%Eastern European
- 501.0%Greek
- 491.0%Lithuanian
- 491.0%South African
- 491.0%Jamaican
- 450.9%Romanian
- 430.8%Russian
- 430.8%Scotch-Irish
- 380.7%Scottish
- 320.6%Dutch
- 310.6%Ghanaian
- 260.5%Croatian
- 250.5%French
- 240.5%French Canadian
- 220.4%Palestinian
- 210.4%Arab
- 190.4%Northern European
- 180.4%Guyanese
- 180.4%Swiss
- 160.3%Welsh
- 140.3%Austrian
- 100.2%Lebanese
- 100.2%Hungarian
- 70.1%Czech
- 70.1%Yugoslavian
- 60.1%British
- 50.10%Syrian
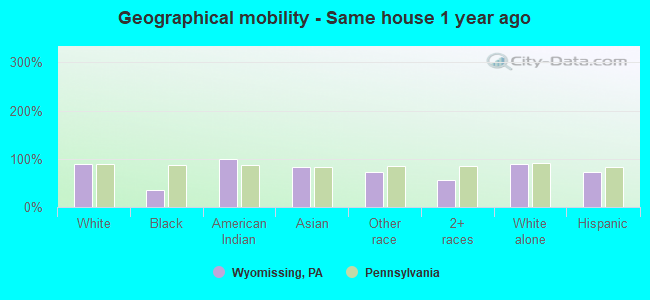
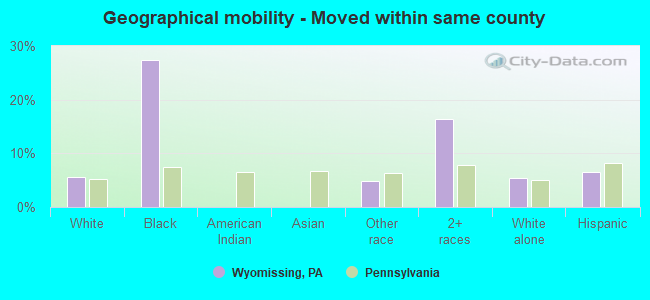
Geographical mobility in Wyomissing

- Same house 1 year ago
- 7,96190.0%White (Caucasian)
- 6335.2%Black or African American
- 2099.6%American Indian / Alaska Native
- 18883.2%Asian
- 36772.7%Other race
- 51156.1%Two or more races
- 8,07489.9%White alone, not Hispanic / Latino
- 91873.4%Hispanic or Latino
-
- Moved within same county
- 5015.7%White / Caucasian
- 4927.3%Black or African American
- 244.8%Other race
- 15016.5%Two or more races
- 4915.5%White alone, not Hispanic / Latino
- 826.6%Hispanic or Latino
-
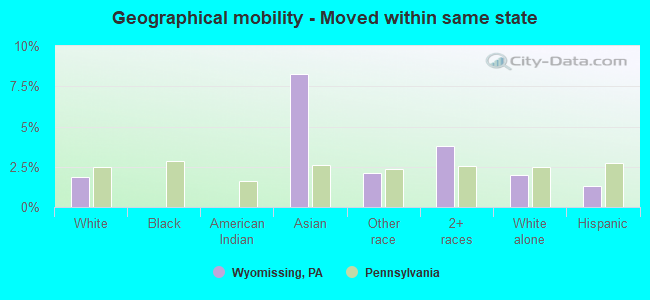
- Moved within same state
- 1651.9%White / Caucasian
- 198.2%Asian
- 112.1%Other race
- 343.8%Two or more races
- 1812.0%White alone, not Hispanic / Latino
- 161.3%Hispanic or Latino
-
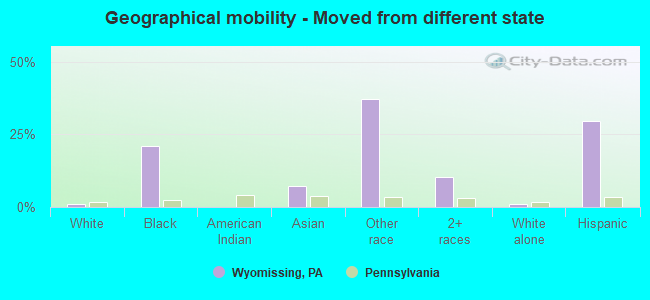
- Moved from different state
- 810.9%White / Caucasian
- 3821.0%Black or African American
- 167.2%Asian
- 18737.1%Other race
- 9610.5%Two or more races
- 901.0%White alone, not Hispanic / Latino
- 37329.8%Hispanic or Latino
-
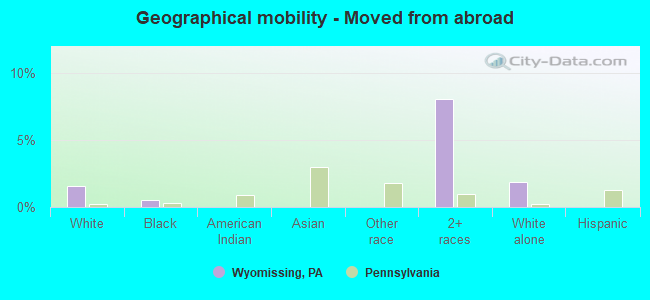
- Moved from abroad
- 1411.6%White
- 10.6%Black or African American
- 738.0%Two or more races
- 1641.8%White alone, not Hispanic / Latino
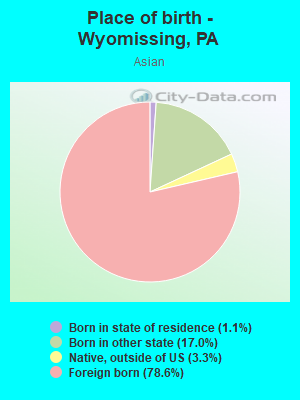
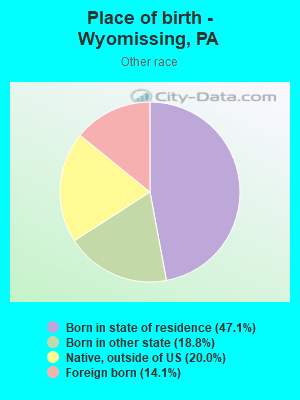
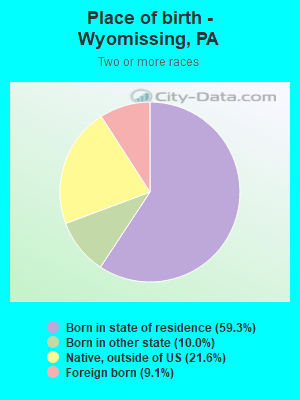
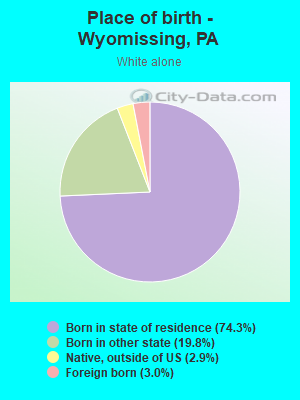
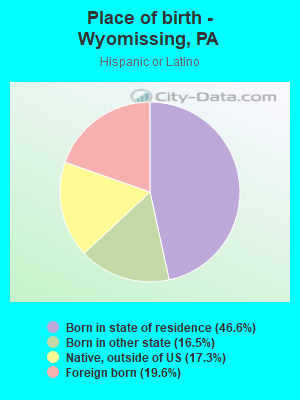
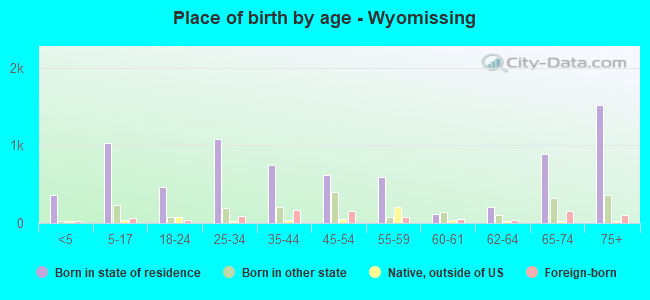
Children Nativity (place of birth) in Wyomissing
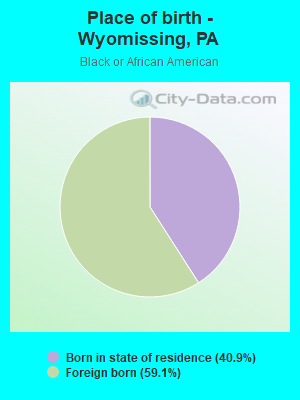
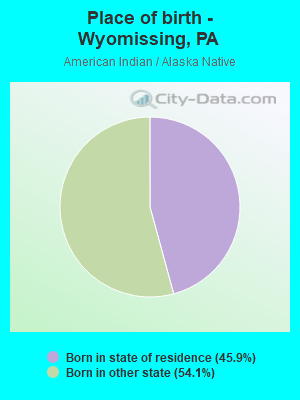
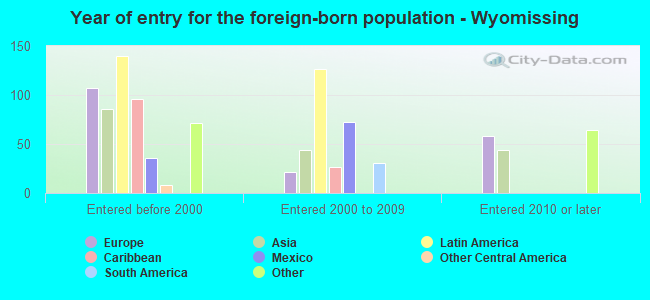
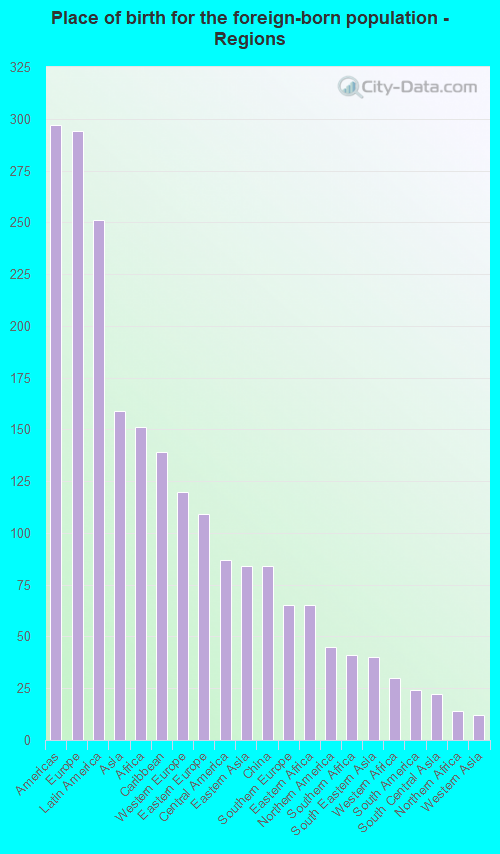
Place of birth for residents in Wyomissing
![Place of birth for the foreign-born population - Regions]()
- 297Americas
- 294Europe
- 251Latin America
- 159Asia
- 151Africa
- 139Caribbean
- 120Western Europe
- 109Eastern Europe
- 87Central America
- 84Eastern Asia
- 84China
- 65Southern Europe
- 65Eastern Africa
- 45Northern America
- 41Southern Africa
- 40South Eastern Asia
- 30Western Africa
- 24South America
- 22South Central Asia
- 14Northern Africa
- 12Western Asia
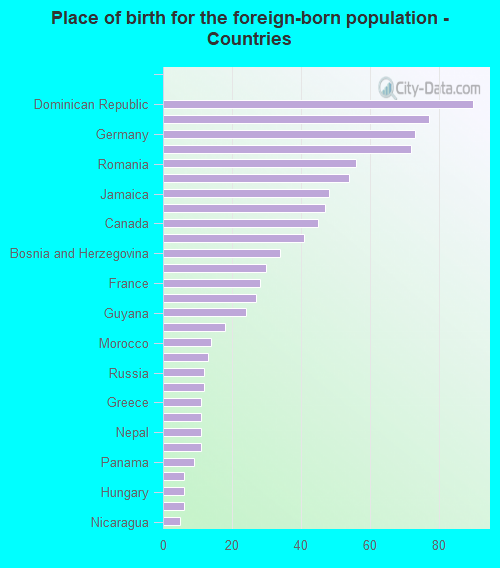
![Place of birth for the foreign-born population - Countries]()
- 90Dominican Republic
- 77China
- 73Germany
- 72Mexico
- 56Romania
- 54Ethiopia
- 48Jamaica
- 47Spain
- 45Canada
- 41South Africa
- 34Bosnia and Herzegovina
- 30Ghana
- 28France
- 27Vietnam
- 24Guyana
- 18Belgium
- 14Morocco
- 13Philippines
- 12Russia
- 12Israel
- 11Greece
- 11India
- 11Nepal
- 11Kenya
- 9Panama
- 6Italy
- 6Hungary
- 6Taiwan
- 5Nicaragua
Zip codes: 19610.