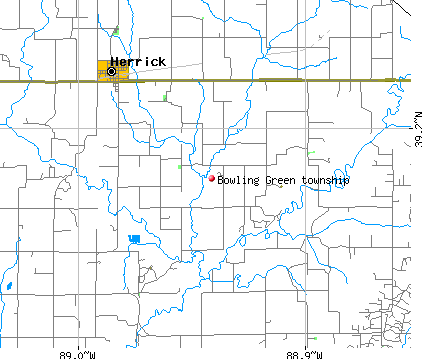
Bowling Green township, Fayette County, Illinois (IL) detailed profile
Land area: 25.5 sq. mi.
Water area: 0.0 sq. mi.
Population: 433 (all rural)
| Males: 218 | |
| Females: 215 |
Occupied houses/apartments: 433 (366 owner occupied, 67 renter occupied)
| % of renters here: | 15% |
| State: | 33% |
Races in Bowling Green township:
- White Non-Hispanic: 99.8%
Median age of males: 37.9
Median age of females: 37.1
Discuss Illinois on our huge forum. We have over 16 million posts!
Average household size: 2.56
| Bowling Green township: | 2.6 people |
| Illinois: | 2.6 people |
Average family size: 2.99
| Bowling Green township: | $45,175 |
| Illinois: | $56,210 |
| Here: | $391 |
| State: | $772 |
Estimated median house or condo value in 2013: $77,125 (it was $59,300 in 2000)
| : | $77,125 |
| Illinois: | $169,600 |
| Population density: 17 people per square mile | (low). |
| This township: | 12.3% |
| Whole state: | 10.7% |
| This township: | 3.8% |
| Whole state: | 5.1% |
Notable locations in this township outside city limits:
Notable location: Bowling Green Townhall (A). Display/hide its location on the map
Church in Bowling Green township: Oak Grove Church (A). Display/hide its location on the map
Cemeteries: Antioch Cemetery (1), Lorton Cemetery (2), Buchanan Cemetery (3), Oak Grove Cemetery (4), Beck Private Cemetery (5). Display/hide their locations on the map
Streams, rivers, and creeks: Mitchell Creek (A), Becks Creek (B), Section Creek (C), Pint Creek (D), Petty Branch (E), Fanny Branch (F). Display/hide their locations on the map
72% of Bowling Green township residents lived in the same house 5 years ago.
Out of people who lived in different houses, 58% lived in this county.
Out of people who lived in different counties, 100% lived in Illinois.
Place of birth for U.S.-born residents:
- This state: 403
- Northeast: 4
- Midwest: 23
- South: 9
- West: 7
Percentage of households with unmarried partners: 2.4%
No gay or lesbian households reported

Housing units in structures:
- One, detached: 135
- Mobile homes: 76
Median worth of mobile homes: $34,000
Housing units in Bowling Green township with a mortgage: 18 (0 second mortgage, 0 home equity loan, 0 both second mortgage and home equity loan)
Houses without a mortgage: 10
- Machinery (13%)
- Truck transportation (13%)
- Construction (10%)
- Broadcasting, internet publishing, and telecommunications services (7%)
- Plastics and rubber products (6%)
- Agriculture, forestry, fishing and hunting (5%)
- Real estate and rental and leasing (5%)
- Finance and insurance (17%)
- Educational services (17%)
- Health care (17%)
- Paper (10%)
- Nonmetallic mineral products (9%)
- Public administration (9%)
- Agriculture, forestry, fishing and hunting (7%)
- Other production occupations including supervisors (18%)
- Driver/sales workers and truck drivers (17%)
- Electrical equipment mechanics and other installation, maintenance, and repair occupations including supervisors (14%)
- Metal workers and plastic workers (6%)
- Other sales and related workers including supervisors (5%)
- Fishing and hunting, and forest and logging workers (5%)
- Laborers and material movers, hand (5%)
- Financial clerks except bookkeeping, accounting, and auditing clerks (17%)
- Other production occupations including supervisors (12%)
- Health technologists and technicians (10%)
- Drafters, engineering, and mapping technicians (9%)
- Cooks and food preparation workers (9%)
- Secretaries and administrative assistants (9%)
- Accountants and auditors (7%)
Most common first ancestries reported in Bowling Green township:
- United States or American (44.9%)
- Irish (15.8%)
- English (13.6%)
- German (13.2%)
- European (2.9%)
- French (except Basque) (2.2%)
- Scotch-Irish (1.5%)
Means of transportation to work:
- Drove a car alone: 126 (75%)
- Carpooled: 33 (20%)
- Worked at home: 10 (6%)
Most commonly used house heating fuel:
- Bottled, tank, or LP gas (59%)
- Wood (18%)
- Electricity (15%)
- Utility gas (8%)
95.0% of residents of Bowling Green township speak English at home.
1.2% of residents speak Spanish at home (100% speak English very well).
2.1% of residents speak other Indo-European language at home (100% speak English very well).
1.7% of residents speak Asian or Pacific Island language at home (100% speak English very well).
Household type by relationship:
Households: 446- In family households: 387 (112 male householders, 19 female householders)
113 spouses, 121 children (104 natural, 0 adopted, 17 stepchildren), 11 grandchildren, 0 brothers or sisters, 4 parents, 3 other relatives, 4 non-relatives
- In nonfamily households: 59 (38 male householders (38 living alone)), 21 female householders (21 living alone)), 0 nonrelatives
Size of family households: 55 2-persons, 33 3-persons, 28 4-persons, 15 5-persons,
Size of nonfamily households: 59 1-person,
99 married couples with children.
15 single-parent households (2 men, 13 women).
Private vs. public school enrollment:
Students in private schools in grades 1 to 8 (elementary and middle school): 0
| Here: | 0.0% |
| Illinois: | 13.4% |
Students in private schools in grades 9 to 12 (high school): 3
| Here: | 6.7% |
| Illinois: | 11.1% |