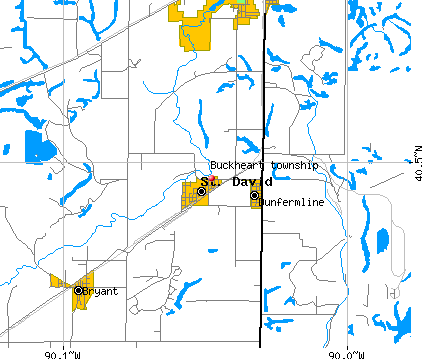
Buckheart township, Fulton County, Illinois (IL) detailed profile
Number of foreign born residents: 0 (100% naturalized citizens)
| Buckheart township: | 0.3% |
| Whole state: | 12.3% |
66% of Buckheart township residents lived in the same house 5 years ago.
Out of people who lived in different houses, 78% lived in this county.
Out of people who lived in different counties, 62% lived in Illinois.
Place of birth for U.S.-born residents:
- This state: 1392
- Northeast: 3
- Midwest: 40
- South: 44
- West: 42
Median price asked for vacant for-sale houses in 2000: $43,000
Percentage of households with unmarried partners: 5.4%
Likely homosexual households (counted as self-reported same-sex unmarried-partner households)
- Lesbian couples: 0.2% of all households
- Gay men: 0.0% of all households
Housing units in structures:
- One, detached: 628
- One, attached: 3
- Two: 3
- 3 or 4: 4
- 5 to 9: 4
- Mobile homes: 181
Median worth of mobile homes: $22,500
Housing units in Buckheart township with a mortgage: 216 (8 second mortgage, 28 home equity loan, 0 both second mortgage and home equity loan)
Houses without a mortgage: 203
- Construction (11%)
- Machinery (11%)
- Metal and metal products (8%)
- Truck transportation (7%)
- Agriculture, forestry, fishing and hunting (6%)
- Administrative and support and waste management services (5%)
- Motor vehicle and parts dealers (5%)
- Health care (26%)
- Accommodation and food services (8%)
- Personal and laundry services (8%)
- Educational services (7%)
- Public administration (6%)
- Social assistance (6%)
- Department and other general merchandise stores (6%)
- Metal workers and plastic workers (10%)
- Driver/sales workers and truck drivers (8%)
- Other production occupations including supervisors (8%)
- Farmers and farm managers (7%)
- Vehicle and mobile equipment mechanics, installers, and repairers (6%)
- Retail sales workers except cashiers (5%)
- Electrical equipment mechanics and other installation, maintenance, and repair occupations including supervisors (5%)
- Secretaries and administrative assistants (8%)
- Personal appearance workers (8%)
- Health technologists and technicians (7%)
- Registered nurses (6%)
- Other sales and related workers including supervisors (5%)
- Information and record clerks except customer service representatives (5%)
- Other healthcare support occupations (4%)
Most common first ancestries reported in Buckheart township:
- United States or American (25.6%)
- German (14.6%)
- English (12.4%)
- Irish (12.2%)
- Croatian (6.8%)
- Italian (5.9%)
- Scotch-Irish (2.7%)
Most common places of birth for the foreign-born residents:
- Canada (75%)
Means of transportation to work:
- Drove a car alone: 576 (81%)
- Carpooled: 85 (12%)
- Motorcycle: 2 (0%)
- Walked: 4 (1%)
- Other means: 9 (1%)
- Worked at home: 33 (5%)
Most commonly used house heating fuel:
- Utility gas (78%)
- Bottled, tank, or LP gas (11%)
- Electricity (10%)
99.2% of residents of Buckheart township speak English at home.
0.1% of residents speak Spanish at home (100% speak English very well).
0.6% of residents speak other Indo-European language at home (88% speak English very well, 13% speak English well).
0.1% of residents speak Asian or Pacific Island language at home (100% speak English very well).
0.1% of residents speak other language at home (100% speak English very well).
Household type by relationship:
Households: 1,529- In family households: 1,301 (358 male householders, 85 female householders)
344 spouses, 452 children (398 natural, 2 adopted, 52 stepchildren), 33 grandchildren, 2 brothers or sisters, 3 parents, 10 other relatives, 14 non-relatives
- In nonfamily households: 228 (70 male householders (50 living alone)), 101 female householders (82 living alone)), 57 nonrelatives
Size of family households: 215 2-persons, 120 3-persons, 70 4-persons, 12 5-persons, 16 6-persons, 10 7-or-more-persons,
Size of nonfamily households: 132 1-person, 34 2-persons, 2 3-persons, 2 4-persons, 1 6-persons,
229 married couples with children.
81 single-parent households (17 men, 64 women).
Private vs. public school enrollment:
Students in private schools in grades 1 to 8 (elementary and middle school): 0
| Here: | 0.0% |
| Illinois: | 13.4% |
Students in private schools in grades 9 to 12 (high school): 0
| Here: | 0.0% |
| Illinois: | 11.1% |
Students in private undergraduate colleges: 2
| Here: | 3.2% |
| Illinois: | 25.8% |