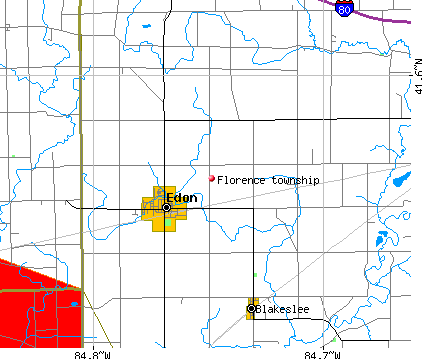
Florence township, Williams County, Ohio (OH) detailed profile
Number of foreign born residents: 0 (100% naturalized citizens)
| Florence township: | 0.1% |
| Whole state: | 3.0% |
68% of Florence township residents lived in the same house 5 years ago.
Out of people who lived in different houses, 66% lived in this county.
Out of people who lived in different counties, 47% lived in Ohio.
Place of birth for U.S.-born residents:
- This state: 1518
- Northeast: 25
- Midwest: 468
- South: 56
- West: 21
Median price asked for vacant for-sale houses in 2000: $39,200
Percentage of households with unmarried partners: 3.2%
Likely homosexual households (counted as self-reported same-sex unmarried-partner households)
- Lesbian couples: 0.3% of all households
- Gay men: 0.0% of all households

Housing units in structures:
- One, detached: 747
- Two: 29
- 3 or 4: 7
- 5 to 9: 2
- Mobile homes: 43
Median worth of mobile homes: $21,300
Housing units in Florence township with a mortgage: 311 (23 second mortgage, 28 home equity loan, 0 both second mortgage and home equity loan)
Houses without a mortgage: 178
- Transportation equipment (21%)
- Construction (12%)
- Plastics and rubber products (10%)
- Machinery (8%)
- Metal and metal products (6%)
- Miscellaneous manufacturing (5%)
- Truck transportation (5%)
- Accommodation and food services (10%)
- Health care (10%)
- Plastics and rubber products (9%)
- Metal and metal products (9%)
- Educational services (5%)
- Transportation equipment (5%)
- Finance and insurance (5%)
- Metal workers and plastic workers (20%)
- Driver/sales workers and truck drivers (8%)
- Other production occupations including supervisors (7%)
- Other management occupations except farmers and farm managers (6%)
- Assemblers and fabricators (5%)
- Construction laborers (4%)
- Electrical equipment mechanics and other installation, maintenance, and repair occupations including supervisors (4%)
- Metal workers and plastic workers (9%)
- Cashiers (7%)
- Other production occupations including supervisors (6%)
- Cooks and food preparation workers (6%)
- Other office and administrative support workers including supervisors (6%)
- Other management occupations except farmers and farm managers (5%)
- Health technologists and technicians (5%)
Most common first ancestries reported in Florence township:
- German (59.6%)
- United States or American (14.6%)
- English (5.5%)
- Irish (5.4%)
- Syrian (2.1%)
- Dutch (1.8%)
- French Canadian (1.3%)
Most common places of birth for the foreign-born residents:
- Other Western Asia (100%)
Means of transportation to work:
- Drove a car alone: 881 (84%)
- Carpooled: 109 (10%)
- Motorcycle: 1 (0%)
- Bicycle: 2 (0%)
- Walked: 18 (2%)
- Worked at home: 41 (4%)
Most commonly used house heating fuel:
- Utility gas (31%)
- Bottled, tank, or LP gas (28%)
- Fuel oil, kerosene, etc. (18%)
- Electricity (13%)
- Wood (7%)
- Other fuel (3%)
97.6% of residents of Florence township speak English at home.
1.0% of residents speak Spanish at home (90% speak English very well, 10% speak English well).
1.2% of residents speak other Indo-European language at home (100% speak English very well).
0.1% of residents speak other language at home (100% speak English very well).
Household type by relationship:
Households: 2,095- In family households: 1,896 (508 male householders, 79 female householders)
510 spouses, 704 children (609 natural, 30 adopted, 65 stepchildren), 22 grandchildren, 13 brothers or sisters, 4 parents, 29 other relatives, 27 non-relatives
- In nonfamily households: 199 (98 male householders (74 living alone)), 75 female householders (67 living alone)), 26 nonrelatives
Size of family households: 241 2-persons, 124 3-persons, 120 4-persons, 76 5-persons, 20 6-persons, 6 7-or-more-persons,
Size of nonfamily households: 141 1-person, 32 2-persons,
509 married couples with children.
86 single-parent households (18 men, 68 women).
Private vs. public school enrollment:
Students in private schools in grades 1 to 8 (elementary and middle school): 46
| Here: | 15.8% |
| Ohio: | 14.2% |
Students in private schools in grades 9 to 12 (high school): 6
| Here: | 3.7% |
| Ohio: | 10.9% |
Students in private undergraduate colleges: 0
| Here: | 0.0% |
| Ohio: | 23.4% |