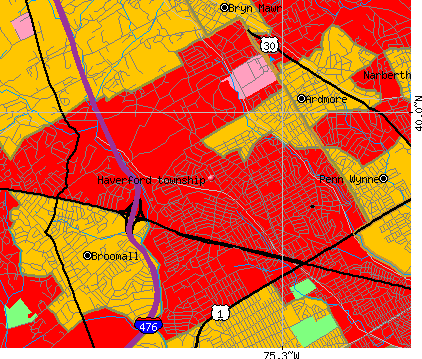
Haverford township, Delaware County, Pennsylvania (PA) detailed profile
Number of foreign born residents: 6 (64% naturalized citizens)
| Haverford township: | 6.3% |
| Whole state: | 4.1% |
71% of Haverford township residents lived in the same house 5 years ago.
Out of people who lived in different houses, 50% lived in this county.
Out of people who lived in different counties, 66% lived in Pennsylvania.
Place of birth for U.S.-born residents:
- This state: 37611
- Northeast: 3693
- Midwest: 1295
- South: 1826
- West: 720
Median price asked for vacant for-sale houses in 2000: $169,400
Percentage of households with unmarried partners: 2.3%
Likely homosexual households (counted as self-reported same-sex unmarried-partner households)
- Lesbian couples: 0.3% of all households
- Gay men: 0.1% of all households
People in group quarters in Haverford township, Pennsylvania:
- 432 people in nursing homes
- 50 people in other group homes
- 45 people in religious group quarters
- 30 people in homes for the mentally retarded
- 8 people in other nonhousehold living situations

Housing units in structures:
- One, detached: 12,649
- One, attached: 3,384
- Two: 362
- 3 or 4: 370
- 5 to 9: 319
- 10 to 19: 280
- 20 to 49: 606
- 50 or more: 403
- Mobile homes: 5
Median worth of mobile homes: $137,500
Housing units in Haverford township with a mortgage: 9,563 (722 second mortgage, 1,666 home equity loan, 38 both second mortgage and home equity loan)
Houses without a mortgage: 5,038
- Professional, scientific, and technical services (13%)
- Educational services (10%)
- Construction (10%)
- Finance and insurance (7%)
- Health care (6%)
- Accommodation and food services (4%)
- Public administration (4%)
- Health care (23%)
- Educational services (19%)
- Professional, scientific, and technical services (8%)
- Finance and insurance (7%)
- Accommodation and food services (4%)
- Social assistance (3%)
- Administrative and support and waste management services (3%)
- Other management occupations except farmers and farm managers (7%)
- Sales representatives, services, wholesale and manufacturing (6%)
- Other sales and related workers including supervisors (5%)
- Computer specialists (4%)
- Business operations specialists (3%)
- Retail sales workers except cashiers (3%)
- Accountants and auditors (3%)
- Secretaries and administrative assistants (8%)
- Registered nurses (8%)
- Preschool, kindergarten, elementary and middle school teachers (6%)
- Other office and administrative support workers including supervisors (6%)
- Other management occupations except farmers and farm managers (5%)
- Information and record clerks except customer service representatives (4%)
- Other sales and related workers including supervisors (4%)
Most common first ancestries reported in Haverford township:
- Irish (30.6%)
- Italian (22.0%)
- German (9.4%)
- English (6.1%)
- United States or American (3.1%)
- Russian (2.9%)
- Polish (2.2%)
Most common places of birth for the foreign-born residents:
- Italy (14%)
- Korea (11%)
- Ireland (11%)
- United Kingdom (7%)
- India (7%)
- China, excluding Hong Kong and Taiwan (6%)
- Germany (4%)
Means of transportation to work:
- Drove a car alone: 19,079 (80%)
- Carpooled: 1,846 (8%)
- Bus or trolley bus: 241 (1%)
- Streetcar or trolley car: 60 (0%)
- Subway or elevated: 726 (3%)
- Railroad: 436 (2%)
- Taxi: 36 (0%)
- Motorcycle: 12 (0%)
- Bicycle: 50 (0%)
- Walked: 648 (3%)
- Other means: 15 (0%)
- Worked at home: 782 (3%)
Most commonly used house heating fuel:
- Utility gas (66%)
- Fuel oil, kerosene, etc. (24%)
- Electricity (9%)
- Bottled, tank, or LP gas (1%)
People in group quarters in Haverford township, Pennsylvania:
- 432 people in nursing homes
- 50 people in other group homes
- 45 people in religious group quarters
- 30 people in homes for the mentally retarded
- 8 people in other nonhousehold living situations
91.2% of residents of Haverford township speak English at home.
1.3% of residents speak Spanish at home (67% speak English very well, 16% speak English well, 17% speak English not well, 1% don't speak English at all).
4.7% of residents speak other Indo-European language at home (68% speak English very well, 20% speak English well, 10% speak English not well, 1% don't speak English at all).
2.2% of residents speak Asian or Pacific Island language at home (44% speak English very well, 26% speak English well, 26% speak English not well, 4% don't speak English at all).
0.6% of residents speak other language at home (60% speak English very well, 29% speak English well, 11% speak English not well).
Household type by relationship:
Households: 47,938- In family households: 42,094 (10,410 male householders, 2,745 female householders)
11,154 spouses, 15,692 children (15,104 natural, 289 adopted, 299 stepchildren), 442 grandchildren, 389 brothers or sisters, 338 parents, 489 other relatives, 435 non-relatives
- In nonfamily households: 5,844 (1,739 male householders (1,386 living alone)), 3,175 female householders (2,815 living alone)), 930 nonrelatives
- In group quarters: 560 (381 institutionalized population)
Size of family households: 5,170 2-persons, 2,965 3-persons, 3,013 4-persons, 1,349 5-persons, 559 6-persons, 99 7-or-more-persons,
Size of nonfamily households: 4,201 1-person, 567 2-persons, 100 3-persons, 38 4-persons, 4 5-persons, 4 6-persons,
10,424 married couples with children.
1,133 single-parent households (198 men, 935 women).
Private vs. public school enrollment:
Students in private schools in grades 1 to 8 (elementary and middle school): 2,021
| Here: | 35.7% |
| Pennsylvania: | 16.0% |
Students in private schools in grades 9 to 12 (high school): 889
| Here: | 32.4% |
| Pennsylvania: | 13.1% |
Students in private undergraduate colleges: 1,347
| Here: | 60.5% |
| Pennsylvania: | 37.3% |