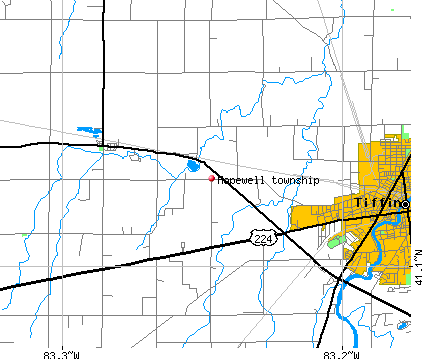
Hopewell township, Seneca County, Ohio (OH) detailed profile
Number of foreign born residents: 1 (55% naturalized citizens)
| Hopewell township: | 1.0% |
| Whole state: | 3.0% |
75% of Hopewell township residents lived in the same house 5 years ago.
Out of people who lived in different houses, 71% lived in this county.
Out of people who lived in different counties, 78% lived in Ohio.
Place of birth for U.S.-born residents:
- This state: 2596
- Northeast: 55
- Midwest: 56
- South: 108
- West: 15
Median price asked for vacant for-sale houses in 2000: $132,500
Percentage of households with unmarried partners: 4.7%
Likely homosexual households (counted as self-reported same-sex unmarried-partner households)
- Lesbian couples: 0.0% of all households
- Gay men: 0.2% of all households
2 people in homes for the mentally ill

Housing units in structures:
- One, detached: 937
- One, attached: 6
- Two: 7
- 5 to 9: 8
- 10 to 19: 8
- Mobile homes: 160
Median worth of mobile homes: $18,800
Housing units in Hopewell township with a mortgage: 381 (5 second mortgage, 97 home equity loan, 0 both second mortgage and home equity loan)
Houses without a mortgage: 262
- Educational services (9%)
- Metal and metal products (9%)
- Construction (8%)
- Public administration (7%)
- Transportation equipment (7%)
- Machinery (6%)
- Utilities (5%)
- Educational services (18%)
- Health care (17%)
- Public administration (5%)
- Administrative and support and waste management services (5%)
- Personal and laundry services (4%)
- Accommodation and food services (4%)
- Finance and insurance (4%)
- Other production occupations including supervisors (7%)
- Electrical equipment mechanics and other installation, maintenance, and repair occupations including supervisors (6%)
- Building and grounds cleaning and maintenance occupations (6%)
- Metal workers and plastic workers (5%)
- Law enforcement workers including supervisors (5%)
- Top executives (4%)
- Engineers (4%)
- Secretaries and administrative assistants (12%)
- Other office and administrative support workers including supervisors (6%)
- Preschool, kindergarten, elementary and middle school teachers (5%)
- Registered nurses (5%)
- Material recording, scheduling, dispatching, and distributing workers (5%)
- Bookkeeping, accounting, and auditing clerks (5%)
- Building and grounds cleaning and maintenance occupations (5%)
Most common first ancestries reported in Hopewell township:
- German (52.3%)
- United States or American (17.0%)
- English (5.8%)
- Irish (5.2%)
- Italian (2.4%)
- French (except Basque) (2.0%)
- Swiss (2.0%)
Most common places of birth for the foreign-born residents:
- India (41%)
- Japan (24%)
- Other Caribbean (17%)
- Guyana (17%)
Means of transportation to work:
- Drove a car alone: 1,133 (80%)
- Carpooled: 154 (11%)
- Taxi: 13 (1%)
- Bicycle: 9 (1%)
- Walked: 29 (2%)
- Worked at home: 78 (6%)
Most commonly used house heating fuel:
- Utility gas (32%)
- Bottled, tank, or LP gas (28%)
- Electricity (23%)
- Fuel oil, kerosene, etc. (9%)
- Wood (7%)
- Coal or coke (1%)
- No fuel used (1%)
2 people in homes for the mentally ill
97.5% of residents of Hopewell township speak English at home.
0.7% of residents speak Spanish at home (53% speak English very well, 47% speak English well).
1.4% of residents speak other Indo-European language at home (100% speak English very well).
0.4% of residents speak Asian or Pacific Island language at home (42% speak English very well, 58% speak English well).
Household type by relationship:
Households: 2,881- In family households: 2,556 (732 male householders, 90 female householders)
682 spouses, 921 children (830 natural, 21 adopted, 70 stepchildren), 29 grandchildren, 31 brothers or sisters, 19 parents, 22 other relatives, 30 non-relatives
- In nonfamily households: 325 (143 male householders (107 living alone)), 132 female householders (116 living alone)), 50 nonrelatives
Size of family households: 330 2-persons, 210 3-persons, 146 4-persons, 98 5-persons, 27 6-persons, 11 7-or-more-persons,
Size of nonfamily households: 223 1-person, 47 2-persons, 5 3-persons,
614 married couples with children.
106 single-parent households (32 men, 74 women).
Private vs. public school enrollment:
Students in private schools in grades 1 to 8 (elementary and middle school): 29
| Here: | 8.3% |
| Ohio: | 14.2% |
Students in private schools in grades 9 to 12 (high school): 4
| Here: | 2.4% |
| Ohio: | 10.9% |
Students in private undergraduate colleges: 31
| Here: | 38.8% |
| Ohio: | 23.4% |