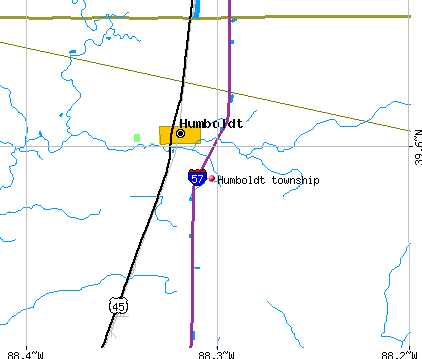
Humboldt township, Coles County, Illinois (IL) detailed profile
Number of foreign born residents: 2 (29% naturalized citizens)
| Humboldt township: | 2.1% |
| Whole state: | 12.3% |
61% of Humboldt township residents lived in the same house 5 years ago.
Out of people who lived in different houses, 64% lived in this county.
Out of people who lived in different counties, 60% lived in Illinois.
Place of birth for U.S.-born residents:
- This state: 1174
- Northeast: 14
- Midwest: 72
- South: 78
- West: 24
Median price asked for vacant for-sale houses in 2000: $13,900
Percentage of households with unmarried partners: 4.4%
Likely homosexual households (counted as self-reported same-sex unmarried-partner households)
- Lesbian couples: 0.0% of all households
- Gay men: 0.2% of all households
Housing units in structures:
- One, detached: 449
- One, attached: 7
- 3 or 4: 4
- 5 to 9: 24
- 10 to 19: 3
- Mobile homes: 48
Median worth of mobile homes: $16,900
Housing units in Humboldt township with a mortgage: 224 (25 second mortgage, 21 home equity loan, 0 both second mortgage and home equity loan)
Houses without a mortgage: 95
- Printing and related support activities (13%)
- Construction (11%)
- Agriculture, forestry, fishing and hunting (8%)
- Department and other general merchandise stores (6%)
- Accommodation and food services (5%)
- Finance and insurance (5%)
- Furniture and related product manufacturing (4%)
- Health care (24%)
- Finance and insurance (13%)
- Accommodation and food services (6%)
- Paper (5%)
- Gasoline stations (4%)
- Educational services (4%)
- Electrical equipment, appliances, and components (4%)
- Laborers and material movers, hand (13%)
- Farmers and farm managers (8%)
- Material recording, scheduling, dispatching, and distributing workers (7%)
- Other production occupations including supervisors (7%)
- Driver/sales workers and truck drivers (7%)
- Material moving workers except supervisors and laborers and material movers, hand (6%)
- Electrical equipment mechanics and other installation, maintenance, and repair occupations including supervisors (5%)
- Other management occupations except farmers and farm managers (9%)
- Assemblers and fabricators (8%)
- Information and record clerks except customer service representatives (6%)
- Registered nurses (6%)
- Other production occupations including supervisors (6%)
- Other office and administrative support workers including supervisors (5%)
- Laborers and material movers, hand (5%)
Most common first ancestries reported in Humboldt township:
- United States or American (32.9%)
- German (21.7%)
- English (14.4%)
- Irish (10.5%)
- French (except Basque) (3.8%)
- Italian (2.8%)
- Canadian (1.4%)
Most common places of birth for the foreign-born residents:
- Colombia (43%)
- Mexico (36%)
- Guatemala (21%)
Means of transportation to work:
- Drove a car alone: 544 (76%)
- Carpooled: 133 (19%)
- Walked: 2 (0%)
- Other means: 20 (3%)
- Worked at home: 18 (3%)
Most commonly used house heating fuel:
- Utility gas (60%)
- Bottled, tank, or LP gas (20%)
- Electricity (16%)
- Fuel oil, kerosene, etc. (2%)
- Other fuel (2%)
95.5% of residents of Humboldt township speak English at home.
4.1% of residents speak Spanish at home (60% speak English very well, 37% speak English well, 4% don't speak English at all).
0.5% of residents speak other Indo-European language at home (100% speak English very well).
Household type by relationship:
Households: 1,403- In family households: 1,260 (311 male householders, 60 female householders)
325 spouses, 510 children (408 natural, 36 adopted, 66 stepchildren), 19 grandchildren, 2 brothers or sisters, 2 parents, 8 other relatives, 23 non-relatives
- In nonfamily households: 143 (31 male householders (18 living alone)), 71 female householders (61 living alone)), 41 nonrelatives
Size of family households: 142 2-persons, 64 3-persons, 83 4-persons, 50 5-persons, 24 6-persons, 8 7-or-more-persons,
Size of nonfamily households: 79 1-person, 19 2-persons, 3 3-persons, 1 5-persons,
297 married couples with children.
52 single-parent households (15 men, 37 women).
Private vs. public school enrollment:
Students in private schools in grades 1 to 8 (elementary and middle school): 0
| Here: | 0.0% |
| Illinois: | 13.4% |
Students in private schools in grades 9 to 12 (high school): 0
| Here: | 0.0% |
| Illinois: | 11.1% |
Students in private undergraduate colleges: 3
| Here: | 11.1% |
| Illinois: | 25.8% |