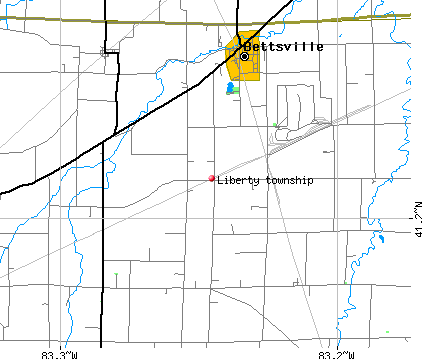
Liberty township, Seneca County, Ohio (OH) detailed profile
Number of foreign born residents: 1 (83% naturalized citizens)
| Liberty township: | 1.2% |
| Whole state: | 3.0% |
64% of Liberty township residents lived in the same house 5 years ago.
Out of people who lived in different houses, 68% lived in this county.
Out of people who lived in different counties, 83% lived in Ohio.
Place of birth for U.S.-born residents:
- This state: 2134
- Northeast: 22
- Midwest: 47
- South: 168
- West: 15
Median price asked for vacant for-sale houses in 2000: $77,500
Percentage of households with unmarried partners: 5.6%
Likely homosexual households (counted as self-reported same-sex unmarried-partner households)
- Lesbian couples: 0.4% of all households
- Gay men: 0.0% of all households
Housing units in structures:
- One, detached: 804
- One, attached: 5
- Two: 14
- 3 or 4: 17
- 5 to 9: 2
- Mobile homes: 85
Median worth of mobile homes: $17,500
Housing units in Liberty township with a mortgage: 414 (38 second mortgage, 65 home equity loan, 0 both second mortgage and home equity loan)
Houses without a mortgage: 172
- Construction (9%)
- Agriculture, forestry, fishing and hunting (9%)
- Electrical equipment, appliances, and components (8%)
- Transportation equipment (8%)
- Metal and metal products (8%)
- Plastics and rubber products (7%)
- Nonmetallic mineral products (6%)
- Health care (19%)
- Educational services (11%)
- Finance and insurance (9%)
- Plastics and rubber products (6%)
- Food and beverage stores (5%)
- Electrical equipment, appliances, and components (5%)
- Transportation equipment (4%)
- Other production occupations including supervisors (13%)
- Electrical equipment mechanics and other installation, maintenance, and repair occupations including supervisors (9%)
- Metal workers and plastic workers (8%)
- Laborers and material movers, hand (8%)
- Driver/sales workers and truck drivers (7%)
- Other management occupations except farmers and farm managers (4%)
- Assemblers and fabricators (4%)
- Health technologists and technicians (6%)
- Assemblers and fabricators (6%)
- Other office and administrative support workers including supervisors (5%)
- Other production occupations including supervisors (4%)
- Secretaries and administrative assistants (4%)
- Building and grounds cleaning and maintenance occupations (4%)
- Information and record clerks except customer service representatives (4%)
Most common first ancestries reported in Liberty township:
- German (58.3%)
- United States or American (13.6%)
- Irish (5.7%)
- English (5.3%)
- Italian (1.7%)
- Dutch (1.0%)
- French Canadian (1.0%)
Most common places of birth for the foreign-born residents:
- Canada (52%)
- Germany (21%)
- Vietnam (17%)
- United Kingdom (10%)
Means of transportation to work:
- Drove a car alone: 1,019 (87%)
- Carpooled: 84 (7%)
- Bus or trolley bus: 7 (1%)
- Walked: 29 (2%)
- Other means: 4 (0%)
- Worked at home: 31 (3%)
Most commonly used house heating fuel:
- Utility gas (33%)
- Bottled, tank, or LP gas (32%)
- Electricity (22%)
- Fuel oil, kerosene, etc. (10%)
- Wood (3%)
95.5% of residents of Liberty township speak English at home.
3.3% of residents speak Spanish at home (87% speak English very well, 5% speak English well, 8% speak English not well).
0.8% of residents speak other Indo-European language at home (84% speak English very well, 5% speak English well, 11% speak English not well).
0.4% of residents speak Asian or Pacific Island language at home (100% speak English very well).
Household type by relationship:
Households: 2,435- In family households: 2,186 (610 male householders, 96 female householders)
564 spouses, 825 children (748 natural, 21 adopted, 56 stepchildren), 37 grandchildren, 7 brothers or sisters, 2 parents, 11 other relatives, 34 non-relatives
- In nonfamily households: 249 (105 male householders (71 living alone)), 90 female householders (86 living alone)), 54 nonrelatives
Size of family households: 297 2-persons, 174 3-persons, 128 4-persons, 62 5-persons, 38 6-persons, 7 7-or-more-persons,
Size of nonfamily households: 157 1-person, 31 2-persons, 2 3-persons, 5 5-persons,
493 married couples with children.
120 single-parent households (46 men, 74 women).
Private vs. public school enrollment:
Students in private schools in grades 1 to 8 (elementary and middle school): 4
| Here: | 1.1% |
| Ohio: | 14.2% |
Students in private schools in grades 9 to 12 (high school): 10
| Here: | 5.5% |
| Ohio: | 10.9% |
Students in private undergraduate colleges: 7
| Here: | 9.9% |
| Ohio: | 23.4% |