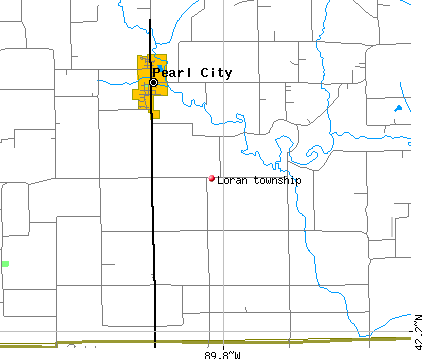
Loran township, Stephenson County, Illinois (IL) detailed profile
Number of foreign born residents: 1 (57% naturalized citizens)
| Loran township: | 0.5% |
| Whole state: | 12.3% |
68% of Loran township residents lived in the same house 5 years ago.
Out of people who lived in different houses, 65% lived in this county.
Out of people who lived in different counties, 79% lived in Illinois.
Place of birth for U.S.-born residents:
- This state: 1106
- Northeast: 2
- Midwest: 206
- South: 23
- West: 12
Median price asked for vacant for-sale houses in 2000: $65,800
Percentage of households with unmarried partners: 4.3%
Likely homosexual households (counted as self-reported same-sex unmarried-partner households)
- Lesbian couples: 0.2% of all households
- Gay men: 0.0% of all households
Housing units in structures:
- One, detached: 482
- One, attached: 2
- Two: 20
- 3 or 4: 10
- 5 to 9: 26
- 20 to 49: 3
- Mobile homes: 14
Median worth of mobile homes: $10,800
Housing units in Loran township with a mortgage: 190 (29 second mortgage, 11 home equity loan, 0 both second mortgage and home equity loan)
Houses without a mortgage: 126
- Agriculture, forestry, fishing and hunting (21%)
- Construction (17%)
- Plastics and rubber products (6%)
- Educational services (5%)
- Metal and metal products (4%)
- Repair and maintenance (4%)
- Electrical equipment, appliances, and components (3%)
- Educational services (19%)
- Health care (17%)
- Finance and insurance (11%)
- Social assistance (7%)
- Accommodation and food services (6%)
- Electrical equipment, appliances, and components (4%)
- Food and beverage stores (3%)
- Farmers and farm managers (12%)
- Agricultural workers including supervisors (8%)
- Other production occupations including supervisors (8%)
- Carpenters (5%)
- Other sales and related workers including supervisors (5%)
- Vehicle and mobile equipment mechanics, installers, and repairers (4%)
- Electrical equipment mechanics and other installation, maintenance, and repair occupations including supervisors (4%)
- Preschool, kindergarten, elementary and middle school teachers (10%)
- Secretaries and administrative assistants (5%)
- Registered nurses (5%)
- Material recording, scheduling, dispatching, and distributing workers (4%)
- Other management occupations except farmers and farm managers (4%)
- Other office and administrative support workers including supervisors (4%)
- Information and record clerks except customer service representatives (4%)
Most common first ancestries reported in Loran township:
- German (67.8%)
- Irish (6.7%)
- United States or American (5.0%)
- English (4.1%)
- Norwegian (3.7%)
- Dutch (2.3%)
- Polish (1.7%)
Most common places of birth for the foreign-born residents:
- Canada (71%)
Means of transportation to work:
- Drove a car alone: 587 (80%)
- Carpooled: 50 (7%)
- Walked: 22 (3%)
- Other means: 11 (1%)
- Worked at home: 65 (9%)
Most commonly used house heating fuel:
- Utility gas (51%)
- Bottled, tank, or LP gas (28%)
- Electricity (16%)
- Fuel oil, kerosene, etc. (5%)
97.4% of residents of Loran township speak English at home.
1.4% of residents speak Spanish at home (72% speak English very well, 28% speak English not well).
1.0% of residents speak other Indo-European language at home (77% speak English very well, 23% speak English well).
0.2% of residents speak Asian or Pacific Island language at home (100% speak English very well).
Household type by relationship:
Households: 1,360- In family households: 1,251 (346 male householders, 46 female householders)
349 spouses, 456 children (429 natural, 4 adopted, 23 stepchildren), 5 grandchildren, 0 brothers or sisters, 7 parents, 13 other relatives, 29 non-relatives
- In nonfamily households: 109 (35 male householders (28 living alone)), 61 female householders (58 living alone)), 13 nonrelatives
Size of family households: 160 2-persons, 104 3-persons, 88 4-persons, 31 5-persons, 4 6-persons, 5 7-or-more-persons,
Size of nonfamily households: 86 1-person, 7 2-persons, 3 3-persons,
309 married couples with children.
71 single-parent households (23 men, 48 women).
Private vs. public school enrollment:
Students in private schools in grades 1 to 8 (elementary and middle school): 9
| Here: | 5.8% |
| Illinois: | 13.4% |
Students in private schools in grades 9 to 12 (high school): 2
| Here: | 2.0% |
| Illinois: | 11.1% |
Students in private undergraduate colleges: 12
| Here: | 16.2% |
| Illinois: | 25.8% |