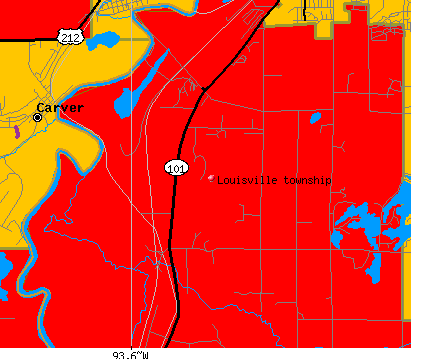
Louisville township, Scott County, Minnesota (MN) detailed profile
Number of foreign born residents: 8 (19% naturalized citizens)
| Louisville township: | 7.7% |
| Whole state: | 5.3% |
59% of Louisville township residents lived in the same house 5 years ago.
Out of people who lived in different houses, 48% lived in this county.
Out of people who lived in different counties, 72% lived in Minnesota.
Place of birth for U.S.-born residents:
- This state: 958
- Northeast: 14
- Midwest: 110
- South: 43
- West: 15
Percentage of households with unmarried partners: 3.7%
Likely homosexual households (counted as self-reported same-sex unmarried-partner households)
- Lesbian couples: 0.5% of all households
- Gay men: 0.0% of all households

Housing units in structures:
- One, detached: 347
- One, attached: 3
- Two: 2
- 3 or 4: 4
- Mobile homes: 32
Median worth of mobile homes: $9,999
Housing units in Louisville township with a mortgage: 235 (31 second mortgage, 57 home equity loan, 0 both second mortgage and home equity loan)
Houses without a mortgage: 33
- Construction (14%)
- Professional, scientific, and technical services (7%)
- Repair and maintenance (7%)
- Administrative and support and waste management services (6%)
- Computer and electronic products (6%)
- Machinery (4%)
- Food (3%)
- Finance and insurance (11%)
- Educational services (10%)
- Professional, scientific, and technical services (10%)
- Health care (9%)
- Construction (6%)
- Accommodation and food services (6%)
- Computer and electronic products (5%)
- Electrical equipment mechanics and other installation, maintenance, and repair occupations including supervisors (8%)
- Sales representatives, services, wholesale and manufacturing (7%)
- Other production occupations including supervisors (7%)
- Other management occupations except farmers and farm managers (6%)
- Laborers and material movers, hand (5%)
- Other sales and related workers including supervisors (4%)
- Top executives (4%)
- Other management occupations except farmers and farm managers (6%)
- Cooks and food preparation workers (5%)
- Secretaries and administrative assistants (4%)
- Advertising, marketing, promotions, public relations, and sales managers (4%)
- Sales representatives, services, wholesale and manufacturing (4%)
- Other sales and related workers including supervisors (3%)
- Business operations specialists (3%)
Most common first ancestries reported in Louisville township:
- German (47.1%)
- Norwegian (12.1%)
- Irish (6.8%)
- United States or American (5.7%)
- Swedish (5.2%)
- English (2.2%)
- Polish (1.4%)
Most common places of birth for the foreign-born residents:
- Mexico (51%)
- Honduras (14%)
- Spain (7%)
- Colombia (6%)
- Romania (5%)
- Laos (4%)
- Guatemala (4%)
Means of transportation to work:
- Drove a car alone: 526 (80%)
- Carpooled: 80 (12%)
- Walked: 5 (1%)
- Other means: 9 (1%)
- Worked at home: 35 (5%)
Most commonly used house heating fuel:
- Utility gas (80%)
- Bottled, tank, or LP gas (11%)
- Fuel oil, kerosene, etc. (5%)
- Electricity (3%)
- Wood (1%)
90.2% of residents of Louisville township speak English at home.
8.1% of residents speak Spanish at home (32% speak English very well, 31% speak English well, 31% speak English not well, 5% don't speak English at all).
1.0% of residents speak other Indo-European language at home (83% speak English very well, 17% speak English not well).
0.7% of residents speak Asian or Pacific Island language at home (50% speak English very well, 50% speak English well).
Household type by relationship:
Households: 1,246- In family households: 1,177 (306 male householders, 36 female householders)
312 spouses, 467 children (436 natural, 14 adopted, 17 stepchildren), 2 grandchildren, 7 brothers or sisters, 6 parents, 11 other relatives, 30 non-relatives
- In nonfamily households: 69 (34 male householders (23 living alone)), 19 female householders (15 living alone)), 16 nonrelatives
Size of family households: 120 2-persons, 70 3-persons, 82 4-persons, 43 5-persons, 14 6-persons, 13 7-or-more-persons,
Size of nonfamily households: 38 1-person, 15 2-persons,
394 married couples with children.
33 single-parent households (12 men, 21 women).
Private vs. public school enrollment:
Students in private schools in grades 1 to 8 (elementary and middle school): 58
| Here: | 32.6% |
| Minnesota: | 11.7% |
Students in private schools in grades 9 to 12 (high school): 2
| Here: | 2.1% |
| Minnesota: | 6.8% |
Students in private undergraduate colleges: 5
| Here: | 9.1% |
| Minnesota: | 24.6% |