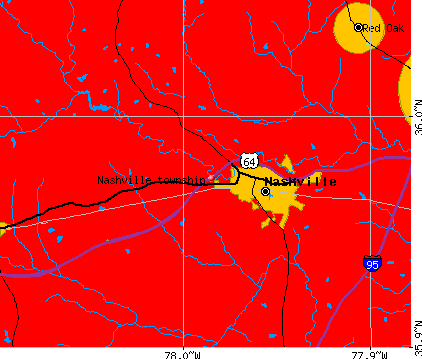
Nashville township, Nash County, North Carolina (NC) detailed profile
Number of foreign born residents: 2 (6% naturalized citizens)
| Nashville township: | 1.9% |
| Whole state: | 5.3% |
65% of Nashville township residents lived in the same house 5 years ago.
Out of people who lived in different houses, 62% lived in this county.
Out of people who lived in different counties, 67% lived in North Carolina.
Place of birth for U.S.-born residents:
- This state: 6662
- Northeast: 324
- Midwest: 178
- South: 895
- West: 54
Median price asked for vacant for-sale houses in 2000: $87,800
Percentage of households with unmarried partners: 3.4%
Likely homosexual households (counted as self-reported same-sex unmarried-partner households)
- Lesbian couples: 0.2% of all households
- Gay men: 0.1% of all households
People in group quarters in Nashville township, North Carolina:
- 594 people in state prisons
- 164 people in nursing homes
- 160 people in local jails and other confinement facilities (including police lockups)
- 14 people in other noninstitutional group quarters
- 6 people in homes for the mentally ill
- 3 people in other group homes

Housing units in structures:
- One, detached: 2,344
- One, attached: 82
- Two: 77
- 3 or 4: 106
- 5 to 9: 15
- 10 to 19: 62
- 20 to 49: 9
- 50 or more: 22
- Mobile homes: 413
Median worth of mobile homes: $42,300
Housing units in Nashville township with a mortgage: 1,073 (90 second mortgage, 263 home equity loan, 12 both second mortgage and home equity loan)
Houses without a mortgage: 547
- Construction (12%)
- Educational services (5%)
- Food and beverage stores (5%)
- Motor vehicle and parts dealers (5%)
- Repair and maintenance (4%)
- Public administration (4%)
- Professional, scientific, and technical services (4%)
- Educational services (18%)
- Health care (16%)
- Finance and insurance (6%)
- Public administration (5%)
- Department and other general merchandise stores (4%)
- Social assistance (3%)
- Professional, scientific, and technical services (3%)
- Other production occupations including supervisors (8%)
- Other sales and related workers including supervisors (8%)
- Driver/sales workers and truck drivers (7%)
- Retail sales workers except cashiers (7%)
- Electrical equipment mechanics and other installation, maintenance, and repair occupations including supervisors (6%)
- Other management occupations except farmers and farm managers (5%)
- Vehicle and mobile equipment mechanics, installers, and repairers (4%)
- Other office and administrative support workers including supervisors (11%)
- Other production occupations including supervisors (7%)
- Preschool, kindergarten, elementary and middle school teachers (6%)
- Information and record clerks except customer service representatives (6%)
- Secretaries and administrative assistants (5%)
- Retail sales workers except cashiers (4%)
- Cashiers (4%)
Most common first ancestries reported in Nashville township:
- United States or American (19.8%)
- English (11.2%)
- German (4.6%)
- Irish (4.5%)
- Italian (2.4%)
- Jordanian (1.7%)
- African (1.5%)
Most common places of birth for the foreign-born residents:
- Mexico (35%)
- Jordan (35%)
- Japan (14%)
- Haiti (11%)
- Canada (3%)
- Germany (2%)
Means of transportation to work:
- Drove a car alone: 2,776 (84%)
- Carpooled: 420 (13%)
- Walked: 33 (1%)
- Other means: 31 (1%)
- Worked at home: 49 (1%)
Most commonly used house heating fuel:
- Electricity (45%)
- Bottled, tank, or LP gas (38%)
- Utility gas (7%)
- Fuel oil, kerosene, etc. (7%)
- Wood (3%)
People in group quarters in Nashville township, North Carolina:
- 594 people in state prisons
- 164 people in nursing homes
- 160 people in local jails and other confinement facilities (including police lockups)
- 14 people in other noninstitutional group quarters
- 6 people in homes for the mentally ill
- 3 people in other group homes
95.5% of residents of Nashville township speak English at home.
1.8% of residents speak Spanish at home (41% speak English very well, 16% speak English well, 24% speak English not well, 19% don't speak English at all).
1.1% of residents speak other Indo-European language at home (70% speak English very well, 30% speak English well).
0.3% of residents speak Asian or Pacific Island language at home (52% speak English well, 48% speak English not well).
1.3% of residents speak other language at home (93% speak English very well, 7% speak English not well).
Household type by relationship:
Households: 7,383- In family households: 6,587 (1,602 male householders, 562 female householders)
1,638 spouses, 2,318 children (2,070 natural, 47 adopted, 201 stepchildren), 220 grandchildren, 65 brothers or sisters, 43 parents, 76 other relatives, 63 non-relatives
- In nonfamily households: 796 (316 male householders (286 living alone)), 449 female householders (438 living alone)), 31 nonrelatives
- In group quarters: 924 (896 institutionalized population)
Size of family households: 984 2-persons, 566 3-persons, 376 4-persons, 145 5-persons, 81 6-persons, 12 7-or-more-persons,
Size of nonfamily households: 724 1-person, 41 2-persons,
1,258 married couples with children.
406 single-parent households (59 men, 347 women).
Private vs. public school enrollment:
Students in private schools in grades 1 to 8 (elementary and middle school): 62
| Here: | 6.8% |
| North Carolina: | 8.2% |
Students in private schools in grades 9 to 12 (high school): 44
| Here: | 7.4% |
| North Carolina: | 6.9% |
Students in private undergraduate colleges: 66
| Here: | 15.8% |
| North Carolina: | 20.2% |