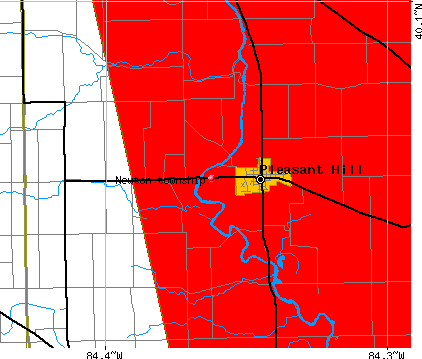
Newton township, Miami County, Ohio (OH) detailed profile
Number of foreign born residents: 0 (67% naturalized citizens)
| Newton township: | 0.4% |
| Whole state: | 3.0% |
68% of Newton township residents lived in the same house 5 years ago.
Out of people who lived in different houses, 80% lived in this county.
Out of people who lived in different counties, 88% lived in Ohio.
Place of birth for U.S.-born residents:
- This state: 2878
- Northeast: 70
- Midwest: 132
- South: 215
- West: 45
Median price asked for vacant for-sale houses in 2000: $87,500
Percentage of households with unmarried partners: 3.0%
Likely homosexual households (counted as self-reported same-sex unmarried-partner households)
- Lesbian couples: 0.2% of all households
- Gay men: 0.2% of all households
Housing units in structures:
- One, detached: 1,133
- One, attached: 8
- Two: 28
- 3 or 4: 21
- Mobile homes: 56
Median worth of mobile homes: $52,000
Housing units in Newton township with a mortgage: 563 (49 second mortgage, 138 home equity loan, 9 both second mortgage and home equity loan)
Houses without a mortgage: 194
- Construction (16%)
- Metal and metal products (7%)
- Machinery (5%)
- Educational services (5%)
- Food and beverage stores (4%)
- Transportation equipment (4%)
- Agriculture, forestry, fishing and hunting (4%)
- Health care (18%)
- Public administration (7%)
- Educational services (7%)
- Social assistance (6%)
- Transportation equipment (5%)
- Accommodation and food services (4%)
- Administrative and support and waste management services (4%)
- Metal workers and plastic workers (8%)
- Material recording, scheduling, dispatching, and distributing workers (7%)
- Other production occupations including supervisors (6%)
- Building and grounds cleaning and maintenance occupations (6%)
- Driver/sales workers and truck drivers (5%)
- Vehicle and mobile equipment mechanics, installers, and repairers (5%)
- Retail sales workers except cashiers (4%)
- Secretaries and administrative assistants (7%)
- Cooks and food preparation workers (6%)
- Registered nurses (6%)
- Other production occupations including supervisors (6%)
- Other office and administrative support workers including supervisors (5%)
- Business operations specialists (5%)
- Information and record clerks except customer service representatives (5%)
Most common first ancestries reported in Newton township:
- German (48.7%)
- United States or American (20.9%)
- English (6.8%)
- Irish (3.6%)
- Hungarian (2.4%)
- Italian (2.3%)
- French (except Basque) (2.0%)
Most common places of birth for the foreign-born residents:
- Germany (42%)
- Ireland (25%)
- Philippines (17%)
- Panama (17%)
Means of transportation to work:
- Drove a car alone: 1,419 (84%)
- Carpooled: 128 (8%)
- Walked: 40 (2%)
- Other means: 8 (0%)
- Worked at home: 89 (5%)
Most commonly used house heating fuel:
- Utility gas (26%)
- Electricity (25%)
- Fuel oil, kerosene, etc. (23%)
- Bottled, tank, or LP gas (21%)
- Wood (5%)
- Other fuel (1%)
97.4% of residents of Newton township speak English at home.
1.5% of residents speak Spanish at home (89% speak English very well, 11% speak English not well).
1.0% of residents speak other Indo-European language at home (74% speak English very well, 19% speak English well, 6% speak English not well).
0.1% of residents speak Asian or Pacific Island language at home (100% speak English very well).
Household type by relationship:
Households: 3,354- In family households: 3,080 (872 male householders, 123 female householders)
883 spouses, 1,099 children (999 natural, 58 adopted, 42 stepchildren), 24 grandchildren, 10 brothers or sisters, 16 parents, 24 other relatives, 29 non-relatives
- In nonfamily households: 274 (101 male householders (81 living alone)), 122 female householders (100 living alone)), 51 nonrelatives
Size of family households: 458 2-persons, 181 3-persons, 220 4-persons, 93 5-persons, 38 6-persons, 5 7-or-more-persons,
Size of nonfamily households: 181 1-person, 32 2-persons, 10 3-persons,
808 married couples with children.
77 single-parent households (18 men, 59 women).
Private vs. public school enrollment:
Students in private schools in grades 1 to 8 (elementary and middle school): 58
| Here: | 13.5% |
| Ohio: | 14.2% |
Students in private schools in grades 9 to 12 (high school): 16
| Here: | 5.9% |
| Ohio: | 10.9% |
Students in private undergraduate colleges: 34
| Here: | 28.8% |
| Ohio: | 23.4% |