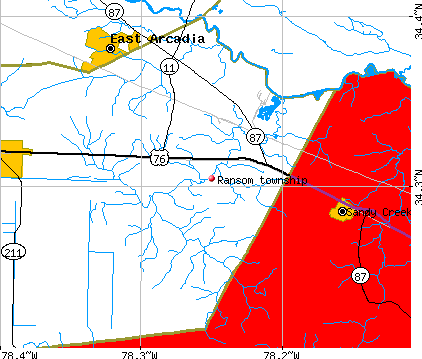
Ransom township, Columbus County, North Carolina (NC) detailed profile
Number of foreign born residents: 3 (3% naturalized citizens)
| Ransom township: | 3.1% |
| Whole state: | 5.3% |
68% of Ransom township residents lived in the same house 5 years ago.
Out of people who lived in different houses, 54% lived in this county.
Out of people who lived in different counties, 73% lived in North Carolina.
Place of birth for U.S.-born residents:
- This state: 3201
- Northeast: 219
- Midwest: 75
- South: 353
- West: 67
Median price asked for vacant for-sale houses in 2000: $45,000
Percentage of households with unmarried partners: 3.0%
Likely homosexual households (counted as self-reported same-sex unmarried-partner households)
- Lesbian couples: 0.0% of all households
- Gay men: 0.3% of all households
Housing units in structures:
- One, detached: 1,121
- One, attached: 5
- Two: 2
- Mobile homes: 583
Median worth of mobile homes: $54,600
Housing units in Ransom township with a mortgage: 381 (34 second mortgage, 35 home equity loan, 0 both second mortgage and home equity loan)
Houses without a mortgage: 348
- Construction (21%)
- Paper (17%)
- Agriculture, forestry, fishing and hunting (6%)
- Truck transportation (5%)
- Repair and maintenance (5%)
- Chemicals (5%)
- Health care (4%)
- Health care (15%)
- Educational services (11%)
- Food and beverage stores (8%)
- Paper (5%)
- Professional, scientific, and technical services (5%)
- Accommodation and food services (4%)
- Department and other general merchandise stores (4%)
- Other production occupations including supervisors (12%)
- Electrical equipment mechanics and other installation, maintenance, and repair occupations including supervisors (11%)
- Driver/sales workers and truck drivers (8%)
- Vehicle and mobile equipment mechanics, installers, and repairers (8%)
- Construction trades workers except carpenters, electricians, painters, plumbers, and construction laborers (8%)
- Laborers and material movers, hand (5%)
- Metal workers and plastic workers (4%)
- Cashiers (8%)
- Other production occupations including supervisors (6%)
- Other office and administrative support workers including supervisors (6%)
- Secretaries and administrative assistants (5%)
- Material recording, scheduling, dispatching, and distributing workers (5%)
- Registered nurses (4%)
- Building and grounds cleaning and maintenance occupations (4%)
Most common first ancestries reported in Ransom township:
- United States or American (27.5%)
- English (6.8%)
- German (4.0%)
- Irish (3.6%)
- Scotch-Irish (2.0%)
- African (1.6%)
- French Canadian (0.7%)
Most common places of birth for the foreign-born residents:
- Mexico (100%)
Means of transportation to work:
- Drove a car alone: 1,300 (82%)
- Carpooled: 213 (14%)
- Walked: 10 (1%)
- Other means: 31 (2%)
- Worked at home: 23 (1%)
Most commonly used house heating fuel:
- Electricity (49%)
- Bottled, tank, or LP gas (35%)
- Fuel oil, kerosene, etc. (9%)
- Wood (2%)
- Utility gas (2%)
- Other fuel (1%)
- No fuel used (1%)
93.0% of residents of Ransom township speak English at home.
6.5% of residents speak Spanish at home (36% speak English very well, 25% speak English well, 34% speak English not well, 5% don't speak English at all).
0.5% of residents speak other Indo-European language at home (100% speak English very well).
Household type by relationship:
Households: 4,047- In family households: 3,695 (924 male householders, 288 female householders)
968 spouses, 1,190 children (1,102 natural, 36 adopted, 52 stepchildren), 93 grandchildren, 23 brothers or sisters, 21 parents, 79 other relatives, 109 non-relatives
- In nonfamily households: 352 (149 male householders (141 living alone)), 177 female householders (163 living alone)), 26 nonrelatives
Size of family households: 545 2-persons, 286 3-persons, 224 4-persons, 95 5-persons, 34 6-persons, 28 7-or-more-persons,
Size of nonfamily households: 304 1-person, 22 2-persons,
699 married couples with children.
208 single-parent households (47 men, 161 women).
Private vs. public school enrollment:
Students in private schools in grades 1 to 8 (elementary and middle school): 81
| Here: | 17.2% |
| North Carolina: | 8.2% |
Students in private schools in grades 9 to 12 (high school): 9
| Here: | 5.2% |
| North Carolina: | 6.9% |
Students in private undergraduate colleges: 5
| Here: | 3.9% |
| North Carolina: | 20.2% |