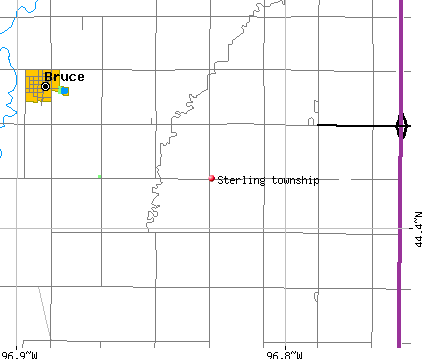
Sterling township, Brookings County, South Dakota (SD) detailed profile
Land area: 35.4 sq. mi.
Water area: 0.0 sq. mi.
Population: 377 (all rural)
| Males: 202 | |
| Females: 175 |
Occupied houses/apartments: 377 (274 owner occupied, 103 renter occupied)
| % of renters here: | 27% |
| State: | 32% |
Races in Sterling township:
- White Non-Hispanic: 97.1%
- Black: 0.3%
- American Indian and Alaska Native: 0.8%
- Asian: 0.8%
- Two or more races: 0.5%
Median age of males: 36.2
Median age of females: 36.7
Discuss South Dakota on our huge forum. We have over 16 million posts!
Average household size: 2.67
| Sterling township: | 2.7 people |
| South Dakota: | 2.5 people |
Average family size: 3.05
| Sterling township: | $47,141 |
| South Dakota: | $48,947 |
| Here: | $567 |
| State: | $529 |
Estimated median house or condo value in 2013: $154,080 (it was $84,800 in 2000)
| : | $154,080 |
| South Dakota: | $138,400 |
| Population density: 11 people per square mile | (low). |
Notable locations in this township outside city limits:
Notable location: Sterling Township Hall (A). Display/hide its location on the map
Church in Sterling township: Sterling Church (A). Display/hide its location on the map
Cemetery: Deer Creek Cemetery (1). Display/hide its location on the map
57% of Sterling township residents lived in the same house 5 years ago.
Out of people who lived in different houses, 74% lived in this county.
Out of people who lived in different counties, 39% lived in South Dakota.
Place of birth for U.S.-born residents:
- This state: 296
- Northeast: 0
- Midwest: 95
- South: 13
- West: 0
Percentage of households with unmarried partners: 1.4%
No gay or lesbian households reported
Housing units in structures:
- One, detached: 102
- Mobile homes: 41
Median worth of mobile homes: $65,000
Housing units in Sterling township with a mortgage: 30 (12 second mortgage, 4 home equity loan, 0 both second mortgage and home equity loan)
Houses without a mortgage: 0
- Agriculture, forestry, fishing and hunting (18%)
- Educational services (15%)
- Miscellaneous manufacturing (14%)
- Construction (12%)
- Broadcasting, internet publishing, and telecommunications services (9%)
- Accommodation and food services (9%)
- Professional, scientific, and technical services (7%)
- Educational services (24%)
- Miscellaneous manufacturing (16%)
- Health care (16%)
- Private households (9%)
- Accommodation and food services (8%)
- Religious, grantmaking, civic, professional, and similar organizations (7%)
- Social assistance (6%)
- Other management occupations except farmers and farm managers (22%)
- Farmers and farm managers (12%)
- Entertainers and performers, sports, and related workers (9%)
- Agricultural workers including supervisors (8%)
- Vehicle and mobile equipment mechanics, installers, and repairers (6%)
- Postsecondary teachers (5%)
- Physicians and surgeons (5%)
- Secretaries and administrative assistants (14%)
- Building and grounds cleaning and maintenance occupations (9%)
- Other production occupations including supervisors (9%)
- Counselors, social workers, and other community and social service specialists (7%)
- Other health diagnosing and treating practitioners and technical occupations (7%)
- Cooks and food preparation workers (6%)
- Other food preparation and serving workers including supervisors (6%)
Most common first ancestries reported in Sterling township:
- Norwegian (30.9%)
- German (23.4%)
- Irish (8.3%)
- Dutch (7.5%)
- Danish (6.8%)
- Czech (5.8%)
- Belgian (4.3%)
Means of transportation to work:
- Drove a car alone: 160 (78%)
- Carpooled: 37 (18%)
- Worked at home: 8 (4%)
Most commonly used house heating fuel:
- Bottled, tank, or LP gas (66%)
- Fuel oil, kerosene, etc. (19%)
- Utility gas (8%)
- Electricity (7%)
96.9% of residents of Sterling township speak English at home.
1.6% of residents speak Spanish at home (100% speak English very well).
1.6% of residents speak other language at home (100% speak English very well).
Household type by relationship:
Households: 404- In family households: 377 (99 male householders, 10 female householders)
125 spouses, 137 children (119 natural, 12 adopted, 6 stepchildren), 6 grandchildren, 0 brothers or sisters, 0 parents, 0 other relatives, 0 non-relatives
- In nonfamily households: 27 (13 male householders (13 living alone)), 14 female householders (14 living alone)), 0 nonrelatives
Size of family households: 39 2-persons, 24 3-persons, 42 4-persons, 4 6-persons,
Size of nonfamily households: 27 1-person,
95 married couples with children.
10 single-parent households (6 men, 4 women).
Private vs. public school enrollment:
Students in private schools in grades 1 to 8 (elementary and middle school): 20
| Here: | 35.7% |
| South Dakota: | 8.0% |
Students in private schools in grades 9 to 12 (high school): 0
| Here: | 0.0% |
| South Dakota: | 5.6% |
Students in private undergraduate colleges: 0
| Here: | 0.0% |
| South Dakota: | 17.8% |