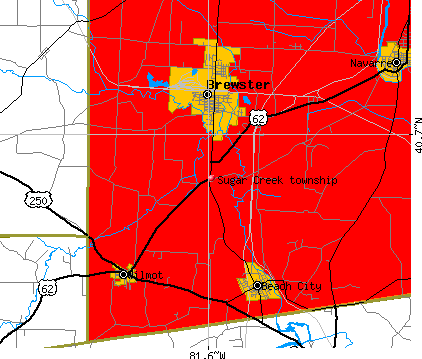
Sugar Creek township, Stark County, Ohio (OH) detailed profile
Number of foreign born residents: 0 (73% naturalized citizens)
| Sugar Creek township: | 0.5% |
| Whole state: | 3.0% |
70% of Sugar Creek township residents lived in the same house 5 years ago.
Out of people who lived in different houses, 73% lived in this county.
Out of people who lived in different counties, 76% lived in Ohio.
Place of birth for U.S.-born residents:
- This state: 5683
- Northeast: 227
- Midwest: 114
- South: 565
- West: 85
Median price asked for vacant for-sale houses in 2000: $71,900
Percentage of households with unmarried partners: 5.1%
Likely homosexual households (counted as self-reported same-sex unmarried-partner households)
- Lesbian couples: 0.1% of all households
- Gay men: 0.1% of all households
198 people in nursing homes

Housing units in structures:
- One, detached: 1,986
- One, attached: 40
- Two: 60
- 3 or 4: 57
- 5 to 9: 26
- 10 to 19: 35
- 20 to 49: 11
- Mobile homes: 341
Median worth of mobile homes: $27,500
Housing units in Sugar Creek township with a mortgage: 1,006 (105 second mortgage, 117 home equity loan, 0 both second mortgage and home equity loan)
Houses without a mortgage: 559
- Metal and metal products (14%)
- Construction (8%)
- Food (6%)
- Truck transportation (5%)
- Rail transportation (4%)
- Accommodation and food services (4%)
- Transportation equipment (4%)
- Health care (22%)
- Accommodation and food services (10%)
- Food (7%)
- Educational services (6%)
- Food and beverage stores (5%)
- Plastics and rubber products (5%)
- Professional, scientific, and technical services (4%)
- Metal workers and plastic workers (12%)
- Driver/sales workers and truck drivers (11%)
- Other production occupations including supervisors (10%)
- Laborers and material movers, hand (7%)
- Material recording, scheduling, dispatching, and distributing workers (5%)
- Electrical equipment mechanics and other installation, maintenance, and repair occupations including supervisors (4%)
- Other sales and related workers including supervisors (4%)
- Other production occupations including supervisors (7%)
- Cooks and food preparation workers (5%)
- Nursing, psychiatric, and home health aides (5%)
- Health technologists and technicians (5%)
- Cashiers (5%)
- Other management occupations except farmers and farm managers (5%)
- Metal workers and plastic workers (5%)
Most common first ancestries reported in Sugar Creek township:
- German (34.4%)
- United States or American (16.2%)
- Irish (8.1%)
- English (8.0%)
- Italian (7.1%)
- Swiss (4.6%)
- French (except Basque) (2.2%)
Most common places of birth for the foreign-born residents:
- Other Western Europe (27%)
- Other Central America (27%)
- Austria (18%)
- Other Australian and New Zealand Subregion (9%)
- El Salvador (9%)
- Mexico (6%)
Means of transportation to work:
- Drove a car alone: 2,709 (89%)
- Carpooled: 169 (6%)
- Bicycle: 3 (0%)
- Walked: 81 (3%)
- Other means: 18 (1%)
- Worked at home: 67 (2%)
Most commonly used house heating fuel:
- Utility gas (64%)
- Fuel oil, kerosene, etc. (17%)
- Electricity (11%)
- Bottled, tank, or LP gas (6%)
- Wood (1%)
- Other fuel (1%)
198 people in nursing homes
95.8% of residents of Sugar Creek township speak English at home.
0.9% of residents speak Spanish at home (86% speak English very well, 14% speak English well).
3.2% of residents speak other Indo-European language at home (73% speak English very well, 24% speak English well, 3% speak English not well).
0.1% of residents speak other language at home (100% speak English very well).
Household type by relationship:
Households: 6,539- In family households: 5,828 (1,557 male householders, 302 female householders)
1,593 spouses, 2,063 children (1,882 natural, 58 adopted, 123 stepchildren), 77 grandchildren, 20 brothers or sisters, 22 parents, 89 other relatives, 105 non-relatives
- In nonfamily households: 711 (305 male householders (255 living alone)), 301 female householders (252 living alone)), 105 nonrelatives
- In group quarters: 201 (all institutionalized)
Size of family households: 773 2-persons, 423 3-persons, 403 4-persons, 179 5-persons, 52 6-persons, 29 7-or-more-persons,
Size of nonfamily households: 507 1-person, 87 2-persons, 5 3-persons, 7 4-persons,
1,313 married couples with children.
292 single-parent households (84 men, 208 women).
Private vs. public school enrollment:
Students in private schools in grades 1 to 8 (elementary and middle school): 34
| Here: | 4.0% |
| Ohio: | 14.2% |
Students in private schools in grades 9 to 12 (high school): 30
| Here: | 7.2% |
| Ohio: | 10.9% |
Students in private undergraduate colleges: 39
| Here: | 24.2% |
| Ohio: | 23.4% |