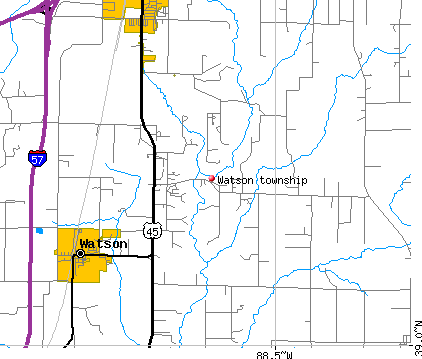
Watson township, Effingham County, Illinois (IL) detailed profile
Number of foreign born residents: 0 (0% naturalized citizens)
| Watson township: | 0.3% |
| Whole state: | 12.3% |
61% of Watson township residents lived in the same house 5 years ago.
Out of people who lived in different houses, 61% lived in this county.
Out of people who lived in different counties, 72% lived in Illinois.
Place of birth for U.S.-born residents:
- This state: 2809
- Northeast: 25
- Midwest: 183
- South: 99
- West: 77
Median price asked for vacant for-sale houses in 2000: $80,000
Percentage of households with unmarried partners: 5.1%
Likely homosexual households (counted as self-reported same-sex unmarried-partner households)
- Lesbian couples: 0.3% of all households
- Gay men: 0.5% of all households

Housing units in structures:
- One, detached: 782
- One, attached: 29
- Two: 18
- 3 or 4: 10
- 5 to 9: 9
- 10 to 19: 5
- Mobile homes: 349
- Boats, RVs, vans, etc.: 3
Median worth of mobile homes: $25,000
Housing units in Watson township with a mortgage: 414 (45 second mortgage, 43 home equity loan, 0 both second mortgage and home equity loan)
Houses without a mortgage: 120
- Printing and related support activities (16%)
- Construction (14%)
- Repair and maintenance (9%)
- Truck transportation (7%)
- Food and beverage stores (5%)
- Furniture and related product manufacturing (4%)
- Motor vehicle and parts dealers (3%)
- Printing and related support activities (15%)
- Health care (13%)
- Educational services (11%)
- Accommodation and food services (10%)
- Publishing, and motion picture and sound recording industries (8%)
- Food and beverage stores (5%)
- Gasoline stations (3%)
- Other production occupations including supervisors (9%)
- Driver/sales workers and truck drivers (8%)
- Laborers and material movers, hand (7%)
- Building and grounds cleaning and maintenance occupations (5%)
- Printing workers (5%)
- Other sales and related workers including supervisors (4%)
- Material moving workers except supervisors and laborers and material movers, hand (4%)
- Printing workers (7%)
- Other office and administrative support workers including supervisors (7%)
- Other production occupations including supervisors (6%)
- Cooks and food preparation workers (6%)
- Laborers and material movers, hand (5%)
- Cashiers (5%)
- Information and record clerks except customer service representatives (4%)
Most common first ancestries reported in Watson township:
- German (43.0%)
- United States or American (21.4%)
- Irish (9.8%)
- English (8.6%)
- French Canadian (2.0%)
- Italian (1.7%)
- Dutch (1.6%)
Most common places of birth for the foreign-born residents:
- Bolivia (67%)
- Canada (33%)
Means of transportation to work:
- Drove a car alone: 1,554 (87%)
- Carpooled: 159 (9%)
- Taxi: 12 (1%)
- Walked: 17 (1%)
- Other means: 19 (1%)
- Worked at home: 31 (2%)
Most commonly used house heating fuel:
- Utility gas (48%)
- Electricity (26%)
- Bottled, tank, or LP gas (23%)
- Wood (3%)
- Fuel oil, kerosene, etc. (1%)
98.0% of residents of Watson township speak English at home.
1.4% of residents speak Spanish at home (88% speak English very well, 5% speak English not well, 7% don't speak English at all).
0.5% of residents speak other Indo-European language at home (56% speak English very well, 44% speak English well).
Household type by relationship:
Households: 3,220- In family households: 2,913 (716 male householders, 159 female householders)
680 spouses, 1,196 children (1,061 natural, 14 adopted, 121 stepchildren), 51 grandchildren, 7 brothers or sisters, 8 parents, 18 other relatives, 78 non-relatives
- In nonfamily households: 307 (146 male householders (129 living alone)), 132 female householders (125 living alone)), 29 nonrelatives
Size of family households: 295 2-persons, 261 3-persons, 168 4-persons, 95 5-persons, 41 6-persons, 15 7-or-more-persons,
Size of nonfamily households: 254 1-person, 20 2-persons, 1 3-persons, 3 4-persons,
718 married couples with children.
215 single-parent households (72 men, 143 women).
Private vs. public school enrollment:
Students in private schools in grades 1 to 8 (elementary and middle school): 43
| Here: | 10.3% |
| Illinois: | 13.4% |
Students in private schools in grades 9 to 12 (high school): 14
| Here: | 6.2% |
| Illinois: | 11.1% |
Students in private undergraduate colleges: 8
| Here: | 6.9% |
| Illinois: | 25.8% |