Work and Jobs in Armstrong, Missouri (MO) Detailed Stats
Data:
Unemployment (%)
Unemployment (% change since 2000)
Unemployment (%) - White
Unemployment (% change since 2000) - White
Unemployment (%) - Black or African American
Unemployment (% change since 2000) - Black or African American
Unemployment (%) - Asian
Unemployment (% change since 2000) - Asian
Unemployment (%) - Hispanic or Latino
Unemployment (% change since 2000) - Hispanic or Latino
Unemployment (%) - American Indian and Alaska Native
Unemployment (% change since 2000) - American Indian and Alaska Native
Unemployment (%) - Multirace
Unemployment (% change since 2000) - Multirace
Unemployment (%) - Other Race
Unemployment (% change since 2000) - Other Race
Industry diversity
Most Common Industries - Agriculture, forestry, fishing and hunting, and mining (%)
Most Common Industries - Agriculture, forestry, fishing and hunting (%)
Most Common Industries - Mining, quarrying, and oil and gas extraction (%)
Most Common Industries - Construction (%)
Most Common Industries - Manufacturing (%)
Most Common Industries - Wholesale trade (%)
Most Common Industries - Retail trade (%)
Most Common Industries - Transportation and warehousing, and utilities (%)
Most Common Industries - Transportation and warehousing (%)
Most Common Industries - Utilities (%)
Most Common Industries - Information (%)
Most Common Industries - Finance and insurance, and real estate and rental and leasing (%)
Most Common Industries - Finance and insurance (%)
Most Common Industries - Real estate and rental and leasing (%)
Most Common Industries - Professional, scientific, and management, and administrative and waste management services (%)
Most Common Industries - Professional, scientific, and technical services (%)
Most Common Industries - Management of companies and enterprises (%)
Most Common Industries - Administrative and support and waste management services (%)
Most Common Industries - Educational services, and health care and social assistance (%)
Most Common Industries - Educational services (%)
Most Common Industries - Health care and social assistance (%)
Most Common Industries - Arts, entertainment, and recreation, and accommodation and food services (%)
Most Common Industries - Arts, entertainment, and recreation (%)
Most Common Industries - Accommodation and food services (%)
Most Common Industries - Other services, except public administration (%)
Most Common Industries - Public administration (%)
Occupation diversity
Most Common Occupations - Management, business, science, and arts occupations (%)
Most Common Occupations - Management, business, and financial occupations (%)
Most Common Occupations - Management occupations (%)
Most Common Occupations - Business and financial operations occupations (%)
Most Common Occupations - Computer, engineering, and science occupations (%)
Most Common Occupations - Computer and mathematical occupations (%)
Most Common Occupations - Architecture and engineering occupations (%)
Most Common Occupations - Life, physical, and social science occupations (%)
Most Common Occupations - Education, legal, community service, arts, and media occupations (%)
Most Common Occupations - Community and social service occupations (%)
Most Common Occupations - Legal occupations (%)
Most Common Occupations - Education, training, and library occupations (%)
Most Common Occupations - Arts, design, entertainment, sports, and media occupations (%)
Most Common Occupations - Healthcare practitioners and technical occupations (%)
Most Common Occupations - Health diagnosing and treating practitioners and other technical occupations (%)
Most Common Occupations - Health technologists and technicians (%)
Most Common Occupations - Service occupations (%)
Most Common Occupations - Healthcare support occupations (%)
Most Common Occupations - Protective service occupations (%)
Most Common Occupations - Fire fighting and prevention, and other protective service workers including supervisors (%)
Most Common Occupations - Law enforcement workers including supervisors (%)
Most Common Occupations - Food preparation and serving related occupations (%)
Most Common Occupations - Building and grounds cleaning and maintenance occupations (%)
Most Common Occupations - Personal care and service occupations (%)
Most Common Occupations - Sales and office occupations (%)
Most Common Occupations - Sales and related occupations (%)
Most Common Occupations - Office and administrative support occupations (%)
Most Common Occupations - Natural resources, construction, and maintenance occupations (%)
Most Common Occupations - Farming, fishing, and forestry occupations (%)
Most Common Occupations - Construction and extraction occupations (%)
Most Common Occupations - Installation, maintenance, and repair occupations (%)
Most Common Occupations - Production, transportation, and material moving occupations (%)
Most Common Occupations - Production occupations (%)
Most Common Occupations - Transportation occupations (%)
Most Common Occupations - Material moving occupations (%)
Private vehicle occupancy - Drove alone (% change since 2000)
Private vehicle occupancy - Carpooled (%)
Private vehicle occupancy - Carpooled (% change since 2000)
Private vehicle occupancy - In 2-person carpool (%)
Private vehicle occupancy - In 2-person carpool (% change since 2000)
Private vehicle occupancy - In 3-person carpool (%)
Private vehicle occupancy - In 3-person carpool (% change since 2000)
Private vehicle occupancy - In 4-person carpool (%)
Private vehicle occupancy - In 4-person carpool (% change since 2000)
Private vehicle occupancy - In 5- or 6-person carpool (%)
Private vehicle occupancy - In 5- or 6-person carpool (% change since 2000)
Private vehicle occupancy - In 7-or-more-person carpool (%)
Private vehicle occupancy - In 7-or-more-person carpool (% change since 2000)
Time Leaving Home To Go To Work - 12:00 a.m. to 4:59 a.m. (%)
Time Leaving Home To Go To Work - 12:00 a.m. to 4:59 a.m. (% change since 2000)
Time Leaving Home To Go To Work - 5:00 a.m. to 5:59 a.m. (%)
Time Leaving Home To Go To Work - 5:00 a.m. to 5:59 a.m. (% change since 2000)
Time Leaving Home To Go To Work - 6:00 a.m. to 6:59 a.m. (%)
Time Leaving Home To Go To Work - 6:00 a.m. to 6:59 a.m. (% change since 2000)
Time Leaving Home To Go To Work - 7:00 a.m. to 7:59 a.m. (%)
Time Leaving Home To Go To Work - 7:00 a.m. to 7:59 a.m. (% change since 2000)
Time Leaving Home To Go To Work - 8:00 a.m. to 8:59 a.m. (%)
Time Leaving Home To Go To Work - 8:00 a.m. to 8:59 a.m. (% change since 2000)
Time Leaving Home To Go To Work - 9:00 a.m. to 9:59 a.m. (%)
Time Leaving Home To Go To Work - 9:00 a.m. to 9:59 a.m. (% change since 2000)
Time Leaving Home To Go To Work - 10:00 a.m. to 10:59 a.m. (%)
Time Leaving Home To Go To Work - 10:00 a.m. to 10:59 a.m. (% change since 2000)
Time Leaving Home To Go To Work - 11:00 a.m. to 11:59 a.m. (%)
Time Leaving Home To Go To Work - 11:00 a.m. to 11:59 a.m. (% change since 2000)
Time Leaving Home To Go To Work - 12:00 p.m. to 3:59 p.m. (%)
Time Leaving Home To Go To Work - 12:00 p.m. to 3:59 p.m. (% change since 2000)
Time Leaving Home To Go To Work - 4:00 p.m. to 11:59 p.m. (%)
Time Leaving Home To Go To Work - 4:00 p.m. to 11:59 p.m. (% change since 2000)
Class of Workers - Employee of private company (%)
Class of Workers - Employee of private company (% change since 2000)
Class of Workers - Self-employed in own incorporated business (%)
Class of Workers - Self-employed in own incorporated business (% change since 2000)
Class of Workers - Private not-for-profit wage and salary workers (%)
Class of Workers - Private not-for-profit wage and salary workers (% change since 2000)
Class of Workers - Local government workers (%)
Class of Workers - Local government workers (% change since 2000)
Class of Workers - State government workers (%)
Class of Workers - State government workers (% change since 2000)
Class of Workers - Federal government workers (%)
Class of Workers - Federal government workers (% change since 2000)
Class of Workers - Self-employed workers in own not incorporated business and Unpaid family workers (%)
Class of Workers - Self-employed workers in own not incorporated business and Unpaid family workers (% change since 2000)
Means of transportation to work - Drove car alone (%)
Means of transportation to work - Drove car alone (% change since 2000)
Means of transportation to work - Carpooled (%)
Means of transportation to work - Carpooled (% change since 2000)
Means of transportation to work - Public transportation (%)
Means of transportation to work - Public transportation (% change since 2000)
Means of transportation to work - Bus or trolley bus (%)
Means of transportation to work - Bus or trolley bus (% change since 2000)
Means of transportation to work - Streetcar or trolley car (%)
Means of transportation to work - Streetcar or trolley car (% change since 2000)
Means of transportation to work - Subway or elevated (%)
Means of transportation to work - Subway or elevated (% change since 2000)
Means of transportation to work - Railroad (%)
Means of transportation to work - Railroad (% change since 2000)
Means of transportation to work - Ferryboat (%)
Means of transportation to work - Ferryboat (% change since 2000)
Means of transportation to work - Taxicab (%)
Means of transportation to work - Taxicab (% change since 2000)
Means of transportation to work - Motorcycle (%)
Means of transportation to work - Motorcycle (% change since 2000)
Means of transportation to work - Bicycle (%)
Means of transportation to work - Bicycle (% change since 2000)
Means of transportation to work - Walked (%)
Means of transportation to work - Walked (% change since 2000)
Means of transportation to work - Other means (%)
Means of transportation to work - Other means (% change since 2000)
Working at home (%)
Working at home (% change since 2000)
Travel time to work - Less than 5 minutes (%)
Travel time to work - Less than 5 minutes (% change since 2000)
Travel time to work - 5 to 9 minutes (%)
Travel time to work - 5 to 9 minutes (% change since 2000)
Travel time to work - 10 to 19 minutes (%)
Travel time to work - 10 to 19 minutes (% change since 2000)
Travel time to work - 20 to 29 minutes (%)
Travel time to work - 20 to 29 minutes (% change since 2000)
Travel time to work - 30 to 39 minutes (%)
Travel time to work - 30 to 39 minutes (% change since 2000)
Travel time to work - 40 to 59 minutes (%)
Travel time to work - 40 to 59 minutes (% change since 2000)
Travel time to work - 60 to 89 minutes (%)
Travel time to work - 60 to 89 minutes (% change since 2000)
Travel time to work - 90 or more minutes (%)
Travel time to work - 90 or more minutes (% change since 2000)
Latest news about work in Armstrong, MO collected exclusively by city-data.com from local newspapers, TV, and radio stations
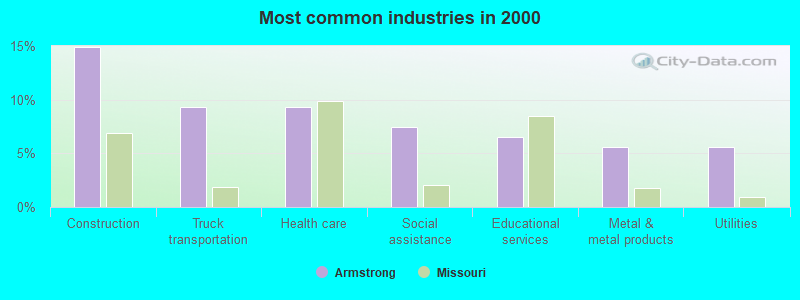
The most common industries in Armstrong are: Construction (15.0% of civilian employees), Truck transportation (9.3% of civilian employees), Health care (9.3% of civilian employees). 59.3% of workers work in Howard County. 74.8% of workers are employees of private companies, which is 9.7% greater than the rate of 67.6% across the entire state of Missouri.
Whole page based on the data from 2000 / 2022 when the population of Armstrong, Missouri was 287 / 263
Most common industries
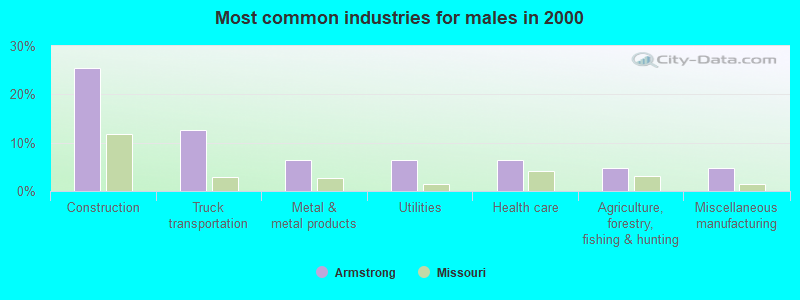
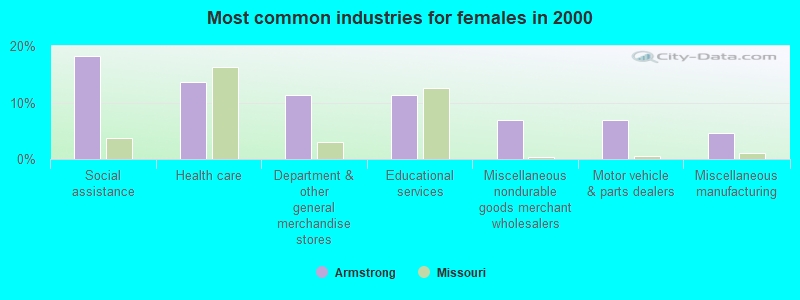
Most common industries Industry All Males Females
Construction 15.0% 25.4% 0.0% Truck transportation 9.3% 12.7% 4.5% Health care 9.3% 6.3% 13.6% Social assistance 7.5% 0.0% 18.2% Educational services 6.5% 3.2% 11.4% Metal and metal products 5.6% 6.3% 4.5% Utilities 5.6% 6.3% 4.5% Department and other general merchandise stores 4.7% 0.0% 11.4% Miscellaneous manufacturing 4.7% 4.8% 4.5% Agriculture, forestry, fishing and hunting 2.8% 4.8% 0.0% Miscellaneous nondurable goods merchant wholesalers 2.8% 0.0% 6.8% Motor vehicle and parts dealers 2.8% 0.0% 6.8% Arts, entertainment, and recreation 2.8% 4.8% 0.0% Food 1.9% 3.2% 0.0% Furniture and related product manufacturing 1.9% 3.2% 0.0% Textile mills and textile products 1.9% 0.0% 4.5% Petroleum and petroleum products merchant wholesalers 1.9% 3.2% 0.0% Public administration 1.9% 3.2% 0.0% Gasoline stations 1.9% 3.2% 0.0% Used merchandise, gift, novelty, and souvenir, and other miscellaneous stores 1.9% 3.2% 0.0% Other transportation, and support activities, and couriers 1.9% 3.2% 0.0% Repair and maintenance 1.9% 3.2% 0.0% Religious, grantmaking, civic, professional, and similar organizations 1.9% 0.0% 4.5% Private households 1.9% 0.0% 4.5%
Unemployment in Armstrong Unemployment by race in 2022
Unemployment rate for White non-Hispanic residents 3.4% Males3.5% FemalesUnemployment rate for two or more race residents 66.6% FemalesUnemployment by race in 2000
Unemployment rate for White non-Hispanic residents 16.9% Males2.6% Females
Time leaving home to go to work 12:00 a.m. to 4:59 a.m.: Armstrong:
8.4% (10)Missouri:
5.1% (132,194)
5:00 a.m. to 5:29 a.m.: Armstrong:
0.8% (1)Missouri:
4.0% (102,750)
5:30 a.m. to 5:59 a.m.: Armstrong:
8.0% (10)Missouri:
5.2% (133,808)
6:00 a.m. to 6:29 a.m.: Armstrong:
0.8% (1)Missouri:
9.4% (241,561)
6:30 a.m. to 6:59 a.m.: Armstrong:
11.4% (14)Missouri:
10.8% (276,741)
7:00 a.m. to 7:29 a.m.: Armstrong:
28.3% (34)Missouri:
15.0% (386,162)
7:30 a.m. to 7:59 a.m.: Armstrong:
30.6% (37)Missouri:
13.6% (350,191)
8:00 a.m. to 8:29 a.m.: Armstrong:
1.7% (2)Missouri:
10.2% (263,069)
9:00 a.m. to 9:59 a.m.: Armstrong:
0.8% (1)Missouri:
5.3% (135,238)
10:00 a.m. to 10:59 a.m.: Armstrong:
1.7% (2)Missouri:
2.6% (66,859)
12:00 p.m. to 3:59 p.m.: Armstrong:
7.0% (8)Missouri:
6.7% (172,065)
<5am: Armstrong:
2.8% (3)Missouri:
3.3% (87,470)
6:30am: Armstrong:
10.3% (11)Missouri:
9.2% (240,618)
7am: Armstrong:
21.5% (23)Missouri:
11.1% (292,921)
7:30am: Armstrong:
11.2% (12)Missouri:
15.0% (393,152)
8am: Armstrong:
11.2% (12)Missouri:
16.0% (419,686)
8:30am: Armstrong:
8.4% (9)Missouri:
9.1% (239,288)
9am: Armstrong:
2.8% (3)Missouri:
4.1% (107,569)
11am: Armstrong:
1.9% (2)Missouri:
1.9% (49,720)
12pm: Armstrong:
3.7% (4)Missouri:
0.9% (23,241)
4pm: Armstrong:
13.1% (14)Missouri:
7.1% (187,847)
>4pm: Armstrong:
11.2% (12)Missouri:
7.1% (187,336)
5:00 a.m. to 5:29 a.m. - Males: Armstrong:
1.9% (1)Missouri:
5.1% (69,963)
5:30 a.m. to 5:59 a.m. - Males: Armstrong:
7.5% (4)Missouri:
6.3% (86,018)
6:00 a.m. to 6:29 a.m. - Males: Armstrong:
1.9% (1)Missouri:
11.0% (150,105)
6:30 a.m. to 6:59 a.m. - Males: Armstrong:
25.5% (13)Missouri:
11.6% (157,905)
7:00 a.m. to 7:29 a.m. - Males: Armstrong:
37.4% (19)Missouri:
14.1% (192,593)
7:30 a.m. to 7:59 a.m. - Males: Armstrong:
3.7% (2)Missouri:
11.4% (155,925)
8:00 a.m. to 8:29 a.m. - Males: Armstrong:
3.9% (2)Missouri:
9.3% (126,252)
9:00 a.m. to 9:59 a.m. - Males: Armstrong:
2.0% (1)Missouri:
4.7% (63,451)
12:00 p.m. to 3:59 p.m. - Males: Armstrong:
16.4% (9)Missouri:
6.7% (91,701)
12:00 a.m. to 4:59 a.m. - Females: Armstrong:
15.9% (11)Missouri:
3.9% (47,643)
5:30 a.m. to 5:59 a.m. - Females: Armstrong:
8.3% (6)Missouri:
3.9% (47,790)
6:30 a.m. to 6:59 a.m. - Females: Armstrong:
1.4% (1)Missouri:
9.8% (118,836)
7:00 a.m. to 7:29 a.m. - Females: Armstrong:
21.4% (15)Missouri:
16.0% (193,569)
7:30 a.m. to 7:59 a.m. - Females: Armstrong:
51.2% (35)Missouri:
16.0% (194,266)
10:00 a.m. to 10:59 a.m. - Females: Armstrong:
2.9% (2)Missouri:
3.0% (36,372)
Travel time to work Percentage of workers working in this county: 59.3%
Less than 5 minutes: Armstrong:
9.3% (10)Missouri:
3.8% (99,335)
5 to 9 minutes: Armstrong:
10.3% (11)Missouri:
11.9% (312,582)
10 to 14 minutes: Armstrong:
9.3% (10)Missouri:
14.9% (390,913)
15 to 19 minutes: Armstrong:
13.1% (14)Missouri:
15.3% (403,273)
20 to 24 minutes: Armstrong:
14.0% (15)Missouri:
14.2% (373,125)
30 to 34 minutes: Armstrong:
15.0% (16)Missouri:
13.0% (341,771)
40 to 44 minutes: Armstrong:
6.5% (7)Missouri:
3.0% (80,060)
45 to 59 minutes: Armstrong:
12.1% (13)Missouri:
6.4% (169,018)
60 to 89 minutes: Armstrong:
5.6% (6)Missouri:
3.4% (88,471)
90 or more minutes: Armstrong:
2.8% (3)Missouri:
2.0% (53,675)
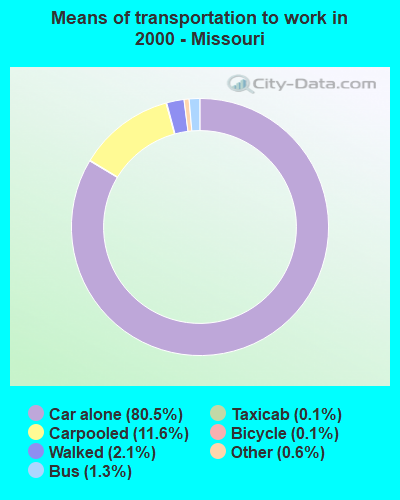
Means of transportation to work Drove car alone: Armstrong:
81.3% (87)Missouri:
80.5% (2,116,096)
Carpooled: Armstrong:
12.1% (13)Missouri:
11.6% (306,179)
Walked: Armstrong:
4.7% (5)Missouri:
2.1% (55,631)
Private vehicle occupancy Drove alone: Armstrong:
96.4% (113)Missouri:
90.5% (2,229,200)
In 2 person carpool: Armstrong:
2.6% (3)Missouri:
7.4% (182,593)
In 4 person carpool: Armstrong:
0.8% (1)Missouri:
0.4% (10,413)
Drove alone: Armstrong:
87.0% (87)Missouri:
87.4% (2,116,096)
In 2 person carpool: Armstrong:
11.0% (11)Missouri:
10.3% (249,420)
In 3 person carpool: Armstrong:
2.0% (2)Missouri:
1.5% (36,828)
Class of workers
Employee of private company: Armstrong:
74.8% (96)Missouri:
67.6% (2,018,769)
Self-employed in own incorporated business: Armstrong:
1.6% (2)Missouri:
3.4% (102,264)
Private not-for-profit wage and salary workers: Armstrong:
7.9% (10)Missouri:
10.2% (306,001)
Local government workers: Armstrong:
11.8% (15)Missouri:
6.7% (200,319)
State government workers: Armstrong:
0.8% (1)Missouri:
3.6% (106,233)
Federal government workers: Armstrong:
0.8% (1)Missouri:
2.6% (78,354)
Self-employed workers in own not incorporated business: Armstrong:
2.4% (3)Missouri:
5.7% (170,561)
Employee of private company: Armstrong:
68.2% (73)Missouri:
68.3% (1,816,616)
Self-employed in own incorporated business: Armstrong:
1.9% (2)Missouri:
2.8% (75,124)
Private not-for-profit wage and salary workers: Armstrong:
9.3% (10)Missouri:
8.8% (234,943)
Local government workers: Armstrong:
12.1% (13)Missouri:
5.5% (144,964)
State government workers: Armstrong:
2.8% (3)Missouri:
4.8% (127,063)
Self-employed workers in own not incorporated business: Armstrong:
5.6% (6)Missouri:
6.9% (182,699)
Employee of private company - Males: Armstrong:
71.4% (40)Missouri:
71.9% (1,112,270)
Self-employed in own incorporated business - Males: Armstrong:
3.6% (2)Missouri:
4.3% (66,103)
Local government workers - Males: Armstrong:
17.9% (10)Missouri:
5.3% (82,254)
State government workers - Males: Armstrong:
1.8% (1)Missouri:
2.8% (42,837)
Self-employed workers in own not incorporated business - Males: Armstrong:
5.4% (3)Missouri:
6.6% (101,809)
Employee of private company - Females: Armstrong:
77.5% (56)Missouri:
63.0% (906,499)
Private not-for-profit wage and salary workers - Females: Armstrong:
14.1% (10)Missouri:
14.4% (207,158)
Local government workers - Females: Armstrong:
7.0% (5)Missouri:
8.2% (118,065)
Federal government workers - Females: Armstrong:
1.4% (1)Missouri:
2.6% (37,284)