Work and Jobs in Belen, New Mexico (NM) Detailed Stats
Occupations, Industries, Unemployment, Workers, Commute
Settings
X


Recent posts about work in Belen, New Mexico on our local forum with over 2,400,000 registered users:
 | Belen, NM (14 replies) |
| What areas of NM have a mild climate, not too hot, not too cold? (83 replies) |
| How much more will Los Lunas grow? (41 replies) |
| Live in Los Lunas, Work in Albuquerque? (18 replies) |
| Socorro, NM (205 replies) |
| Retiring to Silver City/Grant County NM or Pima County, AZ: Pros & Cons? (40 replies) |
Latest news about work in Belen, NM collected exclusively by city-data.com from local newspapers, TV, and radio stations
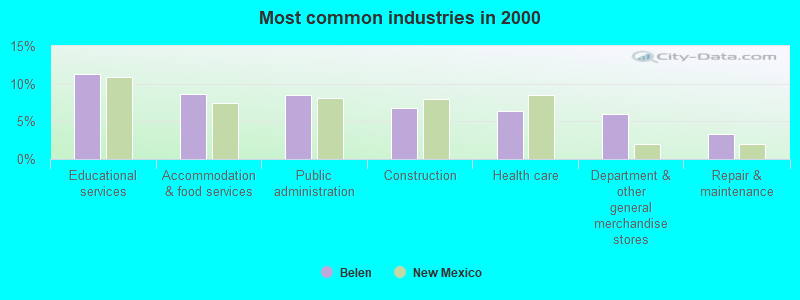
The most common industries in Belen are: Educational services (11.3% of civilian employees), Accommodation & food services (8.6% of civilian employees), Public administration (8.5% of civilian employees). 73.5% of workers work in Valencia County and 7.7% of all workers work at home. 58.3% of workers are employees of private companies, which is 2.0% greater than the rate of 57.1% across the entire state of New Mexico.
Whole page based on the data from 2000 / 2022 when the population of Belen, New Mexico was 6,901 / 7,508
Whole page based on the data from 2000 / 2022 when the population of Belen, New Mexico was 6,901 / 7,508
Most common industries
Most common industries | |||
|---|---|---|---|
Industry | All | Males | Females |
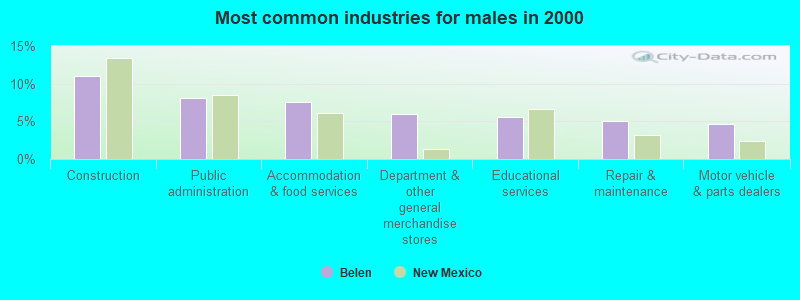
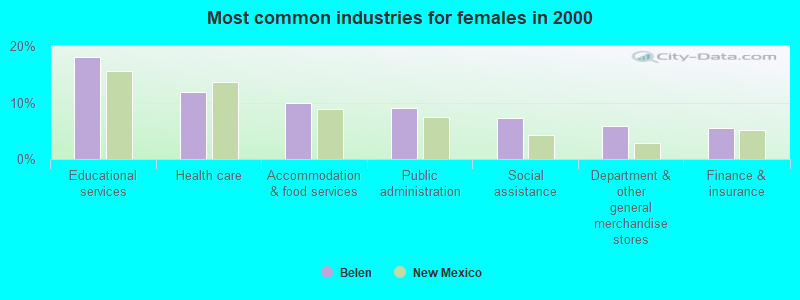
| Educational services | 11.3% (294) | 5.6% (78) | 18.0% (216) |
| Accommodation and food services | 8.6% (225) | 7.6% (106) | 9.9% (119) |
| Public administration | 8.5% (221) | 8.1% (113) | 9.0% (108) |
| Construction | 6.7% (175) | 11.0% (154) | 1.7% (21) |
| Health care | 6.4% (166) | 1.7% (24) | 11.8% (142) |
| Department and other general merchandise stores | 5.9% (154) | 5.9% (83) | 5.9% (71) |
| Repair and maintenance | 3.4% (88) | 5.1% (71) | 1.4% (17) |
| Social assistance | 3.4% (88) | 0.0% (0) | 7.3% (88) |
| Professional, scientific, and technical services | 3.4% (88) | 2.9% (40) | 4.0% (48) |
| Finance and insurance | 3.3% (87) | 1.5% (21) | 5.5% (66) |
| Motor vehicle and parts dealers | 3.1% (80) | 4.6% (65) | 1.2% (15) |
| Rail transportation | 2.7% (70) | 4.0% (56) | 1.2% (14) |
| Nonmetallic mineral products | 1.8% (48) | 2.9% (40) | 0.7% (8) |
| Chemicals | 1.7% (45) | 1.6% (23) | 1.8% (22) |
| Administrative and support and waste management services | 1.7% (44) | 2.5% (35) | 0.7% (9) |
| Real estate and rental and leasing | 1.7% (44) | 1.6% (23) | 1.7% (21) |
| Building material and garden equipment and supplies dealers | 1.7% (43) | 1.9% (26) | 1.4% (17) |
| Truck transportation | 1.7% (43) | 3.1% (43) | 0.0% (0) |
| Food and beverage stores | 1.6% (41) | 1.4% (19) | 1.8% (22) |
| Wood products | 1.5% (38) | 2.7% (38) | 0.0% (0) |
| Publishing, and motion picture and sound recording industries | 1.4% (36) | 1.5% (21) | 1.2% (15) |
| Other transportation, and support activities, and couriers | 1.2% (32) | 1.1% (15) | 1.4% (17) |
| Personal and laundry services | 1.2% (31) | 0.4% (6) | 2.1% (25) |
| Paper | 1.1% (28) | 1.6% (23) | 0.4% (5) |
| Arts, entertainment, and recreation | 1.1% (28) | 1.1% (16) | 1.0% (12) |
| Transportation equipment | 0.9% (24) | 1.7% (24) | 0.0% (0) |
| Religious, grantmaking, civic, professional, and similar organizations | 0.9% (24) | 1.1% (15) | 0.7% (9) |
| Private households | 0.8% (22) | 0.3% (4) | 1.5% (18) |
| Pharmacies and drug stores | 0.8% (20) | 0.0% (0) | 1.7% (20) |
| Used merchandise, gift, novelty, and souvenir, and other miscellaneous stores | 0.8% (20) | 1.4% (20) | 0.0% (0) |
| Metal and metal products | 0.7% (19) | 1.4% (19) | 0.0% (0) |
| Furniture and related product manufacturing | 0.7% (18) | 1.3% (18) | 0.0% (0) |
| Utilities | 0.6% (16) | 1.1% (16) | 0.0% (0) |
| Plastics and rubber products | 0.6% (16) | 1.1% (16) | 0.0% (0) |
| Furniture and home furnishings, and household appliance stores | 0.6% (16) | 0.6% (9) | 0.6% (7) |
| Lumber and other construction materials merchant wholesalers | 0.6% (16) | 1.1% (16) | 0.0% (0) |
| Computer and electronic products | 0.6% (15) | 0.4% (6) | 0.7% (9) |
| Broadcasting and telecommunications | 0.5% (14) | 0.0% (0) | 1.2% (14) |
| Mining, quarrying, and oil and gas extraction | 0.5% (13) | 0.9% (13) | 0.0% (0) |
| Gasoline stations | 0.5% (13) | 0.9% (13) | 0.0% (0) |
| Air transportation | 0.5% (12) | 0.4% (6) | 0.5% (6) |
| Radio, TV, and computer stores | 0.4% (11) | 0.0% (0) | 0.9% (11) |
| Paper and paper products merchant wholesalers | 0.4% (10) | 0.7% (10) | 0.0% (0) |
| Music stores | 0.4% (10) | 0.7% (10) | 0.0% (0) |
| Jewelry, luggage, and leather goods stores | 0.3% (9) | 0.6% (9) | 0.0% (0) |
| Beverage and tobacco products | 0.3% (8) | 0.6% (8) | 0.0% (0) |
| Miscellaneous nondurable goods merchant wholesalers | 0.3% (8) | 0.6% (8) | 0.0% (0) |
| Farm supplies merchant wholesalers | 0.3% (7) | 0.5% (7) | 0.0% (0) |
| Other direct selling establishments | 0.2% (6) | 0.0% (0) | 0.5% (6) |
| Furniture and home furnishing merchant wholesalers | 0.2% (6) | 0.4% (6) | 0.0% (0) |
| Miscellaneous manufacturing | 0.2% (5) | 0.4% (5) | 0.0% (0) |
| U. S. Postal service | 0.2% (5) | 0.4% (5) | 0.0% (0) |
| Clothing and accessories, including shoe, stores | 0.1% (3) | 0.0% (0) | 0.2% (3) |
Unemployment in Belen
- Unemployment by race in 2022
- Unemployment rate for White non-Hispanic residents
- 26.5%Males
- Unemployment rate for other race residents
- 13.4%Males
- Unemployment rate for two or more race residents
- 1.1%Females
- Unemployment rate for Hispanic or Latino residents
- 5.4%Males
- 1.6%Females
- Unemployment by race in 2000
- Unemployment rate for White non-Hispanic residents
- 4.0%Males
- 8.0%Females
- Unemployment rate for other race residents
- 14.1%Males
- 4.5%Females
- Unemployment rate for Hispanic or Latino residents
- 8.7%Males
- 9.4%Females
Time leaving home to go to work

12:00 a.m. to 4:59 a.m.:
| Belen: | 20.1% (533) |
| New Mexico: | 4.6% (38,210) |
5:00 a.m. to 5:29 a.m.:
| Belen: | 0.8% (21) |
| New Mexico: | 3.6% (30,094) |
5:30 a.m. to 5:59 a.m.:
| Belen: | 1.8% (47) |
| New Mexico: | 5.1% (41,811) |
6:00 a.m. to 6:29 a.m.:
| Belen: | 16.6% (438) |
| New Mexico: | 9.1% (74,992) |
6:30 a.m. to 6:59 a.m.:
| Belen: | 0.2% (6) |
| New Mexico: | 9.9% (81,934) |
7:00 a.m. to 7:29 a.m.:
| Belen: | 31.1% (823) |
| New Mexico: | 15.6% (129,058) |
7:30 a.m. to 7:59 a.m.:
| Belen: | 8.6% (228) |
| New Mexico: | 14.8% (121,786) |
8:00 a.m. to 8:29 a.m.:
| Belen: | 5.8% (153) |
| New Mexico: | 10.8% (89,083) |
8:30 a.m. to 8:59 a.m.:
| Belen: | 0.5% (13) |
| New Mexico: | 4.7% (39,064) |
9:00 a.m. to 9:59 a.m.:
| Belen: | 0.9% (23) |
| New Mexico: | 5.6% (46,001) |
10:00 a.m. to 10:59 a.m.:
| Belen: | 2.5% (67) |
| New Mexico: | 3.3% (26,972) |
11:00 a.m. to 11:59 a.m.:
| Belen: | 0.5% (13) |
| New Mexico: | 1.4% (11,540) |
12:00 p.m. to 3:59 p.m.:
| Belen: | 8.5% (225) |
| New Mexico: | 6.2% (50,927) |
4:00 p.m. to 11:59 p.m.:
| Belen: | 3.3% (88) |
| New Mexico: | 5.3% (43,945) |

<5am:
| Belen: | 5.4% (135) |
| New Mexico: | 2.8% (20,931) |
5:30am:
| Belen: | 4.6% (115) |
| New Mexico: | 2.4% (18,406) |
6am:
| Belen: | 4.0% (100) |
| New Mexico: | 3.7% (28,342) |
6:30am:
| Belen: | 9.0% (227) |
| New Mexico: | 7.4% (56,047) |
7am:
| Belen: | 10.2% (255) |
| New Mexico: | 10.5% (79,915) |
7:30am:
| Belen: | 11.9% (299) |
| New Mexico: | 15.0% (113,891) |
8am:
| Belen: | 15.1% (378) |
| New Mexico: | 18.4% (139,438) |
8:30am:
| Belen: | 8.5% (213) |
| New Mexico: | 10.3% (78,335) |
9am:
| Belen: | 3.7% (93) |
| New Mexico: | 4.5% (33,927) |
10am:
| Belen: | 4.8% (121) |
| New Mexico: | 5.4% (40,980) |
11am:
| Belen: | 2.5% (62) |
| New Mexico: | 2.3% (17,825) |
4pm:
| Belen: | 10.0% (252) |
| New Mexico: | 5.7% (43,093) |
>4pm:
| Belen: | 7.5% (188) |
| New Mexico: | 6.2% (47,115) |

12:00 a.m. to 4:59 a.m. - Males:
| Belen: | 26.9% (361) |
| New Mexico: | 5.7% (25,356) |
5:30 a.m. to 5:59 a.m. - Males:
| Belen: | 1.4% (19) |
| New Mexico: | 6.2% (27,894) |
6:00 a.m. to 6:29 a.m. - Males:
| Belen: | 27.6% (371) |
| New Mexico: | 10.8% (48,334) |
6:30 a.m. to 6:59 a.m. - Males:
| Belen: | 0.5% (6) |
| New Mexico: | 11.1% (49,662) |
7:00 a.m. to 7:29 a.m. - Males:
| Belen: | 22.0% (296) |
| New Mexico: | 14.3% (64,129) |
7:30 a.m. to 7:59 a.m. - Males:
| Belen: | 2.1% (28) |
| New Mexico: | 12.1% (54,167) |
8:00 a.m. to 8:29 a.m. - Males:
| Belen: | 6.5% (88) |
| New Mexico: | 10.6% (47,522) |
9:00 a.m. to 9:59 a.m. - Males:
| Belen: | 2.6% (35) |
| New Mexico: | 4.4% (19,843) |
10:00 a.m. to 10:59 a.m. - Males:
| Belen: | 2.9% (38) |
| New Mexico: | 3.3% (14,683) |
11:00 a.m. to 11:59 a.m. - Males:
| Belen: | 0.8% (10) |
| New Mexico: | 1.2% (5,506) |
12:00 p.m. to 3:59 p.m. - Males:
| Belen: | 11.2% (151) |
| New Mexico: | 5.4% (24,361) |
4:00 p.m. to 11:59 p.m. - Males:
| Belen: | 4.0% (53) |
| New Mexico: | 5.8% (26,034) |

12:00 a.m. to 4:59 a.m. - Females:
| Belen: | 13.2% (172) |
| New Mexico: | 3.4% (12,854) |
5:00 a.m. to 5:29 a.m. - Females:
| Belen: | 2.6% (33) |
| New Mexico: | 1.8% (6,893) |
5:30 a.m. to 5:59 a.m. - Females:
| Belen: | 0.9% (12) |
| New Mexico: | 3.7% (13,917) |
6:00 a.m. to 6:29 a.m. - Females:
| Belen: | 6.4% (83) |
| New Mexico: | 7.1% (26,658) |
7:00 a.m. to 7:29 a.m. - Females:
| Belen: | 40.3% (522) |
| New Mexico: | 17.2% (64,929) |
7:30 a.m. to 7:59 a.m. - Females:
| Belen: | 16.5% (214) |
| New Mexico: | 17.9% (67,619) |
8:00 a.m. to 8:29 a.m. - Females:
| Belen: | 16.9% (219) |
| New Mexico: | 11.0% (41,561) |
8:30 a.m. to 8:59 a.m. - Females:
| Belen: | 1.0% (14) |
| New Mexico: | 5.9% (22,363) |
10:00 a.m. to 10:59 a.m. - Females:
| Belen: | 2.3% (29) |
| New Mexico: | 3.3% (12,289) |
11:00 a.m. to 11:59 a.m. - Females:
| Belen: | 0.2% (3) |
| New Mexico: | 1.6% (6,034) |
12:00 p.m. to 3:59 p.m. - Females:
| Belen: | 6.1% (79) |
| New Mexico: | 7.0% (26,566) |
4:00 p.m. to 11:59 p.m. - Females:
| Belen: | 2.7% (36) |
| New Mexico: | 4.7% (17,911) |
Travel time to work
Percentage of workers working in this county: 73.5%
Number of people working at home: 206 (7.7% of all workers)
Daytime population change due to commuting: +2,255 (+32.7%)
Workers who live and work in this city: 1,121 (44.6%)
Number of people working at home: 206 (7.7% of all workers)
Daytime population change due to commuting: +2,255 (+32.7%)
Workers who live and work in this city: 1,121 (44.6%)

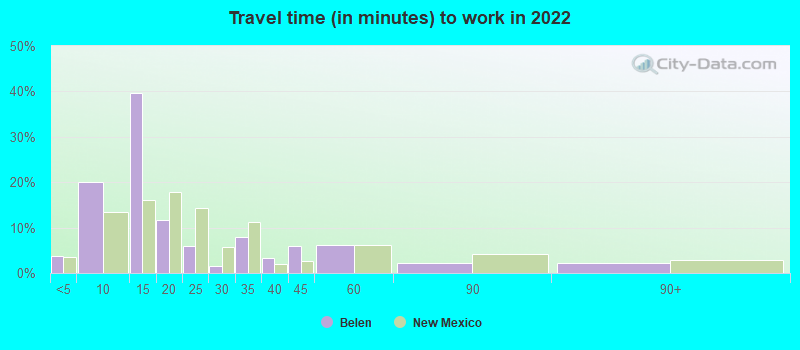

Less than 5 minutes:
| Belen: | 3.7% (130) |
| New Mexico: | 3.5% (28,492) |
5 to 9 minutes:
| Belen: | 20.0% (704) |
| New Mexico: | 13.5% (110,340) |
10 to 14 minutes:
| Belen: | 39.6% (1,392) |
| New Mexico: | 16.1% (131,475) |
15 to 19 minutes:
| Belen: | 11.7% (411) |
| New Mexico: | 17.9% (146,375) |
20 to 24 minutes:
| Belen: | 5.9% (208) |
| New Mexico: | 14.2% (116,550) |
25 to 29 minutes:
| Belen: | 1.5% (54) |
| New Mexico: | 5.8% (47,440) |
30 to 34 minutes:
| Belen: | 7.9% (276) |
| New Mexico: | 11.3% (92,333) |
35 to 39 minutes:
| Belen: | 3.3% (116) |
| New Mexico: | 2.0% (16,677) |
40 to 44 minutes:
| Belen: | 6.0% (210) |
| New Mexico: | 2.5% (20,787) |
45 to 59 minutes:
| Belen: | 6.1% (215) |
| New Mexico: | 6.1% (49,894) |
60 to 89 minutes:
| Belen: | 2.2% (77) |
| New Mexico: | 4.2% (34,415) |
90 or more minutes:
| Belen: | 2.2% (79) |
| New Mexico: | 3.0% (24,291) |


Less than 5 minutes:
| Belen: | 7.5% (188) |
| New Mexico: | 4.6% (34,755) |
5 to 9 minutes:
| Belen: | 22.2% (558) |
| New Mexico: | 13.9% (105,613) |
10 to 14 minutes:
| Belen: | 13.6% (342) |
| New Mexico: | 16.9% (128,524) |
15 to 19 minutes:
| Belen: | 13.7% (343) |
| New Mexico: | 16.8% (127,292) |
20 to 24 minutes:
| Belen: | 7.4% (187) |
| New Mexico: | 13.9% (105,552) |
25 to 29 minutes:
| Belen: | 2.0% (49) |
| New Mexico: | 4.6% (35,179) |
30 to 34 minutes:
| Belen: | 4.8% (120) |
| New Mexico: | 10.9% (83,054) |
35 to 39 minutes:
| Belen: | 3.0% (76) |
| New Mexico: | 1.6% (12,256) |
40 to 44 minutes:
| Belen: | 5.5% (139) |
| New Mexico: | 2.2% (16,472) |
45 to 59 minutes:
| Belen: | 13.1% (330) |
| New Mexico: | 5.1% (38,963) |
60 to 89 minutes:
| Belen: | 2.9% (72) |
| New Mexico: | 3.2% (24,038) |
90 or more minutes:
| Belen: | 1.4% (34) |
| New Mexico: | 2.0% (15,506) |

5 to 9 minutes - Males:
| Belen: | 9.6% (154) |
| New Mexico: | 12.0% (53,808) |
10 to 14 minutes - Males:
| Belen: | 62.0% (988) |
| New Mexico: | 14.8% (66,475) |
15 to 19 minutes - Males:
| Belen: | 6.2% (99) |
| New Mexico: | 18.5% (82,724) |
20 to 24 minutes - Males:
| Belen: | 7.2% (114) |
| New Mexico: | 14.4% (64,598) |
25 to 29 minutes - Males:
| Belen: | 2.2% (34) |
| New Mexico: | 5.5% (24,436) |
30 to 34 minutes - Males:
| Belen: | 7.3% (117) |
| New Mexico: | 11.5% (51,646) |
35 to 39 minutes - Males:
| Belen: | 7.0% (112) |
| New Mexico: | 2.2% (9,905) |
40 to 44 minutes - Males:
| Belen: | 3.6% (57) |
| New Mexico: | 2.8% (12,382) |
45 to 59 minutes - Males:
| Belen: | 4.9% (78) |
| New Mexico: | 6.6% (29,386) |
60 to 89 minutes - Males:
| Belen: | 2.7% (44) |
| New Mexico: | 4.7% (21,062) |
90 or more minutes - Males:
| Belen: | 4.1% (65) |
| New Mexico: | 3.7% (16,633) |

Less than 5 minutes - Females:
| Belen: | 5.9% (116) |
| New Mexico: | 3.6% (13,329) |
5 to 9 minutes - Females:
| Belen: | 29.1% (572) |
| New Mexico: | 15.2% (56,532) |
10 to 14 minutes - Females:
| Belen: | 21.3% (419) |
| New Mexico: | 17.5% (65,000) |
15 to 19 minutes - Females:
| Belen: | 15.6% (306) |
| New Mexico: | 17.2% (63,651) |
20 to 24 minutes - Females:
| Belen: | 4.8% (93) |
| New Mexico: | 14.0% (51,952) |
25 to 29 minutes - Females:
| Belen: | 0.5% (9) |
| New Mexico: | 6.2% (23,004) |
30 to 34 minutes - Females:
| Belen: | 8.8% (173) |
| New Mexico: | 11.0% (40,687) |
40 to 44 minutes - Females:
| Belen: | 2.4% (47) |
| New Mexico: | 2.3% (8,405) |
45 to 59 minutes - Females:
| Belen: | 6.9% (135) |
| New Mexico: | 5.5% (20,508) |
60 to 89 minutes - Females:
| Belen: | 1.7% (34) |
| New Mexico: | 3.6% (13,353) |
90 or more minutes - Females:
| Belen: | 0.7% (14) |
| New Mexico: | 2.1% (7,658) |
Means of transportation to work
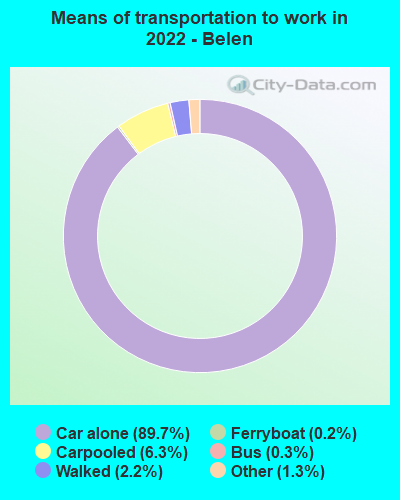
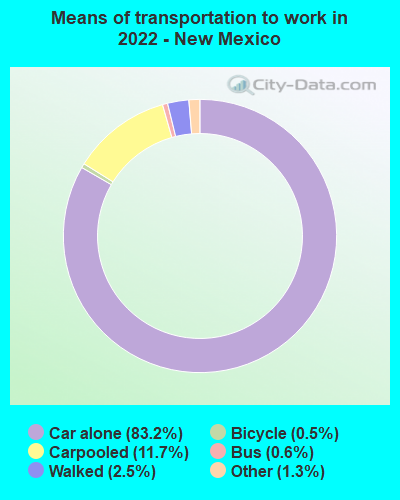
Drove car alone:
| Belen: | 89.7% (3,095) |
| New Mexico: | 83.2% (306,388) |
Carpooled:
| Belen: | 6.3% (217) |
| New Mexico: | 11.7% (48,679) |
Bus:
| Belen: | 0.3% (10) |
| New Mexico: | 0.6% (2,496) |
Ferryboat:
| Belen: | 0.2% (8) |
| New Mexico: | 0.0% (63) |
Walked:
| Belen: | 2.2% (75) |
| New Mexico: | 2.5% (7,580) |
Other means:
| Belen: | 1.3% (44) |
| New Mexico: | 1.3% (4,104) |

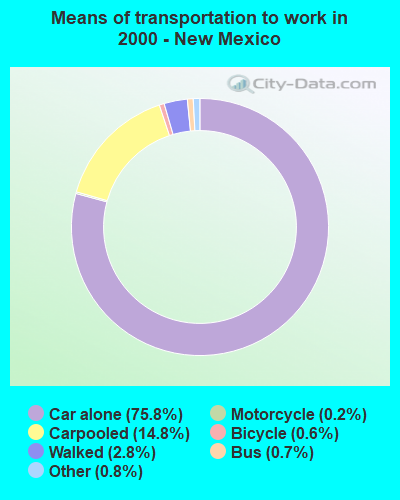
Drove car alone:
| Belen: | 80.0% (2,010) |
| New Mexico: | 75.8% (575,187) |
Carpooled:
| Belen: | 15.5% (390) |
| New Mexico: | 14.8% (112,489) |
Streetcar or trolley car:
| Belen: | 0.2% (5) |
| New Mexico: | 0.0% (138) |
Walked:
| Belen: | 0.4% (11) |
| New Mexico: | 2.8% (21,435) |
Other means:
| Belen: | 0.9% (22) |
| New Mexico: | 0.8% (6,202) |

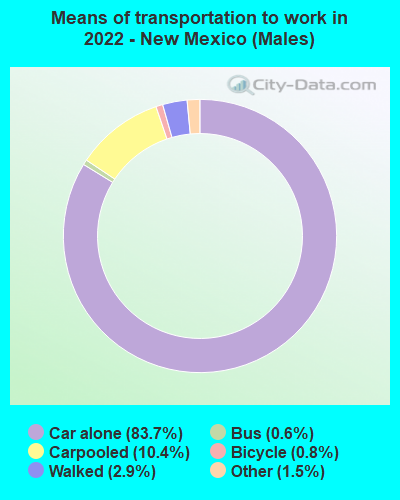
Drove car alone - Males:
| Belen: | 91.7% (1,603) |
| New Mexico: | 83.7% (306,388) |
Carpooled - Males:
| Belen: | 5.3% (93) |
| New Mexico: | 10.4% (48,679) |
Ferryboat - Males:
| Belen: | 0.5% (8) |
| New Mexico: | 0.0% (63) |
Other means - Males:
| Belen: | 2.5% (44) |
| New Mexico: | 1.5% (4,104) |

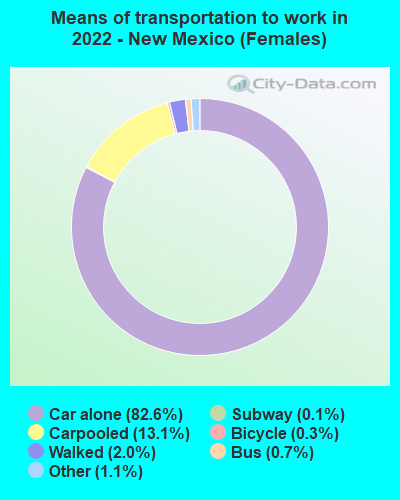
Drove car alone - Females:
| Belen: | 87.7% (1,492) |
| New Mexico: | 82.6% (306,388) |
Carpooled - Females:
| Belen: | 7.3% (124) |
| New Mexico: | 13.1% (48,679) |
Bus - Females:
| Belen: | 0.6% (10) |
| New Mexico: | 0.7% (2,496) |
Walked - Females:
| Belen: | 4.4% (75) |
| New Mexico: | 2.0% (7,580) |
Private vehicle occupancy

Drove alone:
| Belen: | 92.8% (2,055) |
| New Mexico: | 87.9% (687,338) |
In 2 person carpool:
| Belen: | 4.5% (99) |
| New Mexico: | 8.7% (68,297) |
In 3 person carpool:
| Belen: | 1.3% (29) |
| New Mexico: | 2.3% (17,742) |
In 5-6 person carpool:
| Belen: | 1.1% (24) |
| New Mexico: | 0.4% (2,922) |

Drove alone:
| Belen: | 83.8% (2,010) |
| New Mexico: | 83.6% (575,187) |
In 2 person carpool:
| Belen: | 14.1% (338) |
| New Mexico: | 12.3% (84,314) |
In 3 person carpool:
| Belen: | 1.7% (41) |
| New Mexico: | 2.5% (17,109) |
In 5-6 person carpool:
| Belen: | 0.5% (11) |
| New Mexico: | 0.4% (2,603) |
Class of workers

Employee of private company:
| Belen: | 58.3% (1,739) |
| New Mexico: | 57.1% (535,323) |
Self-employed in own incorporated business:
| Belen: | 1.3% (38) |
| New Mexico: | 3.2% (30,246) |
Private not-for-profit wage and salary workers:
| Belen: | 1.8% (53) |
| New Mexico: | 8.2% (77,259) |
Local government workers:
| Belen: | 11.2% (333) |
| New Mexico: | 9.1% (85,345) |
State government workers:
| Belen: | 17.9% (533) |
| New Mexico: | 7.1% (66,149) |
Federal government workers:
| Belen: | 4.3% (128) |
| New Mexico: | 7.6% (71,182) |
Self-employed workers in own not incorporated business:
| Belen: | 5.3% (158) |
| New Mexico: | 7.3% (68,193) |

Employee of private company:
| Belen: | 66.0% (1,719) |
| New Mexico: | 58.3% (444,948) |
Self-employed in own incorporated business:
| Belen: | 1.3% (34) |
| New Mexico: | 3.4% (25,839) |
Private not-for-profit wage and salary workers:
| Belen: | 3.9% (101) |
| New Mexico: | 6.8% (51,679) |
Local government workers:
| Belen: | 9.0% (234) |
| New Mexico: | 7.6% (58,106) |
State government workers:
| Belen: | 10.3% (268) |
| New Mexico: | 8.5% (64,737) |
Federal government workers:
| Belen: | 2.5% (64) |
| New Mexico: | 6.6% (50,346) |
Self-employed workers in own not incorporated business:
| Belen: | 6.1% (160) |
| New Mexico: | 8.4% (64,108) |
Unpaid family workers:
| Belen: | 0.9% (23) |
| New Mexico: | 0.4% (3,353) |

Employee of private company - Males:
| Belen: | 71.3% (990) |
| New Mexico: | 60.1% (293,772) |
Self-employed in own incorporated business - Males:
| Belen: | 2.7% (38) |
| New Mexico: | 4.0% (19,526) |
Private not-for-profit wage and salary workers - Males:
| Belen: | 0.9% (12) |
| New Mexico: | 5.4% (26,442) |
Local government workers - Males:
| Belen: | 6.1% (85) |
| New Mexico: | 7.5% (36,775) |
State government workers - Males:
| Belen: | 10.1% (140) |
| New Mexico: | 5.6% (27,614) |
Federal government workers - Males:
| Belen: | 1.0% (13) |
| New Mexico: | 9.1% (44,462) |
Self-employed workers in own not incorporated business - Males:
| Belen: | 7.8% (109) |
| New Mexico: | 7.9% (38,542) |

Employee of private company - Females:
| Belen: | 47.0% (749) |
| New Mexico: | 53.9% (241,551) |
Private not-for-profit wage and salary workers - Females:
| Belen: | 2.5% (40) |
| New Mexico: | 11.3% (50,817) |
Local government workers - Females:
| Belen: | 15.6% (248) |
| New Mexico: | 10.8% (48,570) |
State government workers - Females:
| Belen: | 24.6% (393) |
| New Mexico: | 8.6% (38,535) |
Federal government workers - Females:
| Belen: | 7.2% (115) |
| New Mexico: | 6.0% (26,720) |
Self-employed workers in own not incorporated business - Females:
| Belen: | 3.1% (49) |
| New Mexico: | 6.6% (29,651) |