Work and Jobs in Bethesda, Maryland (MD) Detailed Stats
Occupations, Industries, Unemployment, Workers, Commute
Settings
X


Recent posts about work in Bethesda, Maryland on our local forum with over 2,400,000 registered users:
 | Income tax on 90K/yr salary - Bethesda, Northern Virginia, DC? (6 replies) |
| Bethesda’s median income is lowest in District 1 (1 reply) |
| New job in Bethesda (apartment search) (0 replies) |
| Job Offer in Montgomery County (12 replies) |
| Where to Live? Work in Bethesda, husband in DC (2 replies) |
| If working in Bethesda where in MD/VA/DC would you live? (11 replies) |
Latest news about work in Bethesda, MD collected exclusively by city-data.com from local newspapers, TV, and radio stations
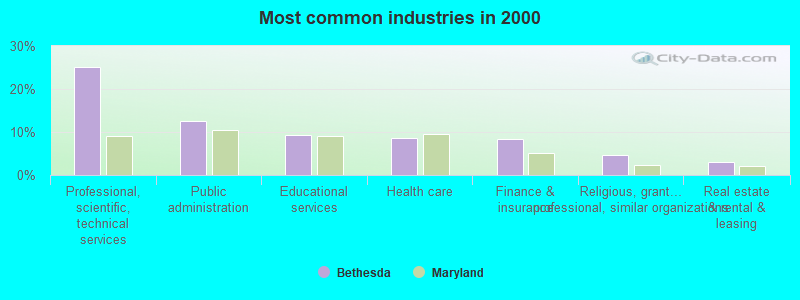
The most common industries in Bethesda are: Professional, scientific, technical services (25.1% of civilian employees), Public administration (12.5% of civilian employees), Educational services (9.4% of civilian employees). 71.5% of workers work in Montgomery County and 31.3% of all workers work at home. 43.0% of workers are employees of private companies, which is 34.8% less than the rate of 57.9% across the entire state of Maryland.
Whole page based on the data from 2000 / 2022 when the population of Bethesda, Maryland was 55,277 / 68,522
Whole page based on the data from 2000 / 2022 when the population of Bethesda, Maryland was 55,277 / 68,522
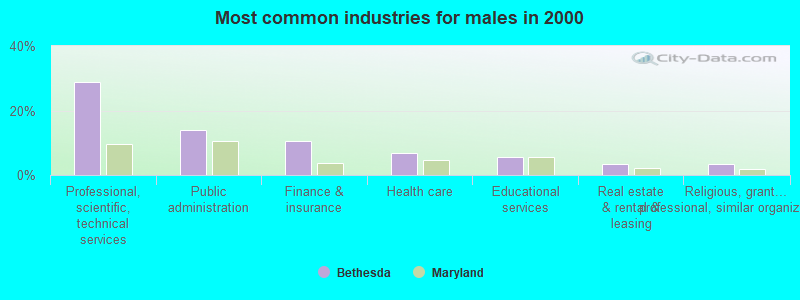
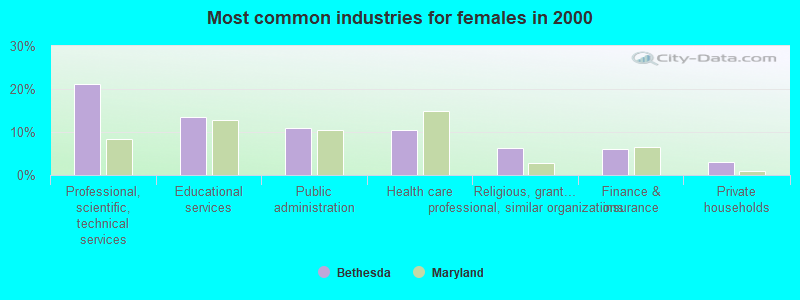
Most common industries
Most common industries | |||
|---|---|---|---|
Industry | All | Males | Females |
| Professional, scientific, and technical services | 25.1% (7,331) | 28.8% (4,311) | 21.2% (3,020) |
| Public administration | 12.5% (3,643) | 14.0% (2,102) | 10.8% (1,541) |
| Educational services | 9.4% (2,744) | 5.5% (824) | 13.5% (1,920) |
| Health care | 8.6% (2,517) | 6.9% (1,034) | 10.4% (1,483) |
| Finance and insurance | 8.3% (2,436) | 10.5% (1,571) | 6.1% (865) |
| Religious, grantmaking, civic, professional, and similar organizations | 4.8% (1,392) | 3.4% (511) | 6.2% (881) |
| Real estate and rental and leasing | 3.0% (890) | 3.6% (533) | 2.5% (357) |
| Broadcasting and telecommunications | 2.9% (849) | 3.3% (497) | 2.5% (352) |
| Data processing, libraries, and other information services | 2.5% (737) | 2.9% (441) | 2.1% (296) |
| Accommodation and food services | 2.3% (662) | 2.0% (302) | 2.5% (360) |
| Publishing, and motion picture and sound recording industries | 2.0% (587) | 1.7% (255) | 2.3% (332) |
| Arts, entertainment, and recreation | 2.0% (579) | 1.3% (202) | 2.6% (377) |
| Construction | 1.8% (540) | 3.2% (482) | 0.4% (58) |
| Private households | 1.5% (448) | 0.1% (8) | 3.1% (440) |
| Administrative and support and waste management services | 1.5% (424) | 1.3% (197) | 1.6% (227) |
| Social assistance | 1.2% (351) | 0.2% (31) | 2.2% (320) |
| Radio, TV, and computer stores | 0.8% (240) | 1.2% (175) | 0.5% (65) |
| Food and beverage stores | 0.8% (226) | 0.9% (134) | 0.6% (92) |
| Personal and laundry services | 0.7% (195) | 0.3% (47) | 1.0% (148) |
| Computer and electronic products | 0.6% (170) | 0.9% (132) | 0.3% (38) |
| Clothing and accessories, including shoe, stores | 0.6% (169) | 0.3% (40) | 0.9% (129) |
| Department and other general merchandise stores | 0.5% (156) | 0.2% (37) | 0.8% (119) |
| Miscellaneous manufacturing | 0.5% (152) | 0.7% (104) | 0.3% (48) |
| Motor vehicle and parts dealers | 0.5% (144) | 0.8% (115) | 0.2% (29) |
| Pharmacies and drug stores | 0.4% (120) | 0.5% (69) | 0.4% (51) |
| Air transportation | 0.4% (105) | 0.4% (57) | 0.3% (48) |
| Other direct selling establishments | 0.3% (89) | 0.2% (28) | 0.4% (61) |
| Used merchandise, gift, novelty, and souvenir, and other miscellaneous stores | 0.3% (85) | 0.2% (35) | 0.4% (50) |
| Health and personal care, except drug, stores | 0.3% (85) | 0.1% (14) | 0.5% (71) |
| Other transportation, and support activities, and couriers | 0.3% (82) | 0.4% (57) | 0.2% (25) |
| Furniture and home furnishings, and household appliance stores | 0.3% (74) | 0.0% (0) | 0.5% (74) |
| Repair and maintenance | 0.2% (68) | 0.3% (52) | 0.1% (16) |
| Electronic shopping and mail-order houses | 0.2% (67) | 0.2% (26) | 0.3% (41) |
| Building material and garden equipment and supplies dealers | 0.2% (59) | 0.4% (59) | 0.0% (0) |
| Professional and commercial equipment and supplies merchant wholesalers | 0.2% (57) | 0.3% (51) | 0.0% (6) |
| U. S. Postal service | 0.2% (53) | 0.2% (34) | 0.1% (19) |
| Utilities | 0.2% (49) | 0.1% (16) | 0.2% (33) |
| Sporting goods, camera, and hobby and toy stores | 0.2% (46) | 0.2% (34) | 0.1% (12) |
| Book stores and news dealers | 0.2% (45) | 0.2% (27) | 0.1% (18) |
| Chemicals | 0.1% (43) | 0.1% (16) | 0.2% (27) |
| Printing and related support activities | 0.1% (42) | 0.2% (33) | 0.1% (9) |
| Transportation equipment | 0.1% (38) | 0.2% (27) | 0.1% (11) |
| Rail transportation | 0.1% (34) | 0.2% (25) | 0.1% (9) |
| Machinery, equipment, and supplies merchant wholesalers | 0.1% (34) | 0.1% (11) | 0.2% (23) |
| Machinery | 0.1% (31) | 0.2% (25) | 0.0% (6) |
| Agriculture, forestry, fishing and hunting | 0.1% (29) | 0.1% (17) | 0.1% (12) |
| Management of companies and enterprises | 0.1% (28) | 0.2% (28) | 0.0% (0) |
| Music stores | 0.1% (17) | 0.1% (17) | 0.0% (0) |
Unemployment in Bethesda
- Unemployment by race in 2022
- Unemployment rate for White non-Hispanic residents
- 0.8%Males
- 2.8%Females
- Unemployment rate for Black residents
- 8.4%Males
- 3.2%Females
- Unemployment rate for Asian residents
- 2.3%Males
- 4.0%Females
- Unemployment rate for other race residents
- 20.1%Females
- Unemployment rate for two or more race residents
- 0.7%Males
- 3.1%Females
- Unemployment rate for Hispanic or Latino residents
- 1.4%Males
- 7.6%Females
- Unemployment by race in 2000
- Unemployment rate for White non-Hispanic residents
- 1.2%Males
- 2.2%Females
- Unemployment rate for Black residents
- 4.7%Males
- 4.4%Females
- Unemployment rate for Asian residents
- 3.1%Males
- 8.2%Females
- Unemployment rate for other race residents
- 2.8%Females
- Unemployment rate for two or more race residents
- 4.6%Females
- Unemployment rate for Hispanic or Latino residents
- 1.4%Males
- 1.9%Females
Time leaving home to go to work

12:00 a.m. to 4:59 a.m.:
| Bethesda: | 2.0% (426) |
| Maryland: | 5.4% (137,252) |
5:00 a.m. to 5:29 a.m.:
| Bethesda: | 2.3% (490) |
| Maryland: | 4.4% (112,169) |
5:30 a.m. to 5:59 a.m.:
| Bethesda: | 1.5% (319) |
| Maryland: | 4.8% (121,529) |
6:00 a.m. to 6:29 a.m.:
| Bethesda: | 4.7% (1,011) |
| Maryland: | 9.1% (231,673) |
6:30 a.m. to 6:59 a.m.:
| Bethesda: | 2.5% (553) |
| Maryland: | 8.3% (211,777) |
7:00 a.m. to 7:29 a.m.:
| Bethesda: | 11.9% (2,589) |
| Maryland: | 14.3% (362,787) |
7:30 a.m. to 7:59 a.m.:
| Bethesda: | 10.5% (2,290) |
| Maryland: | 10.9% (277,831) |
8:00 a.m. to 8:29 a.m.:
| Bethesda: | 19.8% (4,292) |
| Maryland: | 12.2% (310,633) |
8:30 a.m. to 8:59 a.m.:
| Bethesda: | 14.9% (3,225) |
| Maryland: | 6.2% (157,490) |
9:00 a.m. to 9:59 a.m.:
| Bethesda: | 19.0% (4,125) |
| Maryland: | 8.0% (204,415) |
10:00 a.m. to 10:59 a.m.:
| Bethesda: | 3.0% (646) |
| Maryland: | 3.0% (77,287) |
11:00 a.m. to 11:59 a.m.:
| Bethesda: | 0.9% (205) |
| Maryland: | 1.6% (40,296) |
12:00 p.m. to 3:59 p.m.:
| Bethesda: | 5.7% (1,232) |
| Maryland: | 6.3% (159,318) |
4:00 p.m. to 11:59 p.m.:
| Bethesda: | 1.4% (307) |
| Maryland: | 5.3% (135,542) |

<5am:
| Bethesda: | 0.7% (197) |
| Maryland: | 3.0% (77,561) |
5:30am:
| Bethesda: | 0.6% (165) |
| Maryland: | 3.2% (81,972) |
6am:
| Bethesda: | 1.0% (294) |
| Maryland: | 4.7% (120,768) |
6:30am:
| Bethesda: | 2.7% (792) |
| Maryland: | 9.1% (235,203) |
7am:
| Bethesda: | 4.8% (1,414) |
| Maryland: | 10.3% (267,702) |
7:30am:
| Bethesda: | 12.8% (3,760) |
| Maryland: | 14.9% (386,941) |
8am:
| Bethesda: | 18.5% (5,442) |
| Maryland: | 14.3% (370,838) |
8:30am:
| Bethesda: | 21.6% (6,351) |
| Maryland: | 11.6% (300,061) |
9am:
| Bethesda: | 12.7% (3,748) |
| Maryland: | 6.0% (154,337) |
10am:
| Bethesda: | 9.7% (2,867) |
| Maryland: | 5.9% (151,747) |
11am:
| Bethesda: | 2.1% (624) |
| Maryland: | 2.2% (56,218) |
12pm:
| Bethesda: | 0.9% (267) |
| Maryland: | 1.0% (26,260) |
4pm:
| Bethesda: | 2.1% (633) |
| Maryland: | 5.3% (136,187) |
>4pm:
| Bethesda: | 1.9% (550) |
| Maryland: | 5.4% (139,172) |

12:00 a.m. to 4:59 a.m. - Males:
| Bethesda: | 2.8% (305) |
| Maryland: | 7.5% (99,701) |
5:00 a.m. to 5:29 a.m. - Males:
| Bethesda: | 1.4% (146) |
| Maryland: | 5.9% (79,059) |
5:30 a.m. to 5:59 a.m. - Males:
| Bethesda: | 1.6% (171) |
| Maryland: | 5.9% (79,436) |
6:00 a.m. to 6:29 a.m. - Males:
| Bethesda: | 6.4% (689) |
| Maryland: | 10.9% (145,135) |
6:30 a.m. to 6:59 a.m. - Males:
| Bethesda: | 3.9% (417) |
| Maryland: | 8.3% (110,674) |
7:00 a.m. to 7:29 a.m. - Males:
| Bethesda: | 10.5% (1,138) |
| Maryland: | 13.0% (173,935) |
7:30 a.m. to 7:59 a.m. - Males:
| Bethesda: | 8.6% (925) |
| Maryland: | 9.1% (121,963) |
8:00 a.m. to 8:29 a.m. - Males:
| Bethesda: | 19.8% (2,136) |
| Maryland: | 11.3% (150,709) |
8:30 a.m. to 8:59 a.m. - Males:
| Bethesda: | 17.3% (1,872) |
| Maryland: | 4.7% (62,260) |
9:00 a.m. to 9:59 a.m. - Males:
| Bethesda: | 14.9% (1,605) |
| Maryland: | 7.6% (101,199) |
10:00 a.m. to 10:59 a.m. - Males:
| Bethesda: | 5.5% (597) |
| Maryland: | 2.7% (35,582) |
11:00 a.m. to 11:59 a.m. - Males:
| Bethesda: | 0.8% (84) |
| Maryland: | 1.6% (20,846) |
12:00 p.m. to 3:59 p.m. - Males:
| Bethesda: | 3.8% (414) |
| Maryland: | 6.5% (86,966) |
4:00 p.m. to 11:59 p.m. - Males:
| Bethesda: | 2.8% (307) |
| Maryland: | 5.1% (68,188) |

12:00 a.m. to 4:59 a.m. - Females:
| Bethesda: | 1.1% (121) |
| Maryland: | 3.1% (37,551) |
5:00 a.m. to 5:29 a.m. - Females:
| Bethesda: | 3.2% (344) |
| Maryland: | 2.7% (33,110) |
5:30 a.m. to 5:59 a.m. - Females:
| Bethesda: | 1.4% (148) |
| Maryland: | 3.5% (42,093) |
6:00 a.m. to 6:29 a.m. - Females:
| Bethesda: | 3.0% (322) |
| Maryland: | 7.2% (86,538) |
6:30 a.m. to 6:59 a.m. - Females:
| Bethesda: | 1.2% (136) |
| Maryland: | 8.4% (101,103) |
7:00 a.m. to 7:29 a.m. - Females:
| Bethesda: | 13.3% (1,451) |
| Maryland: | 15.7% (188,852) |
7:30 a.m. to 7:59 a.m. - Females:
| Bethesda: | 12.5% (1,365) |
| Maryland: | 12.9% (155,868) |
8:00 a.m. to 8:29 a.m. - Females:
| Bethesda: | 19.8% (2,156) |
| Maryland: | 13.3% (159,924) |
8:30 a.m. to 8:59 a.m. - Females:
| Bethesda: | 12.4% (1,353) |
| Maryland: | 7.9% (95,230) |
9:00 a.m. to 9:59 a.m. - Females:
| Bethesda: | 23.1% (2,520) |
| Maryland: | 8.6% (103,216) |
10:00 a.m. to 10:59 a.m. - Females:
| Bethesda: | 0.4% (49) |
| Maryland: | 3.5% (41,705) |
11:00 a.m. to 11:59 a.m. - Females:
| Bethesda: | 1.1% (121) |
| Maryland: | 1.6% (19,450) |
12:00 p.m. to 3:59 p.m. - Females:
| Bethesda: | 7.5% (818) |
| Maryland: | 6.0% (72,352) |
Travel time to work
Percentage of workers working in this county: 71.5%
Number of people working at home: 10,783 (31.3% of all workers)
Daytime population change due to commuting: +38,222 (+69.1%)
Workers who live and work in this place: 8,170 (27.7%)
Number of people working at home: 10,783 (31.3% of all workers)
Daytime population change due to commuting: +38,222 (+69.1%)
Workers who live and work in this place: 8,170 (27.7%)

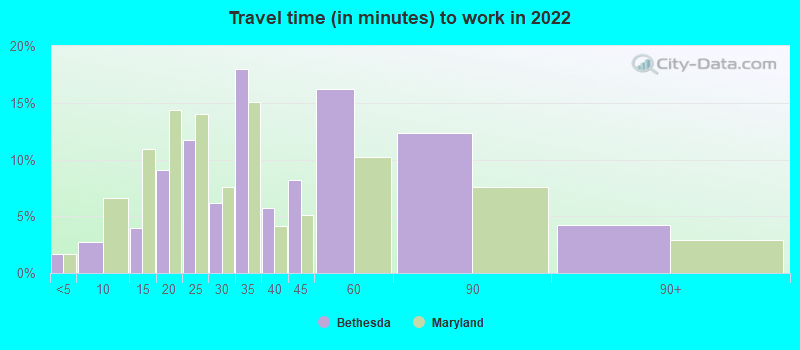

Less than 5 minutes:
| Bethesda: | 1.6% (1,042) |
| Maryland: | 1.6% (38,588) |
5 to 9 minutes:
| Bethesda: | 2.8% (1,771) |
| Maryland: | 6.6% (154,245) |
10 to 14 minutes:
| Bethesda: | 3.9% (2,514) |
| Maryland: | 10.9% (256,336) |
15 to 19 minutes:
| Bethesda: | 9.1% (5,800) |
| Maryland: | 14.3% (336,664) |
20 to 24 minutes:
| Bethesda: | 11.7% (7,492) |
| Maryland: | 14.0% (328,151) |
25 to 29 minutes:
| Bethesda: | 6.2% (3,947) |
| Maryland: | 7.5% (176,932) |
30 to 34 minutes:
| Bethesda: | 18.0% (11,462) |
| Maryland: | 15.1% (354,486) |
35 to 39 minutes:
| Bethesda: | 5.7% (3,633) |
| Maryland: | 4.1% (97,042) |
40 to 44 minutes:
| Bethesda: | 8.2% (5,237) |
| Maryland: | 5.1% (120,795) |
45 to 59 minutes:
| Bethesda: | 16.2% (10,327) |
| Maryland: | 10.2% (239,287) |
60 to 89 minutes:
| Bethesda: | 12.4% (7,893) |
| Maryland: | 7.6% (177,217) |
90 or more minutes:
| Bethesda: | 4.3% (2,726) |
| Maryland: | 2.9% (67,235) |


Less than 5 minutes:
| Bethesda: | 1.2% (354) |
| Maryland: | 1.8% (47,843) |
5 to 9 minutes:
| Bethesda: | 6.6% (1,939) |
| Maryland: | 6.6% (169,884) |
10 to 14 minutes:
| Bethesda: | 10.7% (3,141) |
| Maryland: | 10.5% (271,204) |
15 to 19 minutes:
| Bethesda: | 10.5% (3,101) |
| Maryland: | 12.4% (320,679) |
20 to 24 minutes:
| Bethesda: | 10.8% (3,186) |
| Maryland: | 13.0% (337,452) |
25 to 29 minutes:
| Bethesda: | 7.9% (2,329) |
| Maryland: | 6.1% (158,702) |
30 to 34 minutes:
| Bethesda: | 14.9% (4,394) |
| Maryland: | 14.5% (375,140) |
35 to 39 minutes:
| Bethesda: | 5.1% (1,501) |
| Maryland: | 3.5% (91,893) |
40 to 44 minutes:
| Bethesda: | 7.3% (2,161) |
| Maryland: | 4.8% (123,823) |
45 to 59 minutes:
| Bethesda: | 12.6% (3,708) |
| Maryland: | 11.3% (291,586) |
60 to 89 minutes:
| Bethesda: | 3.3% (982) |
| Maryland: | 8.6% (223,613) |
90 or more minutes:
| Bethesda: | 1.0% (308) |
| Maryland: | 3.6% (93,148) |

Less than 5 minutes - Males:
| Bethesda: | 1.2% (390) |
| Maryland: | 1.6% (19,958) |
5 to 9 minutes - Males:
| Bethesda: | 3.7% (1,164) |
| Maryland: | 5.7% (70,480) |
10 to 14 minutes - Males:
| Bethesda: | 4.1% (1,287) |
| Maryland: | 9.7% (119,610) |
15 to 19 minutes - Males:
| Bethesda: | 7.9% (2,495) |
| Maryland: | 13.5% (165,180) |
20 to 24 minutes - Males:
| Bethesda: | 9.3% (2,942) |
| Maryland: | 12.9% (158,234) |
25 to 29 minutes - Males:
| Bethesda: | 5.4% (1,719) |
| Maryland: | 7.3% (89,960) |
30 to 34 minutes - Males:
| Bethesda: | 18.8% (5,955) |
| Maryland: | 15.5% (190,098) |
35 to 39 minutes - Males:
| Bethesda: | 5.0% (1,572) |
| Maryland: | 4.2% (51,709) |
40 to 44 minutes - Males:
| Bethesda: | 10.0% (3,164) |
| Maryland: | 5.3% (64,804) |
45 to 59 minutes - Males:
| Bethesda: | 16.4% (5,191) |
| Maryland: | 11.2% (137,043) |
60 to 89 minutes - Males:
| Bethesda: | 14.1% (4,473) |
| Maryland: | 9.4% (115,540) |
90 or more minutes - Males:
| Bethesda: | 4.3% (1,356) |
| Maryland: | 3.6% (44,173) |

Less than 5 minutes - Females:
| Bethesda: | 2.0% (652) |
| Maryland: | 1.7% (18,630) |
5 to 9 minutes - Females:
| Bethesda: | 1.9% (607) |
| Maryland: | 7.5% (83,765) |
10 to 14 minutes - Females:
| Bethesda: | 3.8% (1,227) |
| Maryland: | 12.2% (136,726) |
15 to 19 minutes - Females:
| Bethesda: | 10.3% (3,305) |
| Maryland: | 15.3% (171,484) |
20 to 24 minutes - Females:
| Bethesda: | 14.2% (4,550) |
| Maryland: | 15.2% (169,917) |
25 to 29 minutes - Females:
| Bethesda: | 6.9% (2,228) |
| Maryland: | 7.8% (86,972) |
30 to 34 minutes - Females:
| Bethesda: | 17.1% (5,507) |
| Maryland: | 14.7% (164,388) |
35 to 39 minutes - Females:
| Bethesda: | 6.4% (2,061) |
| Maryland: | 4.0% (45,333) |
40 to 44 minutes - Females:
| Bethesda: | 6.5% (2,073) |
| Maryland: | 5.0% (55,991) |
45 to 59 minutes - Females:
| Bethesda: | 16.0% (5,136) |
| Maryland: | 9.1% (102,244) |
60 to 89 minutes - Females:
| Bethesda: | 10.6% (3,420) |
| Maryland: | 5.5% (61,677) |
90 or more minutes - Females:
| Bethesda: | 4.3% (1,370) |
| Maryland: | 2.1% (23,062) |
Means of transportation to work
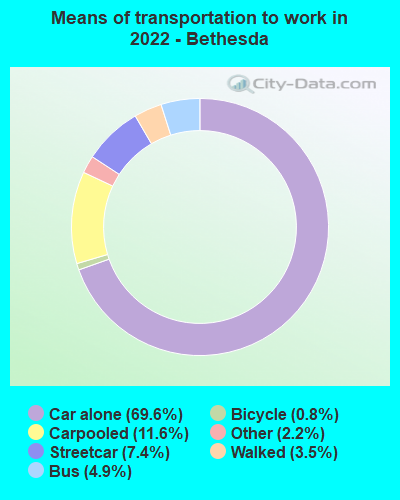
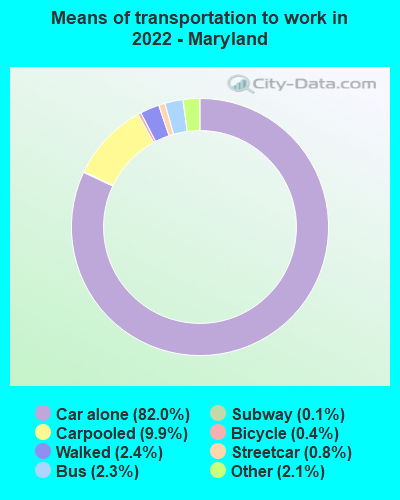
Drove car alone:
| Bethesda: | 69.6% (44,431) |
| Maryland: | 82.0% (909,901) |
Carpooled:
| Bethesda: | 11.6% (7,437) |
| Maryland: | 9.9% (115,593) |
Bus:
| Bethesda: | 4.9% (3,110) |
| Maryland: | 2.3% (31,481) |
Subway or elevated rail:
| Bethesda: | 7.4% (4,706) |
| Maryland: | 0.8% (9,810) |
Long-distance train or commuter rail:
| Bethesda: | 0.0% (29) |
| Maryland: | 0.1% (683) |
Bicycle:
| Bethesda: | 0.8% (482) |
| Maryland: | 0.4% (2,237) |
Walked:
| Bethesda: | 3.5% (2,216) |
| Maryland: | 2.4% (24,631) |
Other means:
| Bethesda: | 2.2% (1,433) |
| Maryland: | 2.1% (25,384) |


Drove car alone:
| Bethesda: | 60.9% (17,943) |
| Maryland: | 73.7% (1,910,917) |
Carpooled:
| Bethesda: | 8.7% (2,550) |
| Maryland: | 12.4% (320,992) |
Bus or trolley bus:
| Bethesda: | 1.7% (513) |
| Maryland: | 3.6% (93,111) |
Streetcar or trolley car:
| Bethesda: | 0.0% (5) |
| Maryland: | 0.1% (1,619) |
Subway or elevated:
| Bethesda: | 12.8% (3,762) |
| Maryland: | 2.9% (75,090) |
Railroad:
| Bethesda: | 0.1% (24) |
| Maryland: | 0.4% (10,568) |
Taxicab:
| Bethesda: | 0.1% (30) |
| Maryland: | 0.3% (6,714) |
Motorcycle:
| Bethesda: | 0.1% (31) |
| Maryland: | 0.1% (1,496) |
Bicycle:
| Bethesda: | 1.0% (303) |
| Maryland: | 0.2% (4,843) |
Walked:
| Bethesda: | 6.0% (1,764) |
| Maryland: | 2.5% (64,852) |
Other means:
| Bethesda: | 0.6% (179) |
| Maryland: | 0.6% (14,621) |

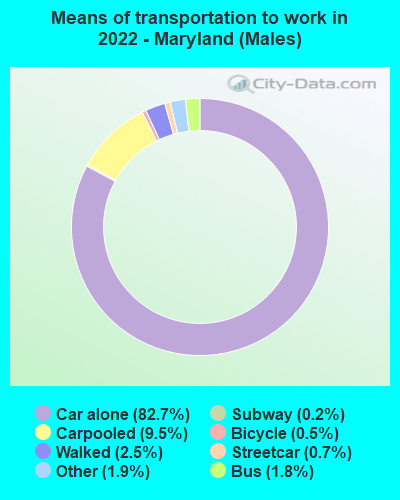
Drove car alone - Males:
| Bethesda: | 70.7% (22,414) |
| Maryland: | 82.7% (909,901) |
Carpooled - Males:
| Bethesda: | 10.8% (3,436) |
| Maryland: | 9.5% (115,593) |
Bus - Males:
| Bethesda: | 3.5% (1,096) |
| Maryland: | 1.8% (31,481) |
Subway or elevated rail - Males:
| Bethesda: | 6.6% (2,096) |
| Maryland: | 0.7% (9,810) |
Bicycle - Males:
| Bethesda: | 1.5% (464) |
| Maryland: | 0.5% (2,237) |
Walked - Males:
| Bethesda: | 3.7% (1,173) |
| Maryland: | 2.5% (24,631) |
Other means - Males:
| Bethesda: | 3.2% (1,029) |
| Maryland: | 1.9% (25,384) |

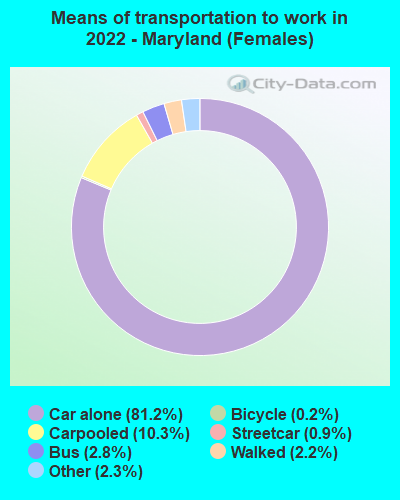
Drove car alone - Females:
| Bethesda: | 68.5% (22,017) |
| Maryland: | 81.2% (909,901) |
Carpooled - Females:
| Bethesda: | 12.5% (4,001) |
| Maryland: | 10.3% (115,593) |
Bus - Females:
| Bethesda: | 6.3% (2,014) |
| Maryland: | 2.8% (31,481) |
Subway or elevated rail - Females:
| Bethesda: | 8.1% (2,610) |
| Maryland: | 0.9% (9,810) |
Long-distance train or commuter rail - Females:
| Bethesda: | 0.1% (29) |
| Maryland: | 0.1% (683) |
Bicycle - Females:
| Bethesda: | 0.1% (18) |
| Maryland: | 0.2% (2,237) |
Walked - Females:
| Bethesda: | 3.2% (1,043) |
| Maryland: | 2.2% (24,631) |
Other means - Females:
| Bethesda: | 1.3% (404) |
| Maryland: | 2.3% (25,384) |
Private vehicle occupancy

Drove alone:
| Bethesda: | 91.7% (14,552) |
| Maryland: | 89.2% (2,046,832) |
In 2 person carpool:
| Bethesda: | 5.4% (859) |
| Maryland: | 8.2% (188,419) |
In 3 person carpool:
| Bethesda: | 1.7% (271) |
| Maryland: | 1.6% (36,765) |
In 4 person carpool:
| Bethesda: | 0.5% (77) |
| Maryland: | 0.5% (11,805) |
In 5-6 person carpool:
| Bethesda: | 0.3% (49) |
| Maryland: | 0.4% (8,574) |

Drove alone:
| Bethesda: | 87.6% (17,943) |
| Maryland: | 85.6% (1,910,917) |
In 2 person carpool:
| Bethesda: | 10.6% (2,166) |
| Maryland: | 11.2% (249,591) |
In 3 person carpool:
| Bethesda: | 1.2% (251) |
| Maryland: | 1.9% (43,068) |
In 4 person carpool:
| Bethesda: | 0.6% (125) |
| Maryland: | 0.7% (15,540) |
In 7+ person carpool:
| Bethesda: | 0.0% (8) |
| Maryland: | 0.3% (6,020) |
Class of workers

Employee of private company:
| Bethesda: | 43.0% (15,037) |
| Maryland: | 57.9% (1,834,766) |
Self-employed in own incorporated business:
| Bethesda: | 5.1% (1,773) |
| Maryland: | 3.6% (114,186) |
Private not-for-profit wage and salary workers:
| Bethesda: | 16.7% (5,848) |
| Maryland: | 10.1% (321,165) |
Local government workers:
| Bethesda: | 2.9% (1,031) |
| Maryland: | 7.7% (243,652) |
State government workers:
| Bethesda: | 3.7% (1,307) |
| Maryland: | 4.5% (142,830) |
Federal government workers:
| Bethesda: | 21.4% (7,500) |
| Maryland: | 10.5% (333,930) |
Self-employed workers in own not incorporated business:
| Bethesda: | 6.8% (2,368) |
| Maryland: | 5.4% (171,588) |
Unpaid family workers:
| Bethesda: | 0.4% (139) |
| Maryland: | 0.2% (6,301) |

Employee of private company:
| Bethesda: | 45.8% (13,393) |
| Maryland: | 60.5% (1,579,238) |
Self-employed in own incorporated business:
| Bethesda: | 5.2% (1,509) |
| Maryland: | 3.2% (82,204) |
Private not-for-profit wage and salary workers:
| Bethesda: | 14.3% (4,196) |
| Maryland: | 8.4% (219,162) |
Local government workers:
| Bethesda: | 3.6% (1,047) |
| Maryland: | 7.9% (204,895) |
State government workers:
| Bethesda: | 1.7% (490) |
| Maryland: | 4.4% (114,670) |
Federal government workers:
| Bethesda: | 19.9% (5,830) |
| Maryland: | 10.0% (262,046) |
Self-employed workers in own not incorporated business:
| Bethesda: | 9.3% (2,706) |
| Maryland: | 5.4% (140,769) |
Unpaid family workers:
| Bethesda: | 0.2% (70) |
| Maryland: | 0.2% (5,473) |

Employee of private company - Males:
| Bethesda: | 49.9% (8,807) |
| Maryland: | 62.1% (1,004,780) |
Self-employed in own incorporated business - Males:
| Bethesda: | 6.5% (1,145) |
| Maryland: | 4.6% (73,780) |
Private not-for-profit wage and salary workers - Males:
| Bethesda: | 13.8% (2,433) |
| Maryland: | 7.2% (115,680) |
Local government workers - Males:
| Bethesda: | 1.5% (272) |
| Maryland: | 5.3% (85,832) |
State government workers - Males:
| Bethesda: | 2.3% (408) |
| Maryland: | 3.8% (61,646) |
Federal government workers - Males:
| Bethesda: | 18.4% (3,245) |
| Maryland: | 10.8% (174,115) |
Self-employed workers in own not incorporated business - Males:
| Bethesda: | 7.6% (1,335) |
| Maryland: | 6.0% (97,677) |

Employee of private company - Females:
| Bethesda: | 35.9% (6,230) |
| Maryland: | 53.5% (829,986) |
Self-employed in own incorporated business - Females:
| Bethesda: | 3.6% (628) |
| Maryland: | 2.6% (40,406) |
Private not-for-profit wage and salary workers - Females:
| Bethesda: | 19.7% (3,415) |
| Maryland: | 13.2% (205,485) |
Local government workers - Females:
| Bethesda: | 4.4% (759) |
| Maryland: | 10.2% (157,820) |
State government workers - Females:
| Bethesda: | 5.2% (899) |
| Maryland: | 5.2% (81,184) |
Federal government workers - Females:
| Bethesda: | 24.5% (4,255) |
| Maryland: | 10.3% (159,815) |
Self-employed workers in own not incorporated business - Females:
| Bethesda: | 6.0% (1,033) |
| Maryland: | 4.8% (73,911) |
Unpaid family workers - Females:
| Bethesda: | 0.8% (139) |
| Maryland: | 0.2% (2,803) |