Work and Jobs in Bodega Bay, California (CA) Detailed Stats
Occupations, Industries, Unemployment, Workers, Commute
Settings
X


Recent posts about work in Bodega Bay, California on our local forum with over 2,400,000 registered users:

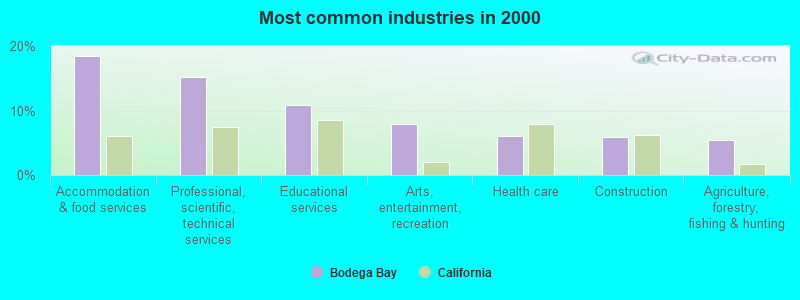
The most common industries in Bodega Bay are: Accommodation & food services (18.5% of civilian employees), Professional, scientific, technical services (15.1% of civilian employees), Educational services (10.8% of civilian employees). 100.0% of workers work in Sonoma County and 23.4% of all workers work at home. 71.3% of workers are employees of private companies, which is 6.7% greater than the rate of 66.5% across the entire state of California.
Whole page based on the data from 2000 / 2022 when the population of Bodega Bay, California was 1,423 / 1,172
Whole page based on the data from 2000 / 2022 when the population of Bodega Bay, California was 1,423 / 1,172
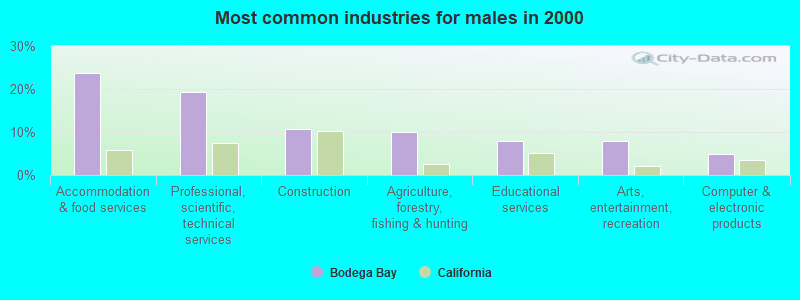
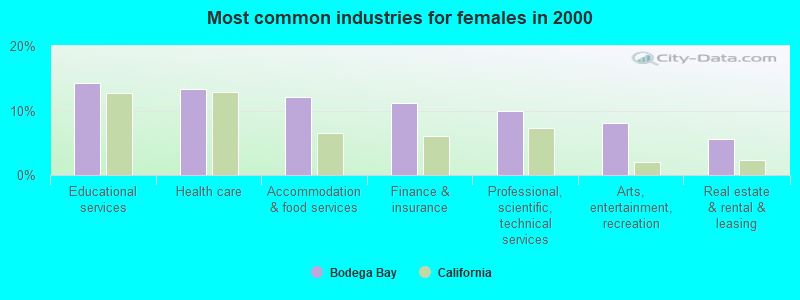
Most common industries
Most common industries | |||
|---|---|---|---|
Industry | All | Males | Females |
| Accommodation and food services | 18.5% (132) | 23.7% (93) | 12.1% (39) |
| Professional, scientific, and technical services | 15.1% (108) | 19.3% (76) | 10.0% (32) |
| Educational services | 10.8% (77) | 7.9% (31) | 14.3% (46) |
| Arts, entertainment, and recreation | 8.0% (57) | 7.9% (31) | 8.1% (26) |
| Health care | 6.0% (43) | 0.0% (0) | 13.4% (43) |
| Construction | 5.9% (42) | 10.7% (42) | 0.0% (0) |
| Agriculture, forestry, fishing and hunting | 5.5% (39) | 9.9% (39) | 0.0% (0) |
| Finance and insurance | 5.0% (36) | 0.0% (0) | 11.2% (36) |
| Computer and electronic products | 4.1% (29) | 4.8% (19) | 3.1% (10) |
| Motor vehicle and parts dealers | 3.6% (26) | 2.5% (10) | 5.0% (16) |
| Real estate and rental and leasing | 2.5% (18) | 0.0% (0) | 5.6% (18) |
| Administrative and support and waste management services | 1.8% (13) | 1.3% (5) | 2.5% (8) |
| Furniture and home furnishings, and household appliance stores | 1.5% (11) | 2.8% (11) | 0.0% (0) |
| Public administration | 1.5% (11) | 2.8% (11) | 0.0% (0) |
| Department and other general merchandise stores | 1.4% (10) | 0.0% (0) | 3.1% (10) |
| Publishing, and motion picture and sound recording industries | 1.4% (10) | 0.0% (0) | 3.1% (10) |
| Broadcasting and telecommunications | 1.4% (10) | 2.5% (10) | 0.0% (0) |
| Personal and laundry services | 1.4% (10) | 0.0% (0) | 3.1% (10) |
| Groceries and related products merchant wholesalers | 1.3% (9) | 0.0% (0) | 2.8% (9) |
| Book stores and news dealers | 1.1% (8) | 0.0% (0) | 2.5% (8) |
| Repair and maintenance | 1.1% (8) | 2.0% (8) | 0.0% (0) |
| Water transportation | 1.0% (7) | 1.8% (7) | 0.0% (0) |
Unemployment in Bodega Bay
- Unemployment by race in 2022
- Unemployment rate for White non-Hispanic residents
- 15.5%Males
- 10.0%Females
- Unemployment rate for other race residents
- 31.3%Males
- Unemployment rate for Hispanic or Latino residents
- 31.9%Males
- Unemployment by race in 2000
- Unemployment rate for White non-Hispanic residents
- 3.1%Males
- 3.3%Females
Time leaving home to go to work

5:30 a.m. to 5:59 a.m.:
| Bodega Bay: | 2.4% (9) |
| California: | 4.3% (665,475) |
6:00 a.m. to 6:29 a.m.:
| Bodega Bay: | 21.3% (82) |
| California: | 8.3% (1,273,588) |
6:30 a.m. to 6:59 a.m.:
| Bodega Bay: | 15.3% (59) |
| California: | 7.5% (1,156,338) |
7:00 a.m. to 7:29 a.m.:
| Bodega Bay: | 28.0% (108) |
| California: | 13.2% (2,027,702) |
8:00 a.m. to 8:29 a.m.:
| Bodega Bay: | 9.6% (37) |
| California: | 12.7% (1,953,986) |
8:30 a.m. to 8:59 a.m.:
| Bodega Bay: | 6.6% (25) |
| California: | 5.8% (890,950) |
11:00 a.m. to 11:59 a.m.:
| Bodega Bay: | 12.1% (47) |
| California: | 1.8% (280,975) |
12:00 p.m. to 3:59 p.m.:
| Bodega Bay: | 2.9% (11) |
| California: | 7.0% (1,075,505) |
4:00 p.m. to 11:59 p.m.:
| Bodega Bay: | 2.7% (10) |
| California: | 5.8% (891,240) |

<5am:
| Bodega Bay: | 1.5% (11) |
| California: | 4.2% (606,086) |
5:30am:
| Bodega Bay: | 1.4% (10) |
| California: | 3.6% (523,209) |
6am:
| Bodega Bay: | 0.6% (4) |
| California: | 4.8% (692,256) |
6:30am:
| Bodega Bay: | 11.6% (83) |
| California: | 8.4% (1,216,867) |
7am:
| Bodega Bay: | 5.2% (37) |
| California: | 9.4% (1,362,830) |
7:30am:
| Bodega Bay: | 10.9% (78) |
| California: | 13.8% (2,006,950) |
8am:
| Bodega Bay: | 10.4% (74) |
| California: | 13.7% (1,986,831) |
8:30am:
| Bodega Bay: | 9.9% (71) |
| California: | 10.9% (1,577,815) |
9am:
| Bodega Bay: | 10.4% (74) |
| California: | 5.4% (778,152) |
10am:
| Bodega Bay: | 6.3% (45) |
| California: | 6.7% (972,355) |
11am:
| Bodega Bay: | 2.7% (19) |
| California: | 2.9% (414,479) |
12pm:
| Bodega Bay: | 1.3% (9) |
| California: | 1.3% (189,005) |
4pm:
| Bodega Bay: | 10.4% (74) |
| California: | 6.0% (865,284) |
>4pm:
| Bodega Bay: | 2.9% (21) |
| California: | 5.3% (776,167) |

5:30 a.m. to 5:59 a.m. - Males:
| Bodega Bay: | 3.7% (9) |
| California: | 5.2% (448,269) |
6:00 a.m. to 6:29 a.m. - Males:
| Bodega Bay: | 17.4% (40) |
| California: | 9.8% (842,941) |
6:30 a.m. to 6:59 a.m. - Males:
| Bodega Bay: | 24.1% (56) |
| California: | 7.7% (657,557) |
7:00 a.m. to 7:29 a.m. - Males:
| Bodega Bay: | 47.3% (109) |
| California: | 12.4% (1,058,532) |
4:00 p.m. to 11:59 p.m. - Males:
| Bodega Bay: | 4.2% (10) |
| California: | 5.8% (499,471) |

6:00 a.m. to 6:29 a.m. - Females:
| Bodega Bay: | 26.6% (41) |
| California: | 6.3% (430,647) |
8:00 a.m. to 8:29 a.m. - Females:
| Bodega Bay: | 24.5% (38) |
| California: | 14.1% (969,448) |
8:30 a.m. to 8:59 a.m. - Females:
| Bodega Bay: | 16.4% (25) |
| California: | 6.9% (476,135) |
11:00 a.m. to 11:59 a.m. - Females:
| Bodega Bay: | 30.5% (48) |
| California: | 2.0% (139,355) |
12:00 p.m. to 3:59 p.m. - Females:
| Bodega Bay: | 7.0% (11) |
| California: | 7.0% (480,658) |
Travel time to work
Percentage of workers working in this county: 100.0%
Number of people working at home: 120 (23.4% of all workers)
Number of people working at home: 120 (23.4% of all workers)


Less than 5 minutes:
| Bodega Bay: | 5.5% (39) |
| California: | 2.2% (324,703) |
5 to 9 minutes:
| Bodega Bay: | 21.3% (152) |
| California: | 8.8% (1,280,443) |
10 to 14 minutes:
| Bodega Bay: | 10.6% (76) |
| California: | 13.3% (1,930,263) |
15 to 19 minutes:
| Bodega Bay: | 6.7% (48) |
| California: | 14.9% (2,157,970) |
20 to 24 minutes:
| Bodega Bay: | 6.3% (45) |
| California: | 13.8% (2,004,060) |
25 to 29 minutes:
| Bodega Bay: | 2.2% (16) |
| California: | 5.4% (782,241) |
30 to 34 minutes:
| Bodega Bay: | 13.4% (96) |
| California: | 13.9% (2,025,657) |
40 to 44 minutes:
| Bodega Bay: | 2.5% (18) |
| California: | 3.6% (528,043) |
45 to 59 minutes:
| Bodega Bay: | 5.6% (40) |
| California: | 7.9% (1,151,598) |
60 to 89 minutes:
| Bodega Bay: | 5.6% (40) |
| California: | 6.4% (933,123) |
90 or more minutes:
| Bodega Bay: | 5.6% (40) |
| California: | 3.3% (483,698) |
Means of transportation to work


Drove car alone:
| Bodega Bay: | 52.5% (375) |
| California: | 71.8% (10,432,462) |
Carpooled:
| Bodega Bay: | 22.4% (160) |
| California: | 14.5% (2,113,313) |
Bicycle:
| Bodega Bay: | 1.5% (11) |
| California: | 0.8% (120,567) |
Walked:
| Bodega Bay: | 7.7% (55) |
| California: | 2.9% (414,581) |
Other means:
| Bodega Bay: | 1.3% (9) |
| California: | 0.8% (115,064) |
Private vehicle occupancy

Drove alone:
| Bodega Bay: | 84.6% (253) |
| California: | 86.9% (12,187,486) |
In 7+ person carpool:
| Bodega Bay: | 15.4% (46) |
| California: | 0.2% (28,258) |

Drove alone:
| Bodega Bay: | 70.1% (375) |
| California: | 83.2% (10,432,462) |
In 2 person carpool:
| Bodega Bay: | 29.9% (160) |
| California: | 12.5% (1,564,905) |
Class of workers

Employee of private company:
| Bodega Bay: | 71.3% (386) |
| California: | 66.5% (12,596,030) |
Self-employed in own incorporated business:
| Bodega Bay: | 8.8% (48) |
| California: | 4.1% (784,709) |
Private not-for-profit wage and salary workers:
| Bodega Bay: | 11.2% (61) |
| California: | 7.5% (1,417,407) |
State government workers:
| Bodega Bay: | 2.2% (12) |
| California: | 4.1% (780,915) |
Federal government workers:
| Bodega Bay: | 6.4% (35) |
| California: | 2.0% (369,858) |

Employee of private company:
| Bodega Bay: | 50.1% (358) |
| California: | 68.0% (10,009,465) |
Self-employed in own incorporated business:
| Bodega Bay: | 3.2% (23) |
| California: | 2.7% (402,392) |
Private not-for-profit wage and salary workers:
| Bodega Bay: | 7.4% (53) |
| California: | 5.7% (845,536) |
Local government workers:
| Bodega Bay: | 5.0% (36) |
| California: | 8.3% (1,218,764) |
State government workers:
| Bodega Bay: | 5.9% (42) |
| California: | 4.0% (594,953) |
Self-employed workers in own not incorporated business:
| Bodega Bay: | 26.9% (192) |
| California: | 8.5% (1,249,530) |
Unpaid family workers:
| Bodega Bay: | 1.4% (10) |
| California: | 0.4% (53,934) |

Employee of private company - Males:
| Bodega Bay: | 78.9% (235) |
| California: | 70.3% (7,191,252) |
Self-employed in own incorporated business - Males:
| Bodega Bay: | 5.4% (16) |
| California: | 4.9% (504,764) |
State government workers - Males:
| Bodega Bay: | 4.0% (12) |
| California: | 3.4% (343,636) |
Federal government workers - Males:
| Bodega Bay: | 11.7% (35) |
| California: | 2.1% (209,874) |

Employee of private company - Females:
| Bodega Bay: | 61.9% (151) |
| California: | 62.0% (5,404,778) |
Self-employed in own incorporated business - Females:
| Bodega Bay: | 13.1% (32) |
| California: | 3.2% (279,945) |
Private not-for-profit wage and salary workers - Females:
| Bodega Bay: | 25.0% (61) |
| California: | 10.2% (888,285) |