Latest news about work in Brady, WA collected exclusively by city-data.com from local newspapers, TV, and radio stations
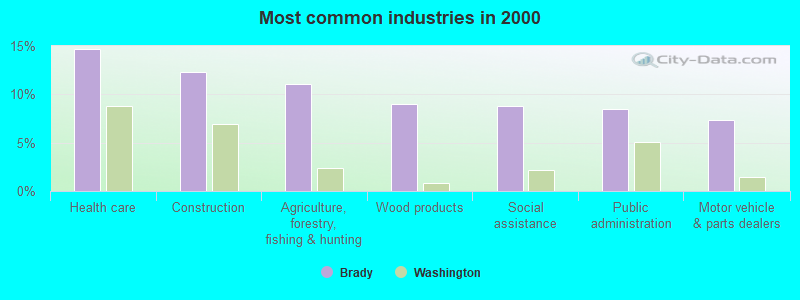
The most common industries in Brady are: Health care (14.7% of civilian employees), Construction (12.3% of civilian employees), Agriculture, forestry, fishing & hunting (11.1% of civilian employees). 63.5% of workers work in Grays Harbor County. 12.4% of workers are employees of private companies, which is 432.3% less than the rate of 66.0% across the entire state of Washington.
Whole page based on the data from 2000 / 2022 when the population of Brady, Washington was 645 / 979
Most common industries
Most common industries
Industry
All
Males
Females
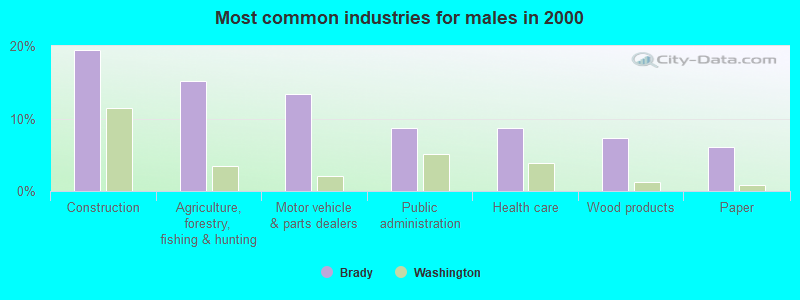
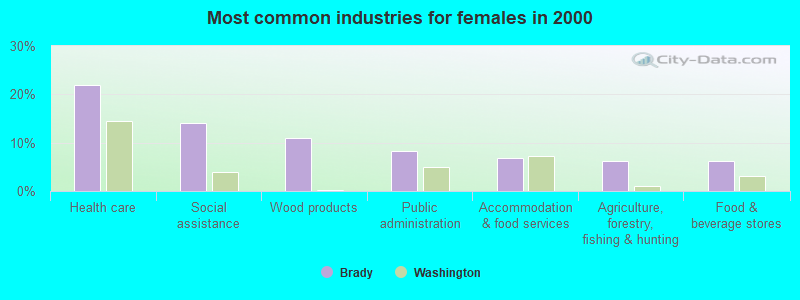
Health care
14.7% (62)
8.7% (20)
21.9% (42)
Construction
12.3% (52)
19.5% (45)
3.6% (7)
Agriculture, forestry, fishing and hunting
11.1% (47)
15.2% (35)
6.2% (12)
Wood products
9.0% (38)
7.4% (17)
10.9% (21)
Social assistance
8.7% (37)
4.3% (10)
14.1% (27)
Public administration
8.5% (36)
8.7% (20)
8.3% (16)
Motor vehicle and parts dealers
7.3% (31)
13.4% (31)
0.0% (0)
Paper
5.9% (25)
6.1% (14)
5.7% (11)
Food and beverage stores
5.2% (22)
4.3% (10)
6.2% (12)
Educational services
3.5% (15)
3.5% (8)
3.6% (7)
Accommodation and food services
3.1% (13)
0.0% (0)
6.8% (13)
Machinery
2.6% (11)
4.8% (11)
0.0% (0)
Pharmacies and drug stores
2.4% (10)
0.0% (0)
5.2% (10)
Utilities
2.4% (10)
4.3% (10)
0.0% (0)
Building material and garden equipment and supplies dealers
2.1% (9)
0.0% (0)
4.7% (9)
Personal and laundry services
1.2% (5)
0.0% (0)
2.6% (5)
Unemployment in Brady
Unemployment by race in 2022
Unemployment rate for White non-Hispanic residents
5.7%Males
Unemployment by race in 2000
Unemployment rate for White non-Hispanic residents
12.2%Males
12.7%Females
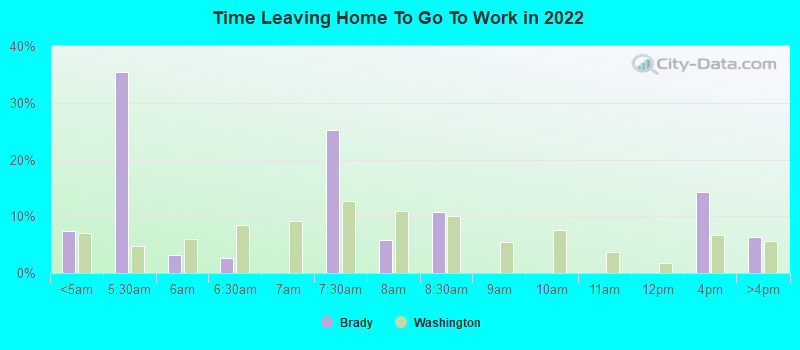
Time leaving home to go to work
12:00 a.m. to 4:59 a.m.:
Brady:
7.3% (20)
Washington:
7.0% (213,920)
5:00 a.m. to 5:29 a.m.:
Brady:
35.3% (95)
Washington:
4.8% (147,787)
5:30 a.m. to 5:59 a.m.:
Brady:
3.1% (8)
Washington:
6.1% (185,330)
6:00 a.m. to 6:29 a.m.:
Brady:
2.6% (7)
Washington:
8.4% (257,617)
7:00 a.m. to 7:29 a.m.:
Brady:
25.2% (67)
Washington:
12.7% (387,691)
7:30 a.m. to 7:59 a.m.:
Brady:
5.8% (16)
Washington:
11.0% (335,322)
8:00 a.m. to 8:29 a.m.:
Brady:
10.8% (29)
Washington:
10.0% (304,814)
12:00 p.m. to 3:59 p.m.:
Brady:
14.3% (38)
Washington:
6.7% (205,284)
4:00 p.m. to 11:59 p.m.:
Brady:
6.4% (17)
Washington:
5.7% (174,677)
<5am:
Brady:
2.5% (11)
Washington:
4.2% (115,997)
5:30am:
Brady:
5.6% (24)
Washington:
3.7% (102,868)
6am:
Brady:
7.4% (32)
Washington:
5.3% (147,812)
6:30am:
Brady:
8.6% (37)
Washington:
8.9% (248,462)
7am:
Brady:
14.4% (62)
Washington:
10.3% (288,005)
7:30am:
Brady:
6.5% (28)
Washington:
13.5% (375,030)
8am:
Brady:
10.6% (46)
Washington:
13.4% (372,576)
8:30am:
Brady:
14.6% (63)
Washington:
9.0% (252,058)
9am:
Brady:
8.3% (36)
Washington:
5.1% (141,936)
4pm:
Brady:
10.6% (46)
Washington:
6.8% (190,565)
>4pm:
Brady:
2.3% (10)
Washington:
5.8% (162,401)
12:00 a.m. to 4:59 a.m. - Males:
Brady:
14.9% (19)
Washington:
9.3% (158,516)
5:00 a.m. to 5:29 a.m. - Males:
Brady:
53.4% (69)
Washington:
6.5% (110,295)
6:00 a.m. to 6:29 a.m. - Males:
Brady:
7.1% (9)
Washington:
9.8% (166,050)
8:00 a.m. to 8:29 a.m. - Males:
Brady:
12.8% (17)
Washington:
8.8% (149,907)
4:00 p.m. to 11:59 p.m. - Males:
Brady:
16.7% (22)
Washington:
5.6% (95,440)
5:30 a.m. to 5:59 a.m. - Females:
Brady:
9.7% (13)
Washington:
4.8% (64,558)
7:00 a.m. to 7:29 a.m. - Females:
Brady:
49.5% (69)
Washington:
13.9% (188,971)
7:30 a.m. to 7:59 a.m. - Females:
Brady:
9.5% (13)
Washington:
12.7% (172,422)
8:00 a.m. to 8:29 a.m. - Females:
Brady:
9.1% (13)
Washington:
11.4% (154,907)
12:00 p.m. to 3:59 p.m. - Females:
Brady:
31.5% (44)
Washington:
6.6% (89,641)
Travel time to work
Percentage of workers working in this county: 63.5%
Less than 5 minutes:
Brady:
3.0% (13)
Washington:
3.3% (91,132)
5 to 9 minutes:
Brady:
17.1% (74)
Washington:
10.3% (286,517)
10 to 14 minutes:
Brady:
7.6% (33)
Washington:
14.1% (391,606)
15 to 19 minutes:
Brady:
17.8% (77)
Washington:
15.0% (418,990)
20 to 24 minutes:
Brady:
21.1% (91)
Washington:
14.2% (394,209)
25 to 29 minutes:
Brady:
6.7% (29)
Washington:
5.8% (162,590)
30 to 34 minutes:
Brady:
11.6% (50)
Washington:
12.5% (348,311)
45 to 59 minutes:
Brady:
3.9% (17)
Washington:
7.0% (195,343)
90 or more minutes:
Brady:
2.5% (11)
Washington:
2.7% (75,486)
Means of transportation to work
Drove car alone:
Brady:
82.9% (358)
Washington:
73.3% (2,040,833)
Carpooled:
Brady:
4.9% (21)
Washington:
12.8% (357,742)
Walked:
Brady:
3.7% (16)
Washington:
3.2% (89,739)
Private vehicle occupancy
Drove alone:
Brady:
96.7% (254)
Washington:
87.8% (2,415,775)
In 2 person carpool:
Brady:
3.1% (8)
Washington:
9.2% (252,715)
Drove alone:
Brady:
94.5% (358)
Washington:
85.1% (2,040,833)
In 2 person carpool:
Brady:
5.5% (21)
Washington:
11.8% (282,638)
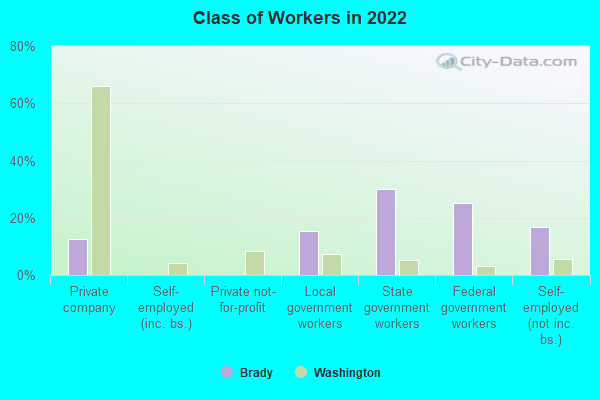
Class of workers
Employee of private company:
Brady:
12.4% (33)
Washington:
66.0% (2,552,907)
Local government workers:
Brady:
15.4% (41)
Washington:
7.3% (281,034)
State government workers:
Brady:
30.1% (81)
Washington:
5.2% (201,670)
Federal government workers:
Brady:
25.2% (68)
Washington:
3.1% (118,044)
Self-employed workers in own not incorporated business:
Brady:
16.9% (46)
Washington:
5.5% (212,937)
Employee of private company:
Brady:
60.8% (257)
Washington:
66.0% (1,843,000)
Self-employed in own incorporated business:
Brady:
4.7% (20)
Washington:
3.2% (90,102)
Private not-for-profit wage and salary workers:
Brady:
5.7% (24)
Washington:
6.9% (191,927)
Local government workers:
Brady:
10.2% (43)
Washington:
6.4% (178,161)
State government workers:
Brady:
5.2% (22)
Washington:
6.9% (192,408)
Self-employed workers in own not incorporated business:
Brady:
13.5% (57)
Washington:
7.2% (199,827)
Employee of private company - Males:
Brady:
6.1% (8)
Washington:
71.1% (1,491,511)
State government workers - Males:
Brady:
8.4% (11)
Washington:
4.1% (84,969)
Federal government workers - Males:
Brady:
51.1% (68)
Washington:
3.4% (70,622)
Self-employed workers in own not incorporated business - Males:
Brady:
34.4% (46)
Washington:
5.4% (113,810)
Employee of private company - Females:
Brady:
18.5% (25)
Washington:
60.0% (1,061,396)
Local government workers - Females:
Brady:
30.4% (41)
Washington:
9.4% (167,001)
State government workers - Females:
Brady:
51.1% (70)
Washington:
6.6% (116,701)
Discuss Brady, Washington (WA) on our hugely popular Washington forum.