Work and Jobs in Burbank, California (CA) Detailed Stats
Occupations, Industries, Unemployment, Workers, Commute
Settings
X


Recent posts about work in Burbank, California on our local forum with over 2,400,000 registered users:
 | Need help with housing: Moving to Burbank-Glendale (CA) for work (29 replies) |
| Burbank IT jobs (0 replies) |
| Starting over with new job in Burbank (2 replies) |
| Does Burbank rub anybody else the wrong way? (85 replies) |
| Closer to Marina Del Rey, or Closer to Burbank/Glendale? (19 replies) |
| Job in Santa Ana moving from Delaware. Where can I live? Costs, High School etc? (8 replies) |
Latest news about work in Burbank, CA collected exclusively by city-data.com from local newspapers, TV, and radio stations
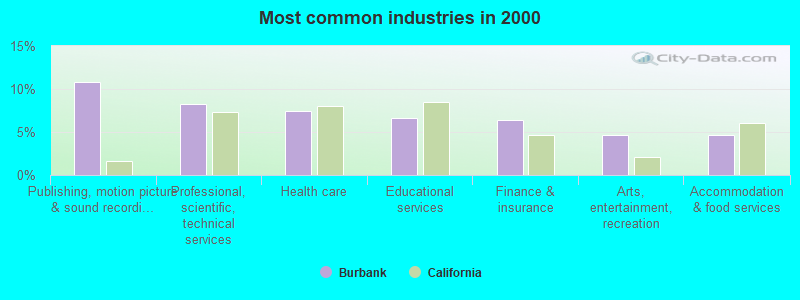
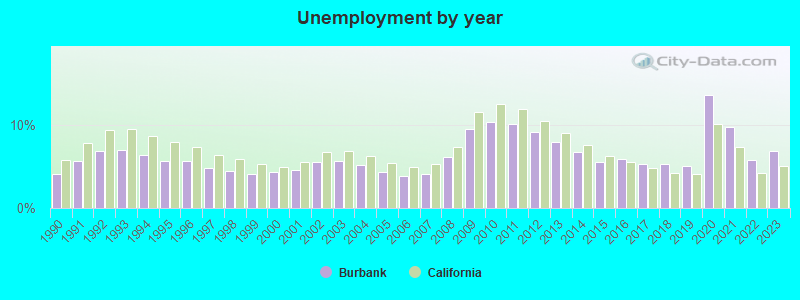
The unemployment rate in 2023 in Burbank, CA was 6.9%, which was 26.1% greater than the unemployment rate of 5.1% across the entire state of California. Compared to the unemployment rate of 8.0% in 2013, this represents a decrease of 15.9%. The most common industries in Burbank are: Publishing, motion picture & sound recording industries (10.8% of civilian employees), Professional, scientific, technical services (8.3% of civilian employees), Health care (7.5% of civilian employees). 98.0% of workers work in Los Angeles County and 24.2% of all workers work at home. 57.8% of workers are employees of private companies, which is 15.0% less than the rate of 66.5% across the entire state of California.
Whole page based on the data from 2000 / 2022 when the population of Burbank, California was 100,316 / 103,919
Whole page based on the data from 2000 / 2022 when the population of Burbank, California was 100,316 / 103,919
Most common industries
Most common industries | |||
|---|---|---|---|
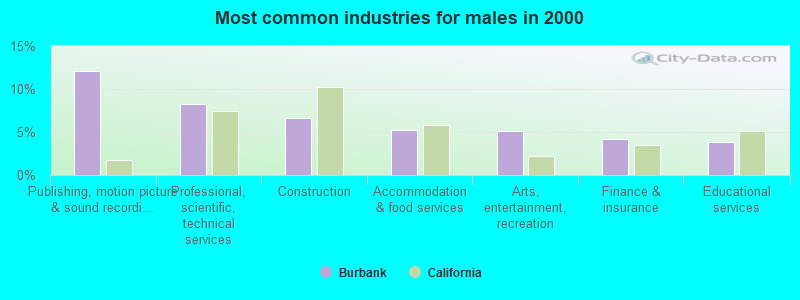
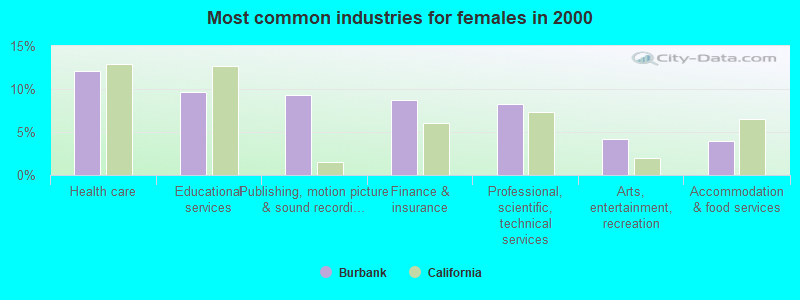
Industry | All | Males | Females |
| Publishing, and motion picture and sound recording industries | 10.8% (5,329) | 12.1% (3,172) | 9.3% (2,157) |
| Professional, scientific, and technical services | 8.3% (4,094) | 8.3% (2,166) | 8.3% (1,928) |
| Health care | 7.5% (3,704) | 3.5% (902) | 12.0% (2,802) |
| Educational services | 6.6% (3,254) | 3.8% (1,000) | 9.7% (2,254) |
| Finance and insurance | 6.3% (3,131) | 4.2% (1,088) | 8.8% (2,043) |
| Arts, entertainment, and recreation | 4.6% (2,295) | 5.1% (1,332) | 4.1% (963) |
| Accommodation and food services | 4.6% (2,283) | 5.2% (1,353) | 4.0% (930) |
| Construction | 4.3% (2,126) | 6.7% (1,745) | 1.6% (381) |
| Public administration | 3.4% (1,683) | 3.5% (922) | 3.3% (761) |
| Administrative and support and waste management services | 3.1% (1,532) | 3.1% (818) | 3.1% (714) |
| Broadcasting and telecommunications | 2.9% (1,419) | 3.1% (822) | 2.6% (597) |
| Real estate and rental and leasing | 2.2% (1,107) | 2.2% (579) | 2.3% (528) |
| Social assistance | 1.8% (886) | 0.3% (84) | 3.4% (802) |
| Food and beverage stores | 1.7% (858) | 1.9% (502) | 1.5% (356) |
| Personal and laundry services | 1.6% (811) | 1.3% (349) | 2.0% (462) |
| Repair and maintenance | 1.6% (771) | 2.8% (732) | 0.2% (39) |
| Miscellaneous manufacturing | 1.5% (753) | 2.0% (514) | 1.0% (239) |
| Transportation equipment | 1.5% (748) | 2.1% (537) | 0.9% (211) |
| Other transportation, and support activities, and couriers | 1.5% (734) | 2.1% (555) | 0.8% (179) |
| Religious, grantmaking, civic, professional, and similar organizations | 1.4% (716) | 0.9% (245) | 2.0% (471) |
| Computer and electronic products | 1.3% (662) | 1.3% (344) | 1.4% (318) |
| Metal and metal products | 1.2% (587) | 2.0% (513) | 0.3% (74) |
| Printing and related support activities | 0.9% (466) | 1.2% (305) | 0.7% (161) |
| Clothing and accessories, including shoe, stores | 0.9% (457) | 0.7% (189) | 1.2% (268) |
| Department and other general merchandise stores | 0.9% (447) | 0.5% (130) | 1.4% (317) |
| Utilities | 0.9% (422) | 1.1% (299) | 0.5% (123) |
| Used merchandise, gift, novelty, and souvenir, and other miscellaneous stores | 0.8% (412) | 0.7% (170) | 1.0% (242) |
| Motor vehicle and parts dealers | 0.8% (388) | 1.1% (291) | 0.4% (97) |
| Data processing, libraries, and other information services | 0.7% (331) | 0.8% (218) | 0.5% (113) |
| Radio, TV, and computer stores | 0.7% (323) | 0.7% (189) | 0.6% (134) |
| Building material and garden equipment and supplies dealers | 0.6% (313) | 0.8% (212) | 0.4% (101) |
| Pharmacies and drug stores | 0.6% (304) | 0.4% (115) | 0.8% (189) |
| Truck transportation | 0.6% (297) | 1.1% (287) | 0.0% (10) |
| Food | 0.6% (285) | 0.8% (209) | 0.3% (76) |
| Apparel | 0.6% (278) | 0.4% (104) | 0.7% (174) |
| Other direct selling establishments | 0.5% (271) | 0.7% (176) | 0.4% (95) |
| Private households | 0.5% (270) | 0.1% (25) | 1.1% (245) |
| Groceries and related products merchant wholesalers | 0.5% (251) | 0.6% (147) | 0.4% (104) |
| Electronic shopping and mail-order houses | 0.5% (245) | 0.5% (143) | 0.4% (102) |
| U. S. Postal service | 0.4% (203) | 0.5% (131) | 0.3% (72) |
| Chemicals | 0.4% (190) | 0.4% (111) | 0.3% (79) |
| Machinery | 0.4% (184) | 0.6% (147) | 0.2% (37) |
| Health and personal care, except drug, stores | 0.4% (180) | 0.3% (79) | 0.4% (101) |
| Plastics and rubber products | 0.4% (179) | 0.4% (105) | 0.3% (74) |
| Jewelry, luggage, and leather goods stores | 0.4% (177) | 0.5% (135) | 0.2% (42) |
| Miscellaneous nondurable goods merchant wholesalers | 0.4% (175) | 0.4% (102) | 0.3% (73) |
| Furniture and home furnishings, and household appliance stores | 0.3% (172) | 0.5% (135) | 0.2% (37) |
| Professional and commercial equipment and supplies merchant wholesalers | 0.3% (167) | 0.4% (96) | 0.3% (71) |
| Miscellaneous durable goods merchant wholesalers | 0.3% (166) | 0.2% (62) | 0.4% (104) |
| Furniture and related product manufacturing | 0.3% (155) | 0.5% (141) | 0.1% (14) |
| Air transportation | 0.3% (146) | 0.4% (103) | 0.2% (43) |
| Electrical and electronic goods merchant wholesalers | 0.3% (131) | 0.4% (95) | 0.2% (36) |
| Apparel, fabrics, and notions merchant wholesalers | 0.3% (127) | 0.4% (93) | 0.1% (34) |
| Sporting goods, camera, and hobby and toy stores | 0.3% (124) | 0.3% (78) | 0.2% (46) |
| Gasoline stations | 0.2% (115) | 0.4% (94) | 0.1% (21) |
| Book stores and news dealers | 0.2% (114) | 0.2% (55) | 0.3% (59) |
| Machinery, equipment, and supplies merchant wholesalers | 0.2% (101) | 0.3% (78) | 0.1% (23) |
| Textile mills and textile products | 0.2% (97) | 0.1% (28) | 0.3% (69) |
| Nonmetallic mineral products | 0.2% (83) | 0.2% (41) | 0.2% (42) |
| Motor vehicles, parts and supplies merchant wholesalers | 0.2% (82) | 0.2% (59) | 0.1% (23) |
| Music stores | 0.1% (72) | 0.1% (30) | 0.2% (42) |
| Warehousing and storage | 0.1% (68) | 0.2% (47) | 0.1% (21) |
| Electrical equipment, appliances, and components | 0.1% (64) | 0.2% (49) | 0.1% (15) |
| Office supplies and stationery stores | 0.1% (62) | 0.1% (24) | 0.2% (38) |
| Drugs, sundries, and chemical and allied products merchant wholesalers | 0.1% (59) | 0.1% (32) | 0.1% (27) |
| Agriculture, forestry, fishing and hunting | 0.1% (58) | 0.1% (29) | 0.1% (29) |
| Petroleum and coal products | 0.1% (57) | 0.2% (45) | 0.1% (12) |
| Paper and paper products merchant wholesalers | 0.1% (55) | 0.2% (40) | 0.1% (15) |
| Hardware, plumbing and heating equipment, and supplies merchant wholesalers | 0.1% (55) | 0.2% (41) | 0.1% (14) |
| Retail florists | 0.1% (52) | 0.1% (27) | 0.1% (25) |
| Leather and allied products | 0.1% (50) | 0.1% (32) | 0.1% (18) |
| Beverage and tobacco products | 0.1% (47) | 0.2% (42) | 0.0% (5) |
| Wood products | 0.1% (44) | 0.2% (44) | 0.0% (0) |
| Lumber and other construction materials merchant wholesalers | 0.1% (42) | 0.2% (42) | 0.0% (0) |
Unemployment in Burbank
- Unemployment by race in 2022
- Unemployment rate for White non-Hispanic residents
- 3.3%Males
- 7.9%Females
- Unemployment rate for Black residents
- 2.2%Males
- 3.0%Females
- Unemployment rate for American Indian and Alaska Native residents
- 3.6%Males
- 24.6%Females
- Unemployment rate for Asian residents
- 4.4%Males
- 2.8%Females
- Unemployment rate for other race residents
- 2.7%Males
- 3.8%Females
- Unemployment rate for two or more race residents
- 3.3%Males
- 6.5%Females
- Unemployment rate for Hispanic or Latino residents
- 4.6%Males
- 5.8%Females
- Unemployment by race in 2000
- Unemployment rate for White non-Hispanic residents
- 7.2%Males
- 5.0%Females
- Unemployment rate for Black residents
- 10.0%Males
- 11.6%Females
- Unemployment rate for American Indian and Alaska Native residents
- 17.7%Males
- 14.0%Females
- Unemployment rate for Asian residents
- 4.1%Males
- 3.0%Females
- Unemployment rate for other race residents
- 7.2%Males
- 7.0%Females
- Unemployment rate for two or more race residents
- 5.0%Males
- 10.8%Females
- Unemployment rate for Hispanic or Latino residents
- 7.0%Males
- 7.3%Females
Unemployment in 2023:
| Burbank: | 6.9% |
| California: | 5.1% |
Unemployment in 2022:
| Burbank: | 5.8% |
| California: | 4.2% |
Unemployment in 2021:
| Burbank: | 9.8% |
| California: | 7.3% |
Unemployment in 2020:
| Burbank: | 13.6% |
| California: | 10.1% |
Unemployment in 2019:
| Burbank: | 5.1% |
| California: | 4.1% |
Unemployment in 2018:
| Burbank: | 5.3% |
| California: | 4.2% |
Unemployment in 2017:
| Burbank: | 5.3% |
| California: | 4.8% |
Unemployment in 2016:
| Burbank: | 5.9% |
| California: | 5.5% |
Unemployment in 2015:
| Burbank: | 5.5% |
| California: | 6.3% |
Unemployment in 2014:
| Burbank: | 6.8% |
| California: | 7.6% |
Unemployment in 2013:
| Burbank: | 8.0% |
| California: | 9.0% |
Unemployment in 2012:
| Burbank: | 9.1% |
| California: | 10.5% |
Unemployment in 2011:
| Burbank: | 10.1% |
| California: | 11.9% |
Unemployment in 2010:
| Burbank: | 10.4% |
| California: | 12.5% |
Unemployment in 2009:
| Burbank: | 9.5% |
| California: | 11.5% |
Unemployment in 2008:
| Burbank: | 6.1% |
| California: | 7.3% |
Unemployment in 2007:
| Burbank: | 4.1% |
| California: | 5.3% |
Unemployment in 2006:
| Burbank: | 3.8% |
| California: | 4.9% |
Unemployment in 2005:
| Burbank: | 4.3% |
| California: | 5.4% |
Unemployment in 2004:
| Burbank: | 5.2% |
| California: | 6.2% |
Unemployment in 2003:
| Burbank: | 5.6% |
| California: | 6.9% |
Unemployment in 2002:
| Burbank: | 5.5% |
| California: | 6.8% |
Unemployment in 2001:
| Burbank: | 4.6% |
| California: | 5.5% |
Unemployment in 2000:
| Burbank: | 4.3% |
| California: | 4.9% |
Unemployment in 1999:
| Burbank: | 4.1% |
| California: | 5.3% |
Unemployment in 1998:
| Burbank: | 4.5% |
| California: | 5.9% |
Unemployment in 1997:
| Burbank: | 4.8% |
| California: | 6.4% |
Unemployment in 1996:
| Burbank: | 5.7% |
| California: | 7.3% |
Unemployment in 1995:
| Burbank: | 5.7% |
| California: | 7.9% |
Unemployment in 1994:
| Burbank: | 6.4% |
| California: | 8.7% |
Unemployment in 1993:
| Burbank: | 7.0% |
| California: | 9.5% |
Unemployment in 1992:
| Burbank: | 6.9% |
| California: | 9.4% |
Unemployment in 1991:
| Burbank: | 5.6% |
| California: | 7.8% |
Unemployment in 1990:
| Burbank: | 4.1% |
| California: | 5.8% |
Time leaving home to go to work
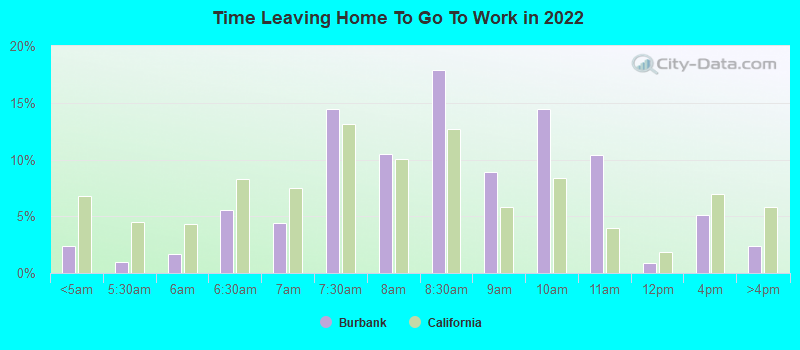
12:00 a.m. to 4:59 a.m.:
| Burbank: | 2.4% (918) |
| California: | 6.8% (1,050,902) |
5:00 a.m. to 5:29 a.m.:
| Burbank: | 1.0% (387) |
| California: | 4.5% (692,772) |
5:30 a.m. to 5:59 a.m.:
| Burbank: | 1.7% (656) |
| California: | 4.3% (665,475) |
6:00 a.m. to 6:29 a.m.:
| Burbank: | 5.5% (2,122) |
| California: | 8.3% (1,273,588) |
6:30 a.m. to 6:59 a.m.:
| Burbank: | 4.4% (1,685) |
| California: | 7.5% (1,156,338) |
7:00 a.m. to 7:29 a.m.:
| Burbank: | 14.4% (5,533) |
| California: | 13.2% (2,027,702) |
7:30 a.m. to 7:59 a.m.:
| Burbank: | 10.5% (4,026) |
| California: | 10.1% (1,550,402) |
8:00 a.m. to 8:29 a.m.:
| Burbank: | 17.8% (6,840) |
| California: | 12.7% (1,953,986) |
8:30 a.m. to 8:59 a.m.:
| Burbank: | 8.9% (3,396) |
| California: | 5.8% (890,950) |
9:00 a.m. to 9:59 a.m.:
| Burbank: | 14.5% (5,541) |
| California: | 8.4% (1,288,499) |
10:00 a.m. to 10:59 a.m.:
| Burbank: | 10.4% (3,998) |
| California: | 4.0% (613,193) |
11:00 a.m. to 11:59 a.m.:
| Burbank: | 0.9% (342) |
| California: | 1.8% (280,975) |
12:00 p.m. to 3:59 p.m.:
| Burbank: | 5.1% (1,966) |
| California: | 7.0% (1,075,505) |
4:00 p.m. to 11:59 p.m.:
| Burbank: | 2.4% (926) |
| California: | 5.8% (891,240) |
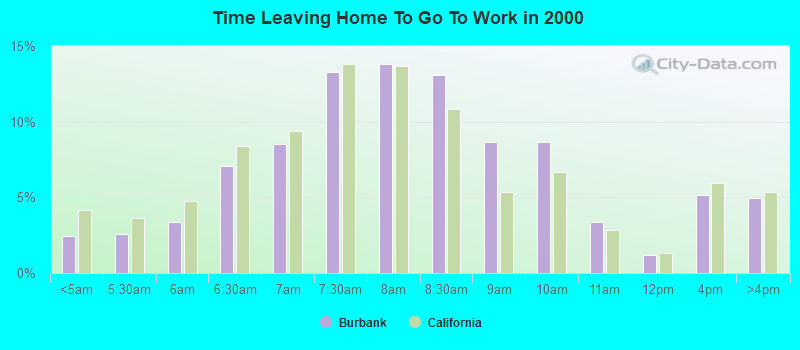
<5am:
| Burbank: | 2.4% (1,168) |
| California: | 4.2% (606,086) |
5:30am:
| Burbank: | 2.6% (1,252) |
| California: | 3.6% (523,209) |
6am:
| Burbank: | 3.3% (1,619) |
| California: | 4.8% (692,256) |
6:30am:
| Burbank: | 7.1% (3,420) |
| California: | 8.4% (1,216,867) |
7am:
| Burbank: | 8.6% (4,143) |
| California: | 9.4% (1,362,830) |
7:30am:
| Burbank: | 13.3% (6,417) |
| California: | 13.8% (2,006,950) |
8am:
| Burbank: | 13.8% (6,679) |
| California: | 13.7% (1,986,831) |
8:30am:
| Burbank: | 13.1% (6,350) |
| California: | 10.9% (1,577,815) |
9am:
| Burbank: | 8.7% (4,206) |
| California: | 5.4% (778,152) |
10am:
| Burbank: | 8.6% (4,182) |
| California: | 6.7% (972,355) |
11am:
| Burbank: | 3.3% (1,620) |
| California: | 2.9% (414,479) |
12pm:
| Burbank: | 1.2% (561) |
| California: | 1.3% (189,005) |
4pm:
| Burbank: | 5.2% (2,505) |
| California: | 6.0% (865,284) |
>4pm:
| Burbank: | 4.9% (2,393) |
| California: | 5.3% (776,167) |
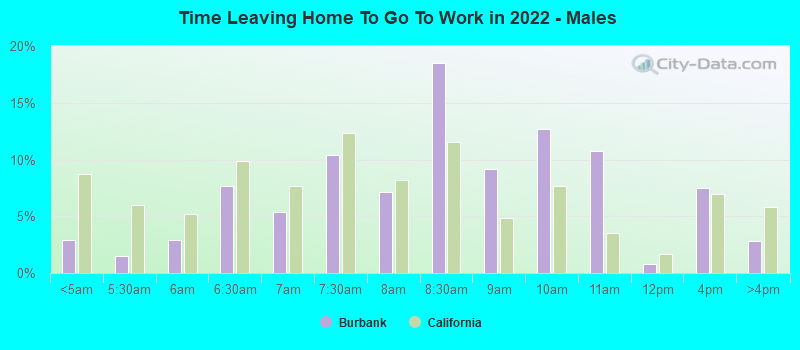
12:00 a.m. to 4:59 a.m. - Males:
| Burbank: | 2.9% (560) |
| California: | 8.7% (747,612) |
5:00 a.m. to 5:29 a.m. - Males:
| Burbank: | 1.5% (288) |
| California: | 6.0% (509,420) |
5:30 a.m. to 5:59 a.m. - Males:
| Burbank: | 2.9% (562) |
| California: | 5.2% (448,269) |
6:00 a.m. to 6:29 a.m. - Males:
| Burbank: | 7.7% (1,494) |
| California: | 9.8% (842,941) |
6:30 a.m. to 6:59 a.m. - Males:
| Burbank: | 5.4% (1,054) |
| California: | 7.7% (657,557) |
7:00 a.m. to 7:29 a.m. - Males:
| Burbank: | 10.4% (2,028) |
| California: | 12.4% (1,058,532) |
7:30 a.m. to 7:59 a.m. - Males:
| Burbank: | 7.1% (1,393) |
| California: | 8.2% (702,727) |
8:00 a.m. to 8:29 a.m. - Males:
| Burbank: | 18.5% (3,609) |
| California: | 11.5% (984,538) |
8:30 a.m. to 8:59 a.m. - Males:
| Burbank: | 9.2% (1,797) |
| California: | 4.8% (414,815) |
9:00 a.m. to 9:59 a.m. - Males:
| Burbank: | 12.7% (2,473) |
| California: | 7.7% (655,038) |
10:00 a.m. to 10:59 a.m. - Males:
| Burbank: | 10.8% (2,100) |
| California: | 3.5% (301,425) |
11:00 a.m. to 11:59 a.m. - Males:
| Burbank: | 0.8% (148) |
| California: | 1.7% (141,620) |
12:00 p.m. to 3:59 p.m. - Males:
| Burbank: | 7.4% (1,454) |
| California: | 7.0% (594,847) |
4:00 p.m. to 11:59 p.m. - Males:
| Burbank: | 2.9% (558) |
| California: | 5.8% (499,471) |
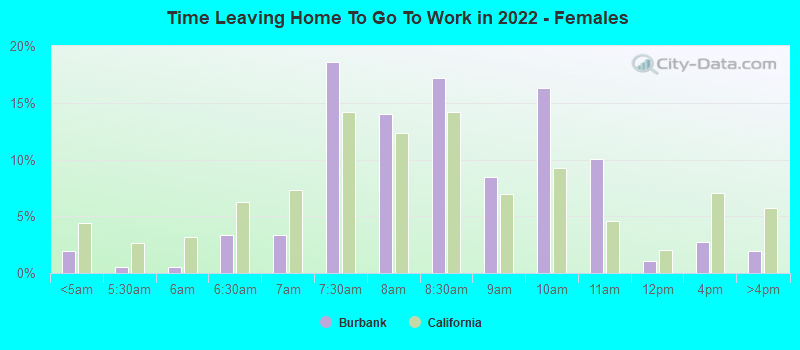
12:00 a.m. to 4:59 a.m. - Females:
| Burbank: | 1.9% (358) |
| California: | 4.4% (303,290) |
5:00 a.m. to 5:29 a.m. - Females:
| Burbank: | 0.5% (99) |
| California: | 2.7% (183,352) |
5:30 a.m. to 5:59 a.m. - Females:
| Burbank: | 0.5% (94) |
| California: | 3.2% (217,206) |
6:00 a.m. to 6:29 a.m. - Females:
| Burbank: | 3.3% (628) |
| California: | 6.3% (430,647) |
6:30 a.m. to 6:59 a.m. - Females:
| Burbank: | 3.4% (631) |
| California: | 7.3% (498,781) |
7:00 a.m. to 7:29 a.m. - Females:
| Burbank: | 18.6% (3,505) |
| California: | 14.1% (969,170) |
7:30 a.m. to 7:59 a.m. - Females:
| Burbank: | 14.0% (2,633) |
| California: | 12.4% (847,675) |
8:00 a.m. to 8:29 a.m. - Females:
| Burbank: | 17.2% (3,231) |
| California: | 14.1% (969,448) |
8:30 a.m. to 8:59 a.m. - Females:
| Burbank: | 8.5% (1,599) |
| California: | 6.9% (476,135) |
9:00 a.m. to 9:59 a.m. - Females:
| Burbank: | 16.3% (3,068) |
| California: | 9.2% (633,461) |
10:00 a.m. to 10:59 a.m. - Females:
| Burbank: | 10.1% (1,898) |
| California: | 4.5% (311,768) |
11:00 a.m. to 11:59 a.m. - Females:
| Burbank: | 1.0% (194) |
| California: | 2.0% (139,355) |
12:00 p.m. to 3:59 p.m. - Females:
| Burbank: | 2.7% (512) |
| California: | 7.0% (480,658) |
4:00 p.m. to 11:59 p.m. - Females:
| Burbank: | 2.0% (368) |
| California: | 5.7% (391,769) |
Travel time to work
Percentage of workers working in this county: 98.0%
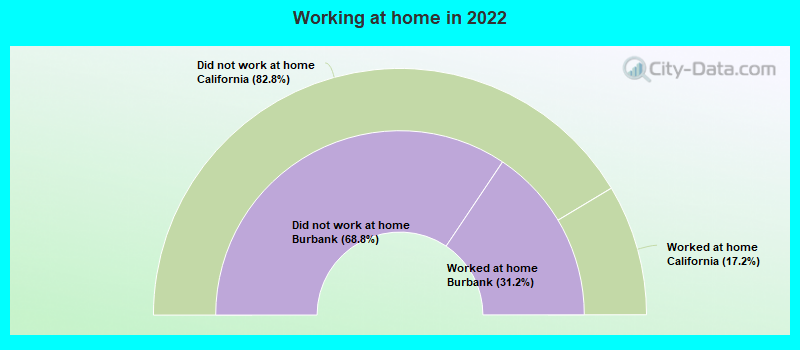
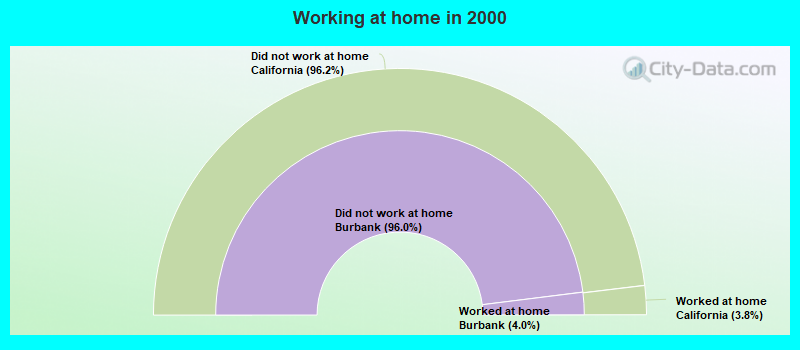
Number of people working at home: 13,165 (24.2% of all workers)
Daytime population change due to commuting: +36,376 (+36.3%)
Workers who live and work in this city: 14,781 (30.5%)
Number of people working at home: 13,165 (24.2% of all workers)
Daytime population change due to commuting: +36,376 (+36.3%)
Workers who live and work in this city: 14,781 (30.5%)
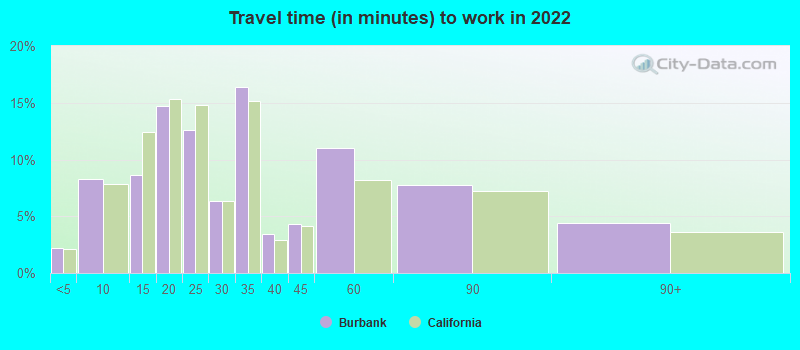
Less than 5 minutes:
| Burbank: | 2.2% (1,766) |
| California: | 2.1% (323,064) |
5 to 9 minutes:
| Burbank: | 8.2% (6,661) |
| California: | 7.8% (1,208,682) |
10 to 14 minutes:
| Burbank: | 8.6% (6,956) |
| California: | 12.4% (1,917,610) |
15 to 19 minutes:
| Burbank: | 14.8% (11,925) |
| California: | 15.3% (2,367,483) |
20 to 24 minutes:
| Burbank: | 12.6% (10,179) |
| California: | 14.8% (2,279,693) |
25 to 29 minutes:
| Burbank: | 6.3% (5,095) |
| California: | 6.4% (981,997) |
30 to 34 minutes:
| Burbank: | 16.4% (13,273) |
| California: | 15.2% (2,339,223) |
35 to 39 minutes:
| Burbank: | 3.4% (2,784) |
| California: | 2.9% (453,226) |
40 to 44 minutes:
| Burbank: | 4.3% (3,454) |
| California: | 4.1% (637,781) |
45 to 59 minutes:
| Burbank: | 11.0% (8,870) |
| California: | 8.2% (1,259,482) |
60 to 89 minutes:
| Burbank: | 7.7% (6,254) |
| California: | 7.2% (1,111,698) |
90 or more minutes:
| Burbank: | 4.4% (3,594) |
| California: | 3.6% (552,805) |
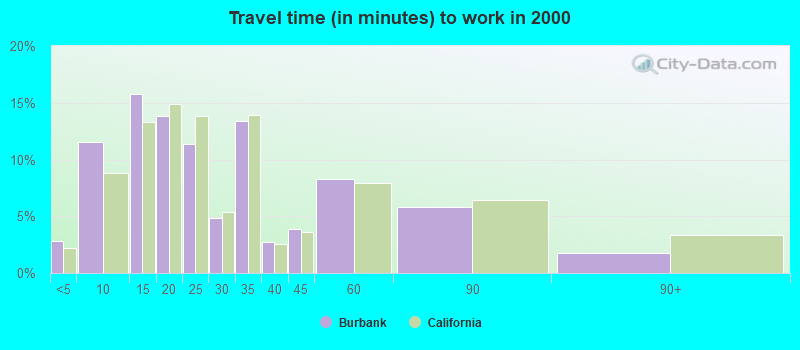
Less than 5 minutes:
| Burbank: | 2.8% (1,355) |
| California: | 2.2% (324,703) |
5 to 9 minutes:
| Burbank: | 11.6% (5,608) |
| California: | 8.8% (1,280,443) |
10 to 14 minutes:
| Burbank: | 15.7% (7,622) |
| California: | 13.3% (1,930,263) |
15 to 19 minutes:
| Burbank: | 13.8% (6,693) |
| California: | 14.9% (2,157,970) |
20 to 24 minutes:
| Burbank: | 11.4% (5,520) |
| California: | 13.8% (2,004,060) |
25 to 29 minutes:
| Burbank: | 4.9% (2,366) |
| California: | 5.4% (782,241) |
30 to 34 minutes:
| Burbank: | 13.4% (6,466) |
| California: | 13.9% (2,025,657) |
35 to 39 minutes:
| Burbank: | 2.7% (1,313) |
| California: | 2.5% (366,487) |
40 to 44 minutes:
| Burbank: | 3.8% (1,864) |
| California: | 3.6% (528,043) |
45 to 59 minutes:
| Burbank: | 8.3% (4,032) |
| California: | 7.9% (1,151,598) |
60 to 89 minutes:
| Burbank: | 5.8% (2,811) |
| California: | 6.4% (933,123) |
90 or more minutes:
| Burbank: | 1.8% (865) |
| California: | 3.3% (483,698) |
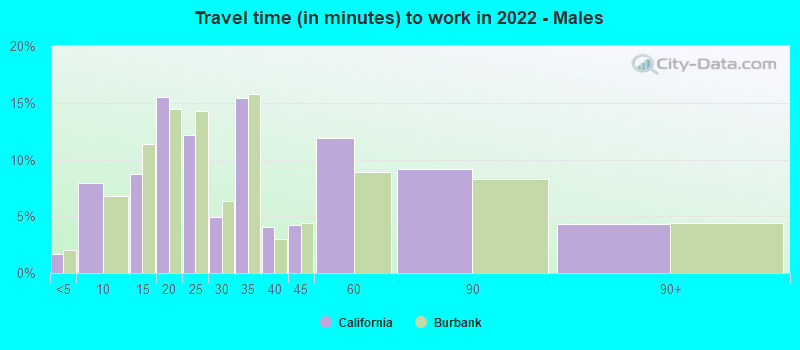
Less than 5 minutes - Males:
| Burbank: | 1.7% (758) |
| California: | 2.0% (173,603) |
5 to 9 minutes - Males:
| Burbank: | 7.9% (3,537) |
| California: | 6.8% (580,822) |
10 to 14 minutes - Males:
| Burbank: | 8.7% (3,898) |
| California: | 11.4% (974,497) |
15 to 19 minutes - Males:
| Burbank: | 15.5% (6,934) |
| California: | 14.5% (1,239,386) |
20 to 24 minutes - Males:
| Burbank: | 12.1% (5,436) |
| California: | 14.3% (1,223,429) |
25 to 29 minutes - Males:
| Burbank: | 4.9% (2,205) |
| California: | 6.4% (545,844) |
30 to 34 minutes - Males:
| Burbank: | 15.4% (6,911) |
| California: | 15.8% (1,352,210) |
35 to 39 minutes - Males:
| Burbank: | 4.1% (1,832) |
| California: | 3.0% (253,732) |
40 to 44 minutes - Males:
| Burbank: | 4.2% (1,885) |
| California: | 4.4% (376,144) |
45 to 59 minutes - Males:
| Burbank: | 11.9% (5,311) |
| California: | 8.9% (762,659) |
60 to 89 minutes - Males:
| Burbank: | 9.2% (4,118) |
| California: | 8.3% (711,394) |
90 or more minutes - Males:
| Burbank: | 4.3% (1,944) |
| California: | 4.4% (378,954) |
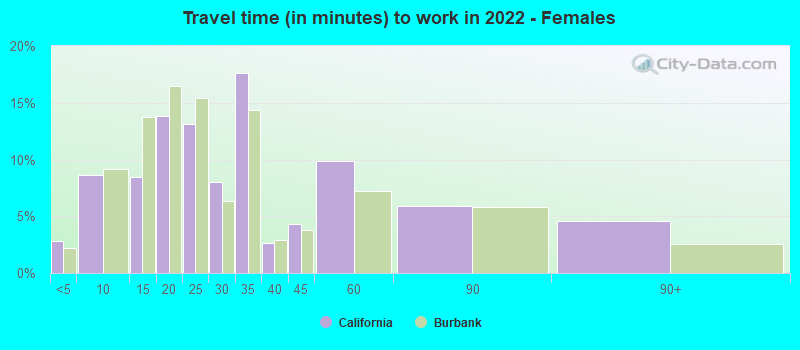
Less than 5 minutes - Females:
| Burbank: | 2.8% (1,008) |
| California: | 2.2% (149,461) |
5 to 9 minutes - Females:
| Burbank: | 8.7% (3,124) |
| California: | 9.2% (627,860) |
10 to 14 minutes - Females:
| Burbank: | 8.5% (3,058) |
| California: | 13.7% (943,113) |
15 to 19 minutes - Females:
| Burbank: | 13.8% (4,991) |
| California: | 16.4% (1,128,097) |
20 to 24 minutes - Females:
| Burbank: | 13.2% (4,743) |
| California: | 15.4% (1,056,264) |
25 to 29 minutes - Females:
| Burbank: | 8.0% (2,890) |
| California: | 6.4% (436,153) |
30 to 34 minutes - Females:
| Burbank: | 17.7% (6,362) |
| California: | 14.4% (987,013) |
35 to 39 minutes - Females:
| Burbank: | 2.6% (952) |
| California: | 2.9% (199,494) |
40 to 44 minutes - Females:
| Burbank: | 4.4% (1,569) |
| California: | 3.8% (261,637) |
45 to 59 minutes - Females:
| Burbank: | 9.9% (3,559) |
| California: | 7.2% (496,823) |
60 to 89 minutes - Females:
| Burbank: | 5.9% (2,136) |
| California: | 5.8% (400,304) |
90 or more minutes - Females:
| Burbank: | 4.6% (1,650) |
| California: | 2.5% (173,851) |
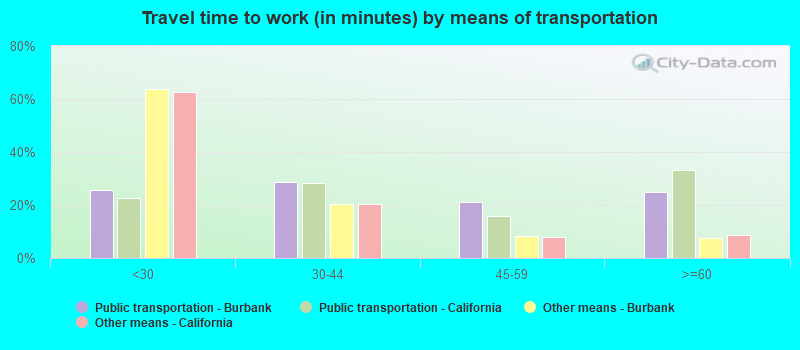
Means of transportation to work
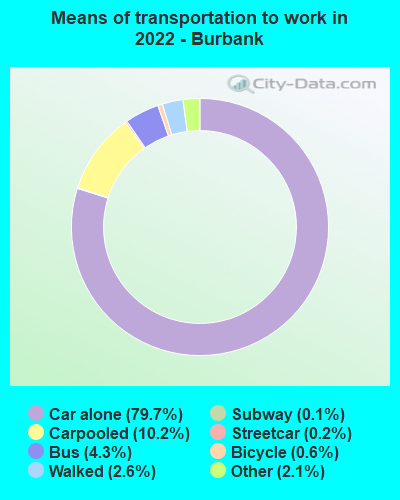

Drove car alone:
| Burbank: | 79.7% (64,413) |
| California: | 79.1% (5,345,368) |
Carpooled:
| Burbank: | 10.2% (8,235) |
| California: | 11.9% (878,699) |
Bus:
| Burbank: | 4.3% (3,466) |
| California: | 2.2% (170,574) |
Subway or elevated rail:
| Burbank: | 0.2% (202) |
| California: | 0.6% (40,665) |
Long-distance train or commuter rail:
| Burbank: | 0.1% (105) |
| California: | 0.2% (16,750) |
Light rail, streetcar or trolley:
| Burbank: | 0.1% (46) |
| California: | 0.1% (8,965) |
Bicycle:
| Burbank: | 0.6% (518) |
| California: | 0.9% (39,197) |
Walked:
| Burbank: | 2.6% (2,114) |
| California: | 2.9% (218,374) |
Other means:
| Burbank: | 2.1% (1,712) |
| California: | 2.1% (137,489) |
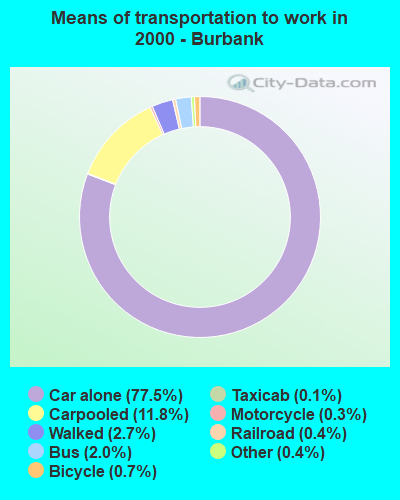

Drove car alone:
| Burbank: | 77.5% (37,554) |
| California: | 71.8% (10,432,462) |
Carpooled:
| Burbank: | 11.8% (5,708) |
| California: | 14.5% (2,113,313) |
Bus or trolley bus:
| Burbank: | 2.0% (984) |
| California: | 3.8% (549,425) |
Streetcar or trolley car:
| Burbank: | 0.0% (5) |
| California: | 0.1% (21,158) |
Subway or elevated:
| Burbank: | 0.1% (26) |
| California: | 0.7% (107,711) |
Railroad:
| Burbank: | 0.4% (173) |
| California: | 0.3% (41,022) |
Taxicab:
| Burbank: | 0.1% (52) |
| California: | 0.1% (9,890) |
Motorcycle:
| Burbank: | 0.3% (124) |
| California: | 0.2% (36,262) |
Bicycle:
| Burbank: | 0.7% (356) |
| California: | 0.8% (120,567) |
Walked:
| Burbank: | 2.7% (1,330) |
| California: | 2.9% (414,581) |
Other means:
| Burbank: | 0.4% (203) |
| California: | 0.8% (115,064) |
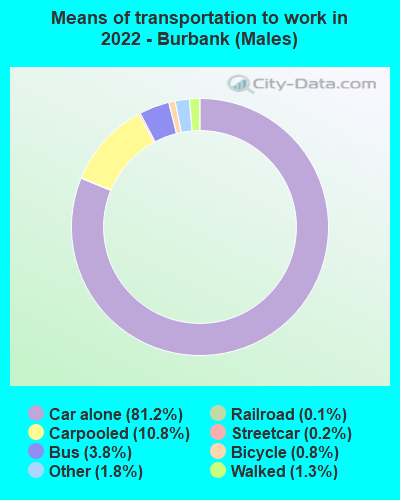

Drove car alone - Males:
| Burbank: | 81.2% (36,361) |
| California: | 80.0% (5,345,368) |
Carpooled - Males:
| Burbank: | 10.8% (4,823) |
| California: | 11.1% (878,699) |
Bus - Males:
| Burbank: | 3.8% (1,709) |
| California: | 2.0% (170,574) |
Subway or elevated rail - Males:
| Burbank: | 0.2% (91) |
| California: | 0.5% (40,665) |
Light rail, streetcar or trolley - Males:
| Burbank: | 0.1% (46) |
| California: | 0.1% (8,965) |
Bicycle - Males:
| Burbank: | 0.8% (355) |
| California: | 1.1% (39,197) |
Walked - Males:
| Burbank: | 1.3% (565) |
| California: | 2.7% (218,374) |
Other means - Males:
| Burbank: | 1.8% (819) |
| California: | 2.1% (137,489) |
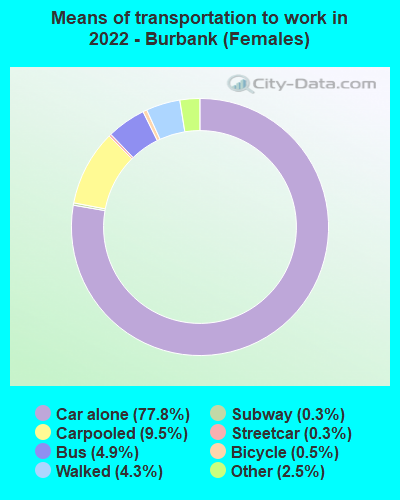

Drove car alone - Females:
| Burbank: | 77.8% (28,052) |
| California: | 77.9% (5,345,368) |
Carpooled - Females:
| Burbank: | 9.5% (3,412) |
| California: | 12.8% (878,699) |
Bus - Females:
| Burbank: | 4.9% (1,757) |
| California: | 2.5% (170,574) |
Subway or elevated rail - Females:
| Burbank: | 0.3% (111) |
| California: | 0.6% (40,665) |
Long-distance train or commuter rail - Females:
| Burbank: | 0.3% (105) |
| California: | 0.2% (16,750) |
Bicycle - Females:
| Burbank: | 0.5% (163) |
| California: | 0.6% (39,197) |
Walked - Females:
| Burbank: | 4.3% (1,549) |
| California: | 3.2% (218,374) |
Other means - Females:
| Burbank: | 2.5% (893) |
| California: | 2.0% (137,489) |
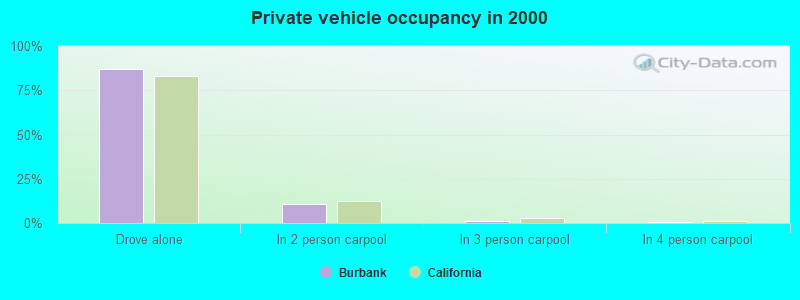
Private vehicle occupancy
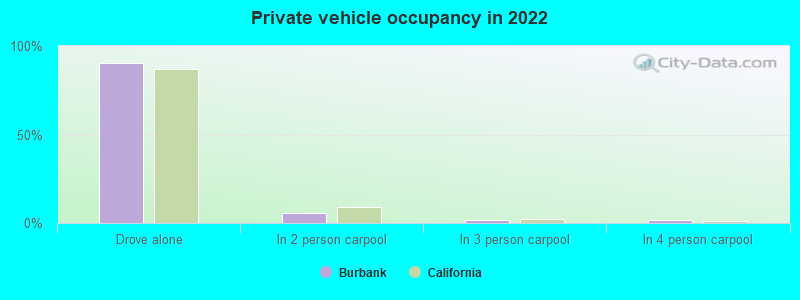
Drove alone:
| Burbank: | 90.6% (32,928) |
| California: | 86.9% (12,187,486) |
In 2 person carpool:
| Burbank: | 5.5% (2,014) |
| California: | 9.2% (1,295,561) |
In 3 person carpool:
| Burbank: | 1.7% (613) |
| California: | 2.2% (309,969) |
In 4 person carpool:
| Burbank: | 1.5% (560) |
| California: | 0.9% (126,987) |
In 5-6 person carpool:
| Burbank: | 0.2% (89) |
| California: | 0.5% (70,825) |
In 7+ person carpool:
| Burbank: | 0.1% (21) |
| California: | 0.2% (28,258) |
Drove alone:
| Burbank: | 86.8% (37,554) |
| California: | 83.2% (10,432,462) |
In 2 person carpool:
| Burbank: | 11.0% (4,759) |
| California: | 12.5% (1,564,905) |
In 3 person carpool:
| Burbank: | 1.3% (580) |
| California: | 2.6% (330,732) |
In 4 person carpool:
| Burbank: | 0.5% (225) |
| California: | 1.0% (119,364) |
In 5-6 person carpool:
| Burbank: | 0.1% (62) |
| California: | 0.5% (57,036) |
In 7+ person carpool:
| Burbank: | 0.2% (82) |
| California: | 0.3% (41,276) |
Class of workers
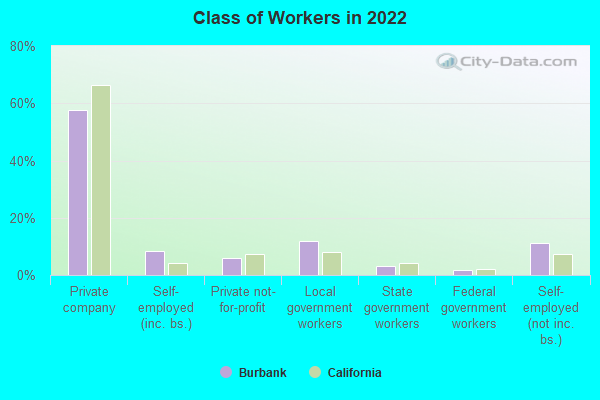
Employee of private company:
| Burbank: | 57.8% (31,887) |
| California: | 66.5% (12,596,030) |
Self-employed in own incorporated business:
| Burbank: | 8.3% (4,589) |
| California: | 4.1% (784,709) |
Private not-for-profit wage and salary workers:
| Burbank: | 6.0% (3,296) |
| California: | 7.5% (1,417,407) |
Local government workers:
| Burbank: | 11.8% (6,505) |
| California: | 8.2% (1,547,056) |
State government workers:
| Burbank: | 3.0% (1,679) |
| California: | 4.1% (780,915) |
Federal government workers:
| Burbank: | 1.9% (1,036) |
| California: | 2.0% (369,858) |
Self-employed workers in own not incorporated business:
| Burbank: | 11.0% (6,085) |
| California: | 7.4% (1,410,735) |
Unpaid family workers:
| Burbank: | 0.1% (82) |
| California: | 0.2% (36,267) |
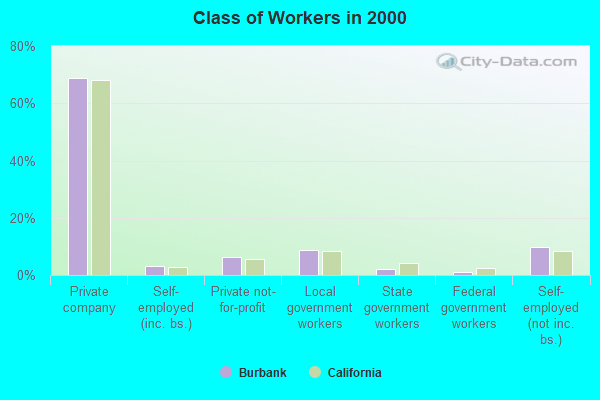
Employee of private company:
| Burbank: | 68.9% (34,030) |
| California: | 68.0% (10,009,465) |
Self-employed in own incorporated business:
| Burbank: | 3.0% (1,502) |
| California: | 2.7% (402,392) |
Private not-for-profit wage and salary workers:
| Burbank: | 6.3% (3,135) |
| California: | 5.7% (845,536) |
Local government workers:
| Burbank: | 8.7% (4,279) |
| California: | 8.3% (1,218,764) |
State government workers:
| Burbank: | 2.0% (979) |
| California: | 4.0% (594,953) |
Federal government workers:
| Burbank: | 1.1% (561) |
| California: | 2.3% (344,354) |
Self-employed workers in own not incorporated business:
| Burbank: | 9.6% (4,761) |
| California: | 8.5% (1,249,530) |
Unpaid family workers:
| Burbank: | 0.3% (152) |
| California: | 0.4% (53,934) |
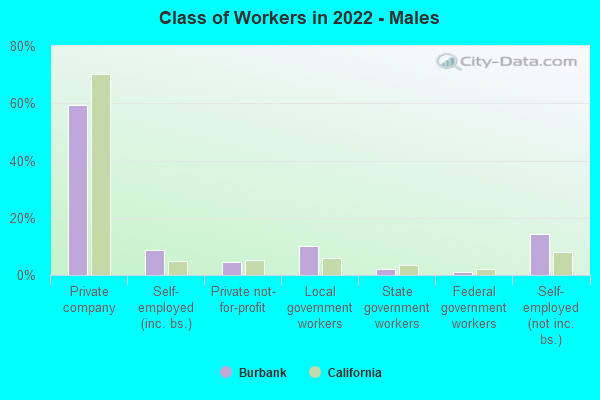
Employee of private company - Males:
| Burbank: | 59.2% (17,039) |
| California: | 70.3% (7,191,252) |
Self-employed in own incorporated business - Males:
| Burbank: | 8.6% (2,480) |
| California: | 4.9% (504,764) |
Private not-for-profit wage and salary workers - Males:
| Burbank: | 4.5% (1,297) |
| California: | 5.2% (529,122) |
Local government workers - Males:
| Burbank: | 10.1% (2,896) |
| California: | 6.0% (610,331) |
State government workers - Males:
| Burbank: | 2.1% (608) |
| California: | 3.4% (343,636) |
Federal government workers - Males:
| Burbank: | 1.1% (321) |
| California: | 2.1% (209,874) |
Self-employed workers in own not incorporated business - Males:
| Burbank: | 14.4% (4,131) |
| California: | 8.1% (824,359) |
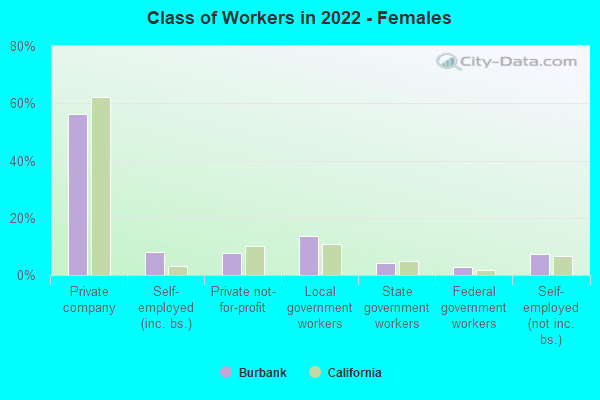
Employee of private company - Females:
| Burbank: | 56.3% (14,848) |
| California: | 62.0% (5,404,778) |
Self-employed in own incorporated business - Females:
| Burbank: | 8.0% (2,109) |
| California: | 3.2% (279,945) |
Private not-for-profit wage and salary workers - Females:
| Burbank: | 7.6% (1,999) |
| California: | 10.2% (888,285) |
Local government workers - Females:
| Burbank: | 13.7% (3,609) |
| California: | 10.8% (936,725) |
State government workers - Females:
| Burbank: | 4.1% (1,071) |
| California: | 5.0% (437,279) |
Federal government workers - Females:
| Burbank: | 2.7% (715) |
| California: | 1.8% (159,984) |
Self-employed workers in own not incorporated business - Females:
| Burbank: | 7.4% (1,954) |
| California: | 6.7% (586,376) |
Unpaid family workers - Females:
| Burbank: | 0.3% (82) |
| California: | 0.2% (18,345) |