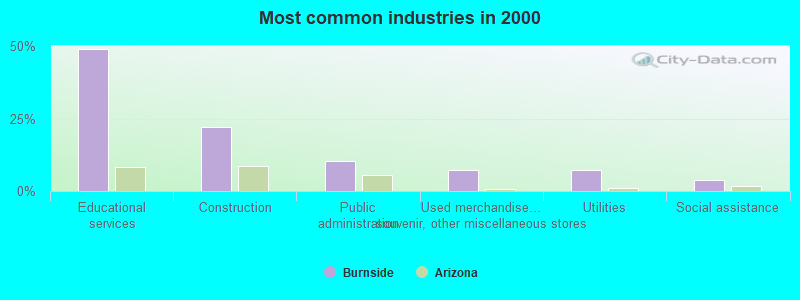
The most common industries in Burnside are: Educational services (49.1% of civilian employees), Construction (22.2% of civilian employees), Public administration (10.2% of civilian employees). 94.5% of workers work in Apache County and 16.6% of all workers work at home. 47.6% of workers are employees of private companies, which is 45.6% less than the rate of 69.3% across the entire state of Arizona.
Whole page based on the data from 2000 / 2022 when the population of Burnside, Arizona was 632 / 500
Most common industries
Most common industries
Industry
All
Males
Females
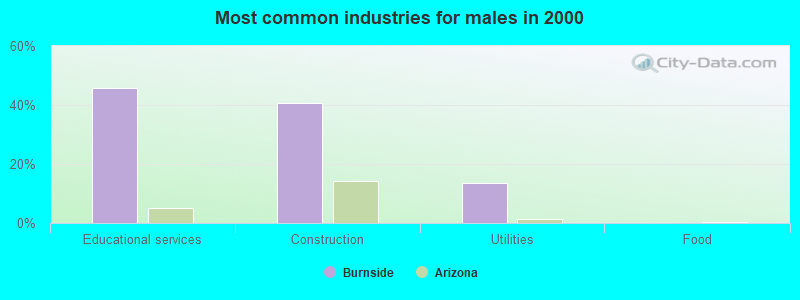
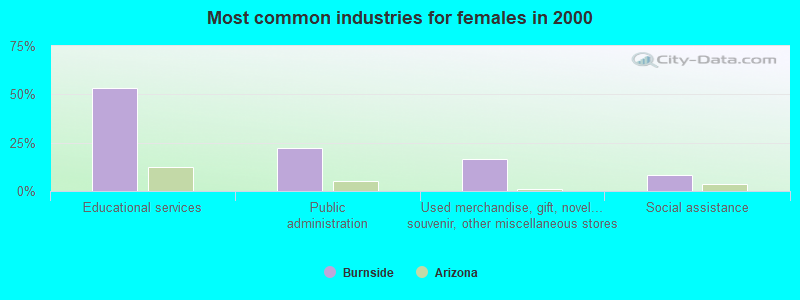
Educational services
49.1% (53)
45.8% (27)
53.1% (26)
Construction
22.2% (24)
40.7% (24)
0.0% (0)
Public administration
10.2% (11)
0.0% (0)
22.4% (11)
Used merchandise, gift, novelty, and souvenir, and other miscellaneous stores
7.4% (8)
0.0% (0)
16.3% (8)
Utilities
7.4% (8)
13.6% (8)
0.0% (0)
Social assistance
3.7% (4)
0.0% (0)
8.2% (4)
Unemployment in Burnside
Unemployment by race in 2000
Unemployment rate for American Indian and Alaska Native residents
14.3%Males
15.1%Females
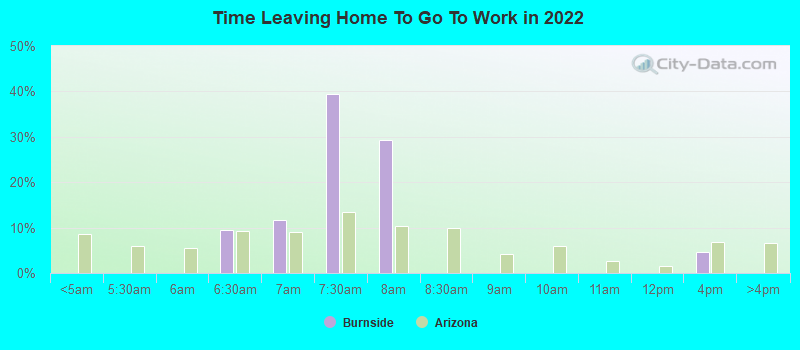
Time leaving home to go to work
6:00 a.m. to 6:29 a.m.:
Burnside:
9.5% (12)
Arizona:
9.3% (256,070)
6:30 a.m. to 6:59 a.m.:
Burnside:
11.6% (15)
Arizona:
9.1% (249,459)
7:00 a.m. to 7:29 a.m.:
Burnside:
39.5% (52)
Arizona:
13.4% (369,779)
7:30 a.m. to 7:59 a.m.:
Burnside:
29.4% (39)
Arizona:
10.4% (285,166)
12:00 p.m. to 3:59 p.m.:
Burnside:
4.6% (6)
Arizona:
6.9% (190,458)
6:30am:
Burnside:
25.6% (23)
Arizona:
9.4% (207,722)
7:30am:
Burnside:
41.1% (37)
Arizona:
13.8% (306,057)
8am:
Burnside:
28.9% (26)
Arizona:
13.3% (293,152)
>4pm:
Burnside:
4.4% (4)
Arizona:
6.4% (140,717)
6:00 a.m. to 6:29 a.m. - Males:
Burnside:
28.4% (19)
Arizona:
10.3% (157,240)
7:00 a.m. to 7:29 a.m. - Males:
Burnside:
32.6% (21)
Arizona:
12.1% (185,665)
7:30 a.m. to 7:59 a.m. - Males:
Burnside:
36.0% (23)
Arizona:
8.8% (135,322)
12:00 p.m. to 3:59 p.m. - Males:
Burnside:
11.4% (7)
Arizona:
6.5% (99,326)
6:30 a.m. to 6:59 a.m. - Females:
Burnside:
25.9% (17)
Arizona:
10.0% (121,887)
7:00 a.m. to 7:29 a.m. - Females:
Burnside:
42.1% (28)
Arizona:
15.1% (184,114)
7:30 a.m. to 7:59 a.m. - Females:
Burnside:
24.0% (16)
Arizona:
12.3% (149,844)
Travel time to work
Percentage of workers working in this county: 94.5% Number of people working at home: 25 (16.6% of all workers)
Less than 5 minutes:
Burnside:
23.3% (21)
Arizona:
2.9% (64,004)
10 to 14 minutes:
Burnside:
11.1% (10)
Arizona:
14.0% (308,552)
15 to 19 minutes:
Burnside:
47.8% (43)
Arizona:
15.1% (334,014)
35 to 39 minutes:
Burnside:
8.9% (8)
Arizona:
2.8% (61,595)
45 to 59 minutes:
Burnside:
8.9% (8)
Arizona:
7.2% (158,690)
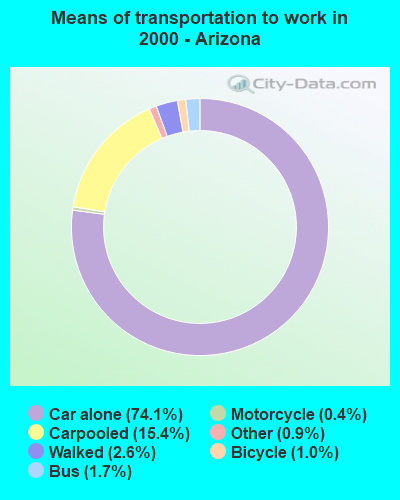
Means of transportation to work
Drove car alone:
Burnside:
26.7% (24)
Arizona:
74.1% (1,638,752)
Carpooled:
Burnside:
50.0% (45)
Arizona:
15.4% (340,447)
Walked:
Burnside:
23.3% (21)
Arizona:
2.6% (58,015)
Private vehicle occupancy
Drove alone:
Burnside:
95.6% (98)
Arizona:
87.1% (2,249,618)
In 2 person carpool:
Burnside:
4.0% (4)
Arizona:
9.6% (248,016)
Drove alone:
Burnside:
34.8% (24)
Arizona:
82.8% (1,638,752)
In 2 person carpool:
Burnside:
37.7% (26)
Arizona:
13.3% (263,536)
In 3 person carpool:
Burnside:
27.5% (19)
Arizona:
2.4% (47,418)
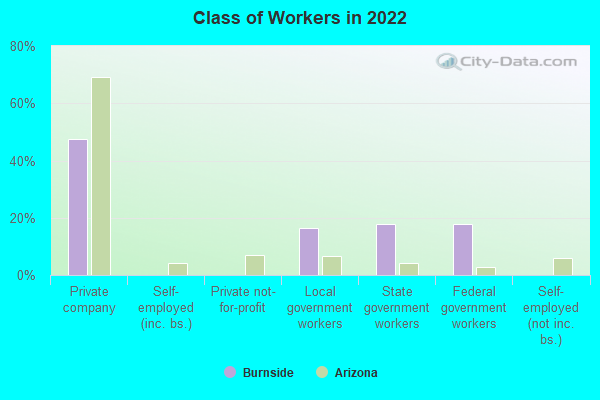
Class of workers
Employee of private company:
Burnside:
47.6% (76)
Arizona:
69.3% (2,383,933)
Local government workers:
Burnside:
16.6% (26)
Arizona:
6.6% (228,494)
State government workers:
Burnside:
17.9% (28)
Arizona:
4.3% (149,309)
Federal government workers:
Burnside:
17.9% (28)
Arizona:
2.7% (91,276)
Employee of private company:
Burnside:
24.1% (26)
Arizona:
69.3% (1,546,865)
Private not-for-profit wage and salary workers:
Burnside:
32.4% (35)
Arizona:
5.4% (119,598)
Local government workers:
Burnside:
25.9% (28)
Arizona:
6.9% (155,187)
State government workers:
Burnside:
9.3% (10)
Arizona:
5.3% (119,292)
Federal government workers:
Burnside:
8.3% (9)
Arizona:
2.9% (65,075)
Employee of private company - Males:
Burnside:
56.7% (37)
Arizona:
72.5% (1,346,166)
Local government workers - Males:
Burnside:
15.0% (10)
Arizona:
5.3% (98,091)
State government workers - Males:
Burnside:
8.3% (5)
Arizona:
3.4% (63,497)
Federal government workers - Males:
Burnside:
20.0% (13)
Arizona:
2.9% (53,017)
Employee of private company - Females:
Burnside:
41.2% (38)
Arizona:
65.4% (1,037,767)
Local government workers - Females:
Burnside:
17.6% (16)
Arizona:
8.2% (130,403)
State government workers - Females:
Burnside:
24.7% (23)
Arizona:
5.4% (85,812)
Federal government workers - Females:
Burnside:
16.5% (15)
Arizona:
2.4% (38,259)
Discuss Burnside, Arizona (AZ) on our hugely popular Arizona forum.