Work and Jobs in Busti, New York (NY) Detailed Stats
Occupations, Industries, Unemployment, Workers, Commute
Settings
X


Recent posts about work in Busti, New York on our local forum with over 2,400,000 registered users:
 | The Niagara Street comeback (9 replies) |
| Could an East Side neighborhood be next? (57 replies) |
| Downtown Construction Update (302 replies) |
| We've made yet another Top 10! Buffalo is the third most affordable city in the country according to Forbes (62 replies) |
| Apartments downtown buffalo (4 replies) |
| Building up suburbia is what's killing Buffalo (94 replies) |
Latest news about work in Busti, NY collected exclusively by city-data.com from local newspapers, TV, and radio stations
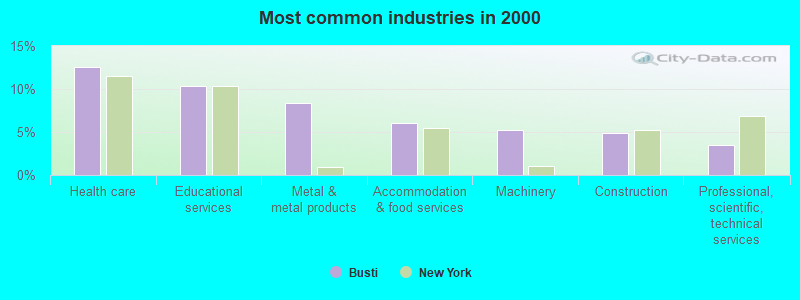
The most common industries in Busti are: Health care (12.6% of civilian employees), Educational services (10.3% of civilian employees), Metal & metal products (8.4% of civilian employees). 62.5% of workers are employees of private companies, which is about the same as the rate of 63.7% across the entire state of New York.
Most common industries
Most common industries | |||
|---|---|---|---|
Industry | All | Males | Females |
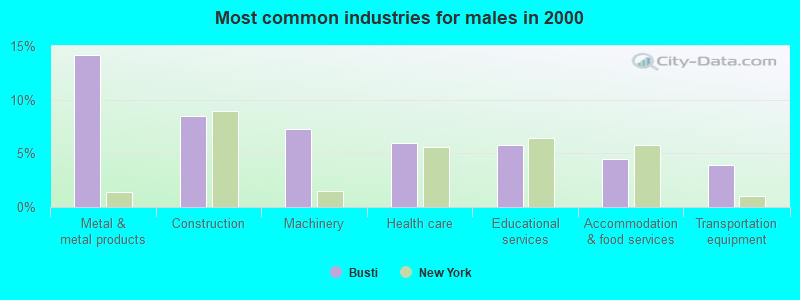
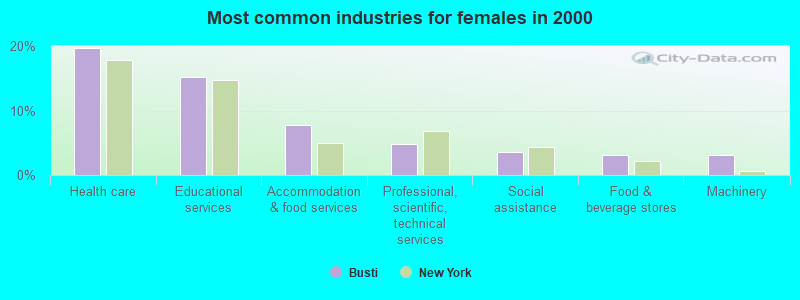
| Health care | 12.6% (472) | 6.0% (117) | 19.7% (355) |
| Educational services | 10.3% (387) | 5.8% (113) | 15.2% (274) |
| Metal and metal products | 8.4% (316) | 14.2% (277) | 2.2% (39) |
| Accommodation and food services | 6.1% (229) | 4.5% (88) | 7.8% (141) |
| Machinery | 5.3% (198) | 7.3% (142) | 3.1% (56) |
| Construction | 4.9% (184) | 8.5% (165) | 1.1% (19) |
| Professional, scientific, and technical services | 3.4% (129) | 2.2% (43) | 4.8% (86) |
| Transportation equipment | 3.3% (123) | 3.9% (77) | 2.5% (46) |
| Food and beverage stores | 3.2% (121) | 3.3% (64) | 3.2% (57) |
| Furniture and related product manufacturing | 2.6% (98) | 3.4% (67) | 1.7% (31) |
| Public administration | 2.6% (98) | 2.7% (53) | 2.5% (45) |
| Arts, entertainment, and recreation | 2.1% (77) | 1.8% (35) | 2.3% (42) |
| Motor vehicle and parts dealers | 2.0% (76) | 3.1% (60) | 0.9% (16) |
| Department and other general merchandise stores | 1.9% (73) | 1.5% (29) | 2.4% (44) |
| Finance and insurance | 1.9% (73) | 1.5% (29) | 2.4% (44) |
| Agriculture, forestry, fishing and hunting | 1.9% (72) | 2.3% (44) | 1.6% (28) |
| Social assistance | 1.8% (69) | 0.3% (6) | 3.5% (63) |
| Administrative and support and waste management services | 1.8% (69) | 1.6% (31) | 2.1% (38) |
| Religious, grantmaking, civic, professional, and similar organizations | 1.8% (69) | 1.0% (20) | 2.7% (49) |
| Utilities | 1.4% (54) | 2.5% (49) | 0.3% (5) |
| Used merchandise, gift, novelty, and souvenir, and other miscellaneous stores | 1.4% (52) | 0.3% (5) | 2.6% (47) |
| Real estate and rental and leasing | 1.4% (51) | 1.4% (27) | 1.3% (24) |
| Broadcasting and telecommunications | 1.3% (50) | 1.8% (36) | 0.8% (14) |
| Other transportation, and support activities, and couriers | 1.2% (46) | 2.0% (39) | 0.4% (7) |
| Computer and electronic products | 1.0% (39) | 1.5% (30) | 0.5% (9) |
| Truck transportation | 1.0% (39) | 2.0% (39) | 0.0% (0) |
| Private households | 1.0% (38) | 0.4% (8) | 1.7% (30) |
| Miscellaneous manufacturing | 1.0% (38) | 1.0% (20) | 1.0% (18) |
| Repair and maintenance | 1.0% (36) | 1.8% (36) | 0.0% (0) |
| Groceries and related products merchant wholesalers | 0.9% (32) | 1.6% (32) | 0.0% (0) |
| U. S. Postal service | 0.8% (29) | 1.0% (19) | 0.6% (10) |
| Other direct selling establishments | 0.7% (27) | 0.0% (0) | 1.5% (27) |
| Personal and laundry services | 0.6% (24) | 0.3% (6) | 1.0% (18) |
| Furniture and home furnishings, and household appliance stores | 0.6% (23) | 0.7% (14) | 0.5% (9) |
| Publishing, and motion picture and sound recording industries | 0.5% (19) | 0.0% (0) | 1.1% (19) |
| Radio, TV, and computer stores | 0.5% (17) | 0.4% (7) | 0.6% (10) |
| Chemicals | 0.5% (17) | 0.5% (10) | 0.4% (7) |
| Vending machine operators | 0.5% (17) | 0.5% (9) | 0.4% (8) |
| Health and personal care, except drug, stores | 0.4% (14) | 0.2% (4) | 0.6% (10) |
| Data processing, libraries, and other information services | 0.3% (13) | 0.0% (0) | 0.7% (13) |
| Building material and garden equipment and supplies dealers | 0.3% (13) | 0.7% (13) | 0.0% (0) |
| Food | 0.3% (12) | 0.4% (7) | 0.3% (5) |
| Miscellaneous nondurable goods merchant wholesalers | 0.3% (11) | 0.2% (3) | 0.4% (8) |
| Nonmetallic mineral products | 0.3% (11) | 0.6% (11) | 0.0% (0) |
| Professional and commercial equipment and supplies merchant wholesalers | 0.2% (9) | 0.5% (9) | 0.0% (0) |
| Warehousing and storage | 0.2% (9) | 0.5% (9) | 0.0% (0) |
| Lumber and other construction materials merchant wholesalers | 0.2% (9) | 0.5% (9) | 0.0% (0) |
| Plastics and rubber products | 0.2% (9) | 0.2% (3) | 0.3% (6) |
| Clothing and accessories, including shoe, stores | 0.2% (8) | 0.0% (0) | 0.4% (8) |
| Hardware, plumbing and heating equipment, and supplies merchant wholesalers | 0.2% (8) | 0.4% (8) | 0.0% (0) |
| Alcoholic beverages merchant wholesalers | 0.2% (7) | 0.4% (7) | 0.0% (0) |
| Gasoline stations | 0.2% (7) | 0.0% (0) | 0.4% (7) |
| Textile mills and textile products | 0.2% (6) | 0.3% (6) | 0.0% (0) |
| Book stores and news dealers | 0.2% (6) | 0.0% (0) | 0.3% (6) |
| Electrical and electronic goods merchant wholesalers | 0.2% (6) | 0.3% (6) | 0.0% (0) |
| Machinery, equipment, and supplies merchant wholesalers | 0.1% (5) | 0.3% (5) | 0.0% (0) |
| Mining, quarrying, and oil and gas extraction | 0.1% (4) | 0.2% (4) | 0.0% (0) |
| Petroleum and petroleum products merchant wholesalers | 0.1% (4) | 0.0% (0) | 0.2% (4) |
| Printing and related support activities | 0.1% (4) | 0.0% (0) | 0.2% (4) |
Unemployment in Busti
- Unemployment by race in 2000
- Unemployment rate for White non-Hispanic residents
- 7.6%Males
- 4.2%Females
Time leaving home to go to work

<5am:
| Busti: | 3.5% (129) |
| New York: | 2.4% (194,562) |
5:30am:
| Busti: | 2.1% (79) |
| New York: | 2.1% (174,328) |
6am:
| Busti: | 6.2% (229) |
| New York: | 3.1% (253,826) |
6:30am:
| Busti: | 8.2% (301) |
| New York: | 7.0% (573,349) |
7am:
| Busti: | 9.0% (334) |
| New York: | 8.6% (706,982) |
7:30am:
| Busti: | 14.3% (527) |
| New York: | 14.0% (1,147,579) |
8am:
| Busti: | 16.5% (608) |
| New York: | 14.8% (1,213,706) |
8:30am:
| Busti: | 12.1% (445) |
| New York: | 13.9% (1,144,298) |
9am:
| Busti: | 8.2% (304) |
| New York: | 7.5% (614,475) |
10am:
| Busti: | 4.5% (167) |
| New York: | 7.2% (593,377) |
11am:
| Busti: | 1.1% (39) |
| New York: | 2.7% (224,011) |
12pm:
| Busti: | 1.4% (53) |
| New York: | 1.3% (105,049) |
4pm:
| Busti: | 5.9% (217) |
| New York: | 6.3% (517,309) |
>4pm:
| Busti: | 3.8% (142) |
| New York: | 6.1% (501,196) |
Travel time to work


Less than 5 minutes:
| Busti: | 5.2% (193) |
| New York: | 2.7% (219,036) |
5 to 9 minutes:
| Busti: | 16.7% (617) |
| New York: | 8.3% (680,270) |
10 to 14 minutes:
| Busti: | 21.5% (792) |
| New York: | 11.6% (956,590) |
15 to 19 minutes:
| Busti: | 23.2% (857) |
| New York: | 12.4% (1,020,084) |
20 to 24 minutes:
| Busti: | 15.4% (569) |
| New York: | 12.3% (1,013,757) |
25 to 29 minutes:
| Busti: | 2.3% (84) |
| New York: | 4.9% (399,384) |
30 to 34 minutes:
| Busti: | 4.7% (175) |
| New York: | 12.9% (1,058,688) |
35 to 39 minutes:
| Busti: | 1.0% (36) |
| New York: | 2.5% (203,722) |
40 to 44 minutes:
| Busti: | 0.5% (20) |
| New York: | 4.1% (340,311) |
45 to 59 minutes:
| Busti: | 1.9% (71) |
| New York: | 9.8% (806,556) |
60 to 89 minutes:
| Busti: | 2.3% (85) |
| New York: | 10.3% (848,185) |
90 or more minutes:
| Busti: | 2.0% (75) |
| New York: | 5.1% (417,464) |
Means of transportation to work


Drove car alone:
| Busti: | 88.1% (3,251) |
| New York: | 56.3% (4,620,178) |
Carpooled:
| Busti: | 7.7% (284) |
| New York: | 9.2% (756,918) |
Bus or trolley bus:
| Busti: | 0.2% (7) |
| New York: | 5.8% (475,389) |
Taxicab:
| Busti: | 0.3% (10) |
| New York: | 0.8% (67,897) |
Walked:
| Busti: | 0.6% (22) |
| New York: | 6.2% (511,721) |
Private vehicle occupancy

Drove alone:
| Busti: | 92.0% (3,251) |
| New York: | 85.9% (4,620,178) |
In 2 person carpool:
| Busti: | 6.4% (226) |
| New York: | 11.0% (590,255) |
In 3 person carpool:
| Busti: | 1.2% (44) |
| New York: | 1.8% (96,470) |
In 4 person carpool:
| Busti: | 0.4% (14) |
| New York: | 0.7% (36,112) |
Class of workers

Employee of private company:
| Busti: | 62.5% (2,349) |
| New York: | 63.7% (5,340,134) |
Self-employed in own incorporated business:
| Busti: | 3.7% (139) |
| New York: | 3.4% (283,619) |
Private not-for-profit wage and salary workers:
| Busti: | 12.4% (466) |
| New York: | 9.7% (810,356) |
Local government workers:
| Busti: | 7.0% (263) |
| New York: | 10.2% (858,120) |
State government workers:
| Busti: | 4.4% (164) |
| New York: | 4.6% (383,673) |
Federal government workers:
| Busti: | 1.5% (58) |
| New York: | 2.2% (185,100) |
Self-employed workers in own not incorporated business:
| Busti: | 8.2% (309) |
| New York: | 6.0% (501,068) |
Unpaid family workers:
| Busti: | 0.2% (8) |
| New York: | 0.2% (20,918) |

Employee of private company - Males:
| Busti: | 66.3% (1,292) |
| New York: | 66.2% (2,902,064) |
Self-employed in own incorporated business - Males:
| Busti: | 6.3% (123) |
| New York: | 4.9% (215,651) |
Private not-for-profit wage and salary workers - Males:
| Busti: | 5.6% (109) |
| New York: | 6.3% (277,787) |
Local government workers - Males:
| Busti: | 7.7% (150) |
| New York: | 8.7% (380,426) |
State government workers - Males:
| Busti: | 2.2% (43) |
| New York: | 4.1% (181,784) |
Federal government workers - Males:
| Busti: | 2.1% (41) |
| New York: | 2.3% (102,647) |
Self-employed workers in own not incorporated business - Males:
| Busti: | 9.4% (184) |
| New York: | 7.1% (312,497) |
Unpaid family workers - Males:
| Busti: | 0.4% (8) |
| New York: | 0.2% (9,470) |

Employee of private company - Females:
| Busti: | 58.5% (1,057) |
| New York: | 60.9% (2,438,070) |
Self-employed in own incorporated business - Females:
| Busti: | 0.9% (16) |
| New York: | 1.7% (67,968) |
Private not-for-profit wage and salary workers - Females:
| Busti: | 19.8% (357) |
| New York: | 13.3% (532,569) |
Local government workers - Females:
| Busti: | 6.3% (113) |
| New York: | 11.9% (477,694) |
State government workers - Females:
| Busti: | 6.7% (121) |
| New York: | 5.0% (201,889) |
Federal government workers - Females:
| Busti: | 0.9% (17) |
| New York: | 2.1% (82,453) |
Self-employed workers in own not incorporated business - Females:
| Busti: | 6.9% (125) |
| New York: | 4.7% (188,571) |