Work and Jobs in Butte, Montana (MT) Detailed Stats
Occupations, Industries, Unemployment, Workers, Commute
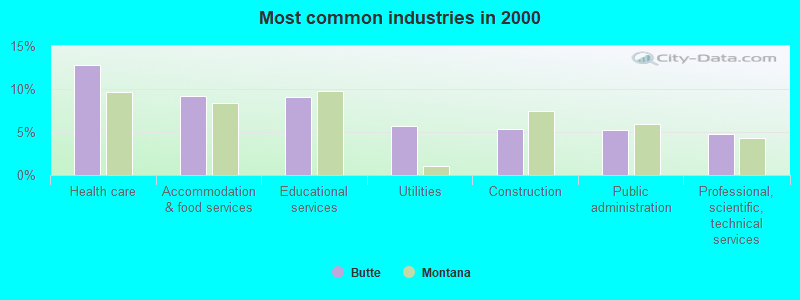
The most common industries in Butte are: Health care (12.8% of civilian employees), Accommodation & food services (9.2% of civilian employees), Educational services (9.1% of civilian employees). 64.4% of workers are employees of private companies, which is 13.0% greater than the rate of 56.0% across the entire state of Montana.
Most common industries
Most common industries | |||
|---|---|---|---|
Industry | All | Males | Females |
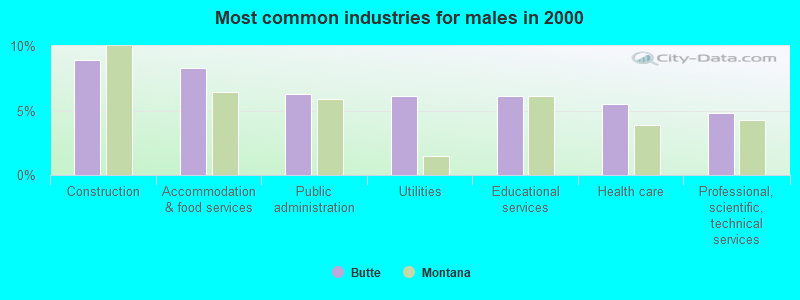
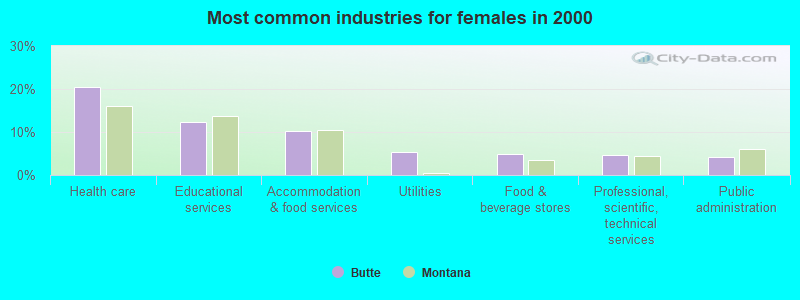
| Health care | 12.8% (1,951) | 5.5% (436) | 20.6% (1,515) |
| Accommodation and food services | 9.2% (1,404) | 8.3% (656) | 10.2% (748) |
| Educational services | 9.1% (1,382) | 6.1% (483) | 12.2% (899) |
| Utilities | 5.7% (874) | 6.1% (484) | 5.3% (390) |
| Construction | 5.3% (810) | 8.9% (702) | 1.5% (108) |
| Public administration | 5.2% (799) | 6.3% (493) | 4.2% (306) |
| Professional, scientific, and technical services | 4.7% (723) | 4.8% (378) | 4.7% (345) |
| Food and beverage stores | 4.6% (707) | 4.5% (354) | 4.8% (353) |
| Religious, grantmaking, civic, professional, and similar organizations | 2.4% (370) | 2.1% (163) | 2.8% (207) |
| Administrative and support and waste management services | 2.4% (364) | 2.4% (189) | 2.4% (175) |
| Arts, entertainment, and recreation | 2.4% (360) | 2.3% (183) | 2.4% (177) |
| Finance and insurance | 2.3% (348) | 1.5% (117) | 3.1% (231) |
| Motor vehicle and parts dealers | 2.2% (332) | 3.7% (294) | 0.5% (38) |
| Mining, quarrying, and oil and gas extraction | 2.1% (327) | 4.0% (317) | 0.1% (10) |
| Social assistance | 1.9% (292) | 0.3% (20) | 3.7% (272) |
| Department and other general merchandise stores | 1.8% (279) | 1.5% (117) | 2.2% (162) |
| Broadcasting and telecommunications | 1.8% (272) | 2.3% (185) | 1.2% (87) |
| Real estate and rental and leasing | 1.7% (262) | 1.8% (140) | 1.7% (122) |
| Agriculture, forestry, fishing and hunting | 1.7% (255) | 2.6% (203) | 0.7% (52) |
| Truck transportation | 1.4% (221) | 2.6% (204) | 0.2% (17) |
| Building material and garden equipment and supplies dealers | 1.2% (187) | 1.3% (104) | 1.1% (83) |
| Personal and laundry services | 1.2% (176) | 0.6% (44) | 1.8% (132) |
| Repair and maintenance | 1.1% (167) | 2.1% (163) | 0.1% (4) |
| Other transportation, and support activities, and couriers | 1.0% (145) | 1.5% (117) | 0.4% (28) |
| Publishing, and motion picture and sound recording industries | 0.9% (140) | 1.1% (85) | 0.7% (55) |
| Used merchandise, gift, novelty, and souvenir, and other miscellaneous stores | 0.9% (133) | 0.5% (40) | 1.3% (93) |
| Chemicals | 0.8% (127) | 1.2% (97) | 0.4% (30) |
| U. S. Postal service | 0.8% (124) | 0.9% (74) | 0.7% (50) |
| Furniture and home furnishings, and household appliance stores | 0.8% (122) | 1.4% (107) | 0.2% (15) |
| Other direct selling establishments | 0.7% (107) | 0.5% (43) | 0.9% (64) |
| Clothing and accessories, including shoe, stores | 0.5% (76) | 0.2% (17) | 0.8% (59) |
| Groceries and related products merchant wholesalers | 0.5% (71) | 0.9% (71) | 0.0% (0) |
| Private households | 0.4% (68) | 0.0% (0) | 0.9% (68) |
| Beverage and tobacco products | 0.4% (67) | 0.4% (34) | 0.4% (33) |
| Petroleum and petroleum products merchant wholesalers | 0.4% (67) | 0.6% (44) | 0.3% (23) |
| Pharmacies and drug stores | 0.4% (66) | 0.5% (41) | 0.3% (25) |
| Nonmetallic mineral products | 0.4% (63) | 0.6% (45) | 0.2% (18) |
| Gasoline stations | 0.4% (61) | 0.3% (26) | 0.5% (35) |
| Office supplies and stationery stores | 0.3% (53) | 0.5% (43) | 0.1% (10) |
| Computer and electronic products | 0.3% (49) | 0.5% (43) | 0.1% (6) |
| Food | 0.3% (46) | 0.3% (24) | 0.3% (22) |
| Wood products | 0.3% (44) | 0.6% (44) | 0.0% (0) |
| Sporting goods, camera, and hobby and toy stores | 0.3% (43) | 0.3% (25) | 0.2% (18) |
| Metal and metal products | 0.3% (43) | 0.4% (33) | 0.1% (10) |
| Health and personal care, except drug, stores | 0.3% (41) | 0.1% (5) | 0.5% (36) |
| Printing and related support activities | 0.2% (38) | 0.1% (10) | 0.4% (28) |
| Recyclable material merchant wholesalers | 0.2% (38) | 0.5% (38) | 0.0% (0) |
| Radio, TV, and computer stores | 0.2% (38) | 0.3% (24) | 0.2% (14) |
| Miscellaneous manufacturing | 0.2% (37) | 0.5% (37) | 0.0% (0) |
| Miscellaneous nondurable goods merchant wholesalers | 0.2% (36) | 0.3% (22) | 0.2% (14) |
| Alcoholic beverages merchant wholesalers | 0.2% (34) | 0.4% (34) | 0.0% (0) |
| Air transportation | 0.2% (33) | 0.3% (27) | 0.1% (6) |
| Transportation equipment | 0.2% (31) | 0.3% (25) | 0.1% (6) |
| Book stores and news dealers | 0.2% (28) | 0.1% (10) | 0.2% (18) |
| Motor vehicles, parts and supplies merchant wholesalers | 0.2% (28) | 0.3% (24) | 0.1% (4) |
| Sewing, needlework, and piece goods stores | 0.2% (27) | 0.1% (4) | 0.3% (23) |
| Data processing, libraries, and other information services | 0.2% (24) | 0.2% (12) | 0.2% (12) |
| Retail florists | 0.2% (24) | 0.0% (0) | 0.3% (24) |
| Music stores | 0.1% (22) | 0.0% (3) | 0.3% (19) |
| Plastics and rubber products | 0.1% (19) | 0.2% (19) | 0.0% (0) |
| Machinery | 0.1% (17) | 0.2% (17) | 0.0% (0) |
| Electrical and electronic goods merchant wholesalers | 0.1% (14) | 0.1% (8) | 0.1% (6) |
| Drugs, sundries, and chemical and allied products merchant wholesalers | 0.1% (13) | 0.1% (8) | 0.1% (5) |
| Petroleum and coal products | 0.1% (11) | 0.1% (11) | 0.0% (0) |
| Furniture and related product manufacturing | 0.1% (9) | 0.1% (9) | 0.0% (0) |
| Machinery, equipment, and supplies merchant wholesalers | 0.1% (8) | 0.1% (8) | 0.0% (0) |
Unemployment in Butte
- Unemployment by race in 2000
- Unemployment rate for White non-Hispanic residents
- 8.2%Males
- 4.8%Females
- Unemployment rate for American Indian and Alaska Native residents
- 22.5%Males
- 22.6%Females
- Unemployment rate for Asian residents
- 10.7%Males
- Unemployment rate for other race residents
- 4.9%Males
- 4.9%Females
- Unemployment rate for two or more race residents
- 15.5%Males
- 18.0%Females
- Unemployment rate for Hispanic or Latino residents
- 1.0%Males
- 5.8%Females
Time leaving home to go to work

<5am:
| Butte: | 2.1% (318) |
| Montana: | 2.7% (11,262) |
5:30am:
| Butte: | 2.2% (329) |
| Montana: | 1.8% (7,411) |
6am:
| Butte: | 3.3% (495) |
| Montana: | 3.0% (12,480) |
6:30am:
| Butte: | 4.6% (696) |
| Montana: | 5.1% (21,726) |
7am:
| Butte: | 7.8% (1,180) |
| Montana: | 8.4% (35,518) |
7:30am:
| Butte: | 9.2% (1,384) |
| Montana: | 13.3% (56,115) |
8am:
| Butte: | 22.0% (3,319) |
| Montana: | 21.4% (90,201) |
8:30am:
| Butte: | 13.9% (2,099) |
| Montana: | 11.7% (49,381) |
9am:
| Butte: | 6.1% (925) |
| Montana: | 5.0% (20,912) |
10am:
| Butte: | 6.2% (940) |
| Montana: | 5.3% (22,556) |
11am:
| Butte: | 2.9% (438) |
| Montana: | 2.5% (10,541) |
12pm:
| Butte: | 1.0% (157) |
| Montana: | 1.2% (5,136) |
4pm:
| Butte: | 7.4% (1,115) |
| Montana: | 5.7% (24,245) |
>4pm:
| Butte: | 8.8% (1,333) |
| Montana: | 6.6% (27,764) |
Travel time to work


Less than 5 minutes:
| Butte: | 6.7% (1,009) |
| Montana: | 7.8% (33,091) |
5 to 9 minutes:
| Butte: | 25.3% (3,815) |
| Montana: | 20.5% (86,585) |
10 to 14 minutes:
| Butte: | 33.3% (5,018) |
| Montana: | 20.8% (87,855) |
15 to 19 minutes:
| Butte: | 16.5% (2,488) |
| Montana: | 16.3% (68,642) |
20 to 24 minutes:
| Butte: | 6.6% (996) |
| Montana: | 10.3% (43,356) |
25 to 29 minutes:
| Butte: | 1.4% (212) |
| Montana: | 2.9% (12,288) |
30 to 34 minutes:
| Butte: | 2.1% (316) |
| Montana: | 6.4% (27,044) |
35 to 39 minutes:
| Butte: | 0.1% (16) |
| Montana: | 0.9% (3,683) |
40 to 44 minutes:
| Butte: | 0.5% (68) |
| Montana: | 1.1% (4,826) |
45 to 59 minutes:
| Butte: | 2.0% (300) |
| Montana: | 2.7% (11,349) |
60 to 89 minutes:
| Butte: | 2.1% (311) |
| Montana: | 2.1% (8,715) |
90 or more minutes:
| Butte: | 1.2% (179) |
| Montana: | 1.9% (7,814) |
Means of transportation to work

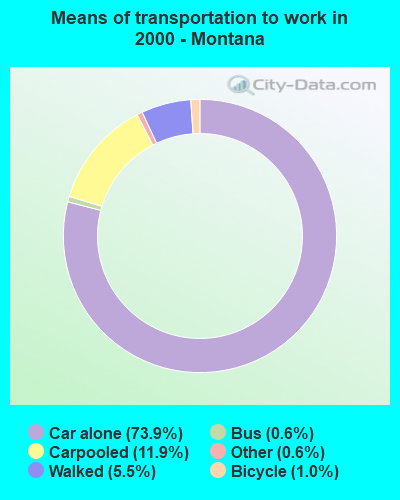
Drove car alone:
| Butte: | 81.7% (12,331) |
| Montana: | 73.9% (311,872) |
Carpooled:
| Butte: | 10.4% (1,568) |
| Montana: | 11.9% (50,192) |
Bus or trolley bus:
| Butte: | 0.4% (67) |
| Montana: | 0.6% (2,441) |
Streetcar or trolley car:
| Butte: | 0.1% (15) |
| Montana: | 0.0% (96) |
Motorcycle:
| Butte: | 0.0% (7) |
| Montana: | 0.1% (338) |
Bicycle:
| Butte: | 0.1% (12) |
| Montana: | 1.0% (4,049) |
Walked:
| Butte: | 4.2% (630) |
| Montana: | 5.5% (23,336) |
Other means:
| Butte: | 0.6% (98) |
| Montana: | 0.6% (2,649) |
Private vehicle occupancy

Drove alone:
| Butte: | 88.7% (12,331) |
| Montana: | 86.1% (311,872) |
In 2 person carpool:
| Butte: | 7.6% (1,063) |
| Montana: | 10.7% (38,849) |
In 3 person carpool:
| Butte: | 1.9% (262) |
| Montana: | 2.1% (7,492) |
In 4 person carpool:
| Butte: | 0.9% (122) |
| Montana: | 0.7% (2,420) |
In 5-6 person carpool:
| Butte: | 0.5% (71) |
| Montana: | 0.3% (1,138) |
In 7+ person carpool:
| Butte: | 0.4% (50) |
| Montana: | 0.1% (293) |
Class of workers

Employee of private company:
| Butte: | 64.4% (9,815) |
| Montana: | 56.0% (238,678) |
Self-employed in own incorporated business:
| Butte: | 3.5% (530) |
| Montana: | 4.9% (20,821) |
Private not-for-profit wage and salary workers:
| Butte: | 9.1% (1,383) |
| Montana: | 8.2% (35,132) |
Local government workers:
| Butte: | 6.1% (923) |
| Montana: | 7.8% (33,240) |
State government workers:
| Butte: | 7.6% (1,156) |
| Montana: | 6.2% (26,416) |
Federal government workers:
| Butte: | 2.6% (391) |
| Montana: | 4.3% (18,467) |
Self-employed workers in own not incorporated business:
| Butte: | 6.3% (960) |
| Montana: | 11.8% (50,112) |
Unpaid family workers:
| Butte: | 0.6% (89) |
| Montana: | 0.7% (3,111) |

Employee of private company - Males:
| Butte: | 65.6% (5,170) |
| Montana: | 57.9% (130,152) |
Self-employed in own incorporated business - Males:
| Butte: | 4.8% (380) |
| Montana: | 6.7% (15,063) |
Private not-for-profit wage and salary workers - Males:
| Butte: | 5.6% (438) |
| Montana: | 4.7% (10,570) |
Local government workers - Males:
| Butte: | 6.4% (508) |
| Montana: | 6.0% (13,559) |
State government workers - Males:
| Butte: | 7.4% (584) |
| Montana: | 5.3% (11,870) |
Federal government workers - Males:
| Butte: | 2.2% (175) |
| Montana: | 4.4% (9,873) |
Self-employed workers in own not incorporated business - Males:
| Butte: | 7.4% (580) |
| Montana: | 14.3% (32,254) |
Unpaid family workers - Males:
| Butte: | 0.6% (51) |
| Montana: | 0.7% (1,592) |

Employee of private company - Females:
| Butte: | 63.1% (4,645) |
| Montana: | 54.0% (108,526) |
Self-employed in own incorporated business - Females:
| Butte: | 2.0% (150) |
| Montana: | 2.9% (5,758) |
Private not-for-profit wage and salary workers - Females:
| Butte: | 12.8% (945) |
| Montana: | 12.2% (24,562) |
Local government workers - Females:
| Butte: | 5.6% (415) |
| Montana: | 9.8% (19,681) |
State government workers - Females:
| Butte: | 7.8% (572) |
| Montana: | 7.2% (14,546) |
Federal government workers - Females:
| Butte: | 2.9% (216) |
| Montana: | 4.3% (8,594) |
Self-employed workers in own not incorporated business - Females:
| Butte: | 5.2% (380) |
| Montana: | 8.9% (17,858) |
Unpaid family workers - Females:
| Butte: | 0.5% (38) |
| Montana: | 0.8% (1,519) |