Work and Jobs in Cairo, Illinois (IL) Detailed Stats
Data:
Unemployment (%)
Unemployment (% change since 2000)
Unemployment (%) - White
Unemployment (% change since 2000) - White
Unemployment (%) - Black or African American
Unemployment (% change since 2000) - Black or African American
Unemployment (%) - Asian
Unemployment (% change since 2000) - Asian
Unemployment (%) - Hispanic or Latino
Unemployment (% change since 2000) - Hispanic or Latino
Unemployment (%) - American Indian and Alaska Native
Unemployment (% change since 2000) - American Indian and Alaska Native
Unemployment (%) - Multirace
Unemployment (% change since 2000) - Multirace
Unemployment (%) - Other Race
Unemployment (% change since 2000) - Other Race
Industry diversity
Most Common Industries - Agriculture, forestry, fishing and hunting, and mining (%)
Most Common Industries - Agriculture, forestry, fishing and hunting (%)
Most Common Industries - Mining, quarrying, and oil and gas extraction (%)
Most Common Industries - Construction (%)
Most Common Industries - Manufacturing (%)
Most Common Industries - Wholesale trade (%)
Most Common Industries - Retail trade (%)
Most Common Industries - Transportation and warehousing, and utilities (%)
Most Common Industries - Transportation and warehousing (%)
Most Common Industries - Utilities (%)
Most Common Industries - Information (%)
Most Common Industries - Finance and insurance, and real estate and rental and leasing (%)
Most Common Industries - Finance and insurance (%)
Most Common Industries - Real estate and rental and leasing (%)
Most Common Industries - Professional, scientific, and management, and administrative and waste management services (%)
Most Common Industries - Professional, scientific, and technical services (%)
Most Common Industries - Management of companies and enterprises (%)
Most Common Industries - Administrative and support and waste management services (%)
Most Common Industries - Educational services, and health care and social assistance (%)
Most Common Industries - Educational services (%)
Most Common Industries - Health care and social assistance (%)
Most Common Industries - Arts, entertainment, and recreation, and accommodation and food services (%)
Most Common Industries - Arts, entertainment, and recreation (%)
Most Common Industries - Accommodation and food services (%)
Most Common Industries - Other services, except public administration (%)
Most Common Industries - Public administration (%)
Occupation diversity
Most Common Occupations - Management, business, science, and arts occupations (%)
Most Common Occupations - Management, business, and financial occupations (%)
Most Common Occupations - Management occupations (%)
Most Common Occupations - Business and financial operations occupations (%)
Most Common Occupations - Computer, engineering, and science occupations (%)
Most Common Occupations - Computer and mathematical occupations (%)
Most Common Occupations - Architecture and engineering occupations (%)
Most Common Occupations - Life, physical, and social science occupations (%)
Most Common Occupations - Education, legal, community service, arts, and media occupations (%)
Most Common Occupations - Community and social service occupations (%)
Most Common Occupations - Legal occupations (%)
Most Common Occupations - Education, training, and library occupations (%)
Most Common Occupations - Arts, design, entertainment, sports, and media occupations (%)
Most Common Occupations - Healthcare practitioners and technical occupations (%)
Most Common Occupations - Health diagnosing and treating practitioners and other technical occupations (%)
Most Common Occupations - Health technologists and technicians (%)
Most Common Occupations - Service occupations (%)
Most Common Occupations - Healthcare support occupations (%)
Most Common Occupations - Protective service occupations (%)
Most Common Occupations - Fire fighting and prevention, and other protective service workers including supervisors (%)
Most Common Occupations - Law enforcement workers including supervisors (%)
Most Common Occupations - Food preparation and serving related occupations (%)
Most Common Occupations - Building and grounds cleaning and maintenance occupations (%)
Most Common Occupations - Personal care and service occupations (%)
Most Common Occupations - Sales and office occupations (%)
Most Common Occupations - Sales and related occupations (%)
Most Common Occupations - Office and administrative support occupations (%)
Most Common Occupations - Natural resources, construction, and maintenance occupations (%)
Most Common Occupations - Farming, fishing, and forestry occupations (%)
Most Common Occupations - Construction and extraction occupations (%)
Most Common Occupations - Installation, maintenance, and repair occupations (%)
Most Common Occupations - Production, transportation, and material moving occupations (%)
Most Common Occupations - Production occupations (%)
Most Common Occupations - Transportation occupations (%)
Most Common Occupations - Material moving occupations (%)
Private vehicle occupancy - Drove alone (% change since 2000)
Private vehicle occupancy - Carpooled (%)
Private vehicle occupancy - Carpooled (% change since 2000)
Private vehicle occupancy - In 2-person carpool (%)
Private vehicle occupancy - In 2-person carpool (% change since 2000)
Private vehicle occupancy - In 3-person carpool (%)
Private vehicle occupancy - In 3-person carpool (% change since 2000)
Private vehicle occupancy - In 4-person carpool (%)
Private vehicle occupancy - In 4-person carpool (% change since 2000)
Private vehicle occupancy - In 5- or 6-person carpool (%)
Private vehicle occupancy - In 5- or 6-person carpool (% change since 2000)
Private vehicle occupancy - In 7-or-more-person carpool (%)
Private vehicle occupancy - In 7-or-more-person carpool (% change since 2000)
Time Leaving Home To Go To Work - 12:00 a.m. to 4:59 a.m. (%)
Time Leaving Home To Go To Work - 12:00 a.m. to 4:59 a.m. (% change since 2000)
Time Leaving Home To Go To Work - 5:00 a.m. to 5:59 a.m. (%)
Time Leaving Home To Go To Work - 5:00 a.m. to 5:59 a.m. (% change since 2000)
Time Leaving Home To Go To Work - 6:00 a.m. to 6:59 a.m. (%)
Time Leaving Home To Go To Work - 6:00 a.m. to 6:59 a.m. (% change since 2000)
Time Leaving Home To Go To Work - 7:00 a.m. to 7:59 a.m. (%)
Time Leaving Home To Go To Work - 7:00 a.m. to 7:59 a.m. (% change since 2000)
Time Leaving Home To Go To Work - 8:00 a.m. to 8:59 a.m. (%)
Time Leaving Home To Go To Work - 8:00 a.m. to 8:59 a.m. (% change since 2000)
Time Leaving Home To Go To Work - 9:00 a.m. to 9:59 a.m. (%)
Time Leaving Home To Go To Work - 9:00 a.m. to 9:59 a.m. (% change since 2000)
Time Leaving Home To Go To Work - 10:00 a.m. to 10:59 a.m. (%)
Time Leaving Home To Go To Work - 10:00 a.m. to 10:59 a.m. (% change since 2000)
Time Leaving Home To Go To Work - 11:00 a.m. to 11:59 a.m. (%)
Time Leaving Home To Go To Work - 11:00 a.m. to 11:59 a.m. (% change since 2000)
Time Leaving Home To Go To Work - 12:00 p.m. to 3:59 p.m. (%)
Time Leaving Home To Go To Work - 12:00 p.m. to 3:59 p.m. (% change since 2000)
Time Leaving Home To Go To Work - 4:00 p.m. to 11:59 p.m. (%)
Time Leaving Home To Go To Work - 4:00 p.m. to 11:59 p.m. (% change since 2000)
Class of Workers - Employee of private company (%)
Class of Workers - Employee of private company (% change since 2000)
Class of Workers - Self-employed in own incorporated business (%)
Class of Workers - Self-employed in own incorporated business (% change since 2000)
Class of Workers - Private not-for-profit wage and salary workers (%)
Class of Workers - Private not-for-profit wage and salary workers (% change since 2000)
Class of Workers - Local government workers (%)
Class of Workers - Local government workers (% change since 2000)
Class of Workers - State government workers (%)
Class of Workers - State government workers (% change since 2000)
Class of Workers - Federal government workers (%)
Class of Workers - Federal government workers (% change since 2000)
Class of Workers - Self-employed workers in own not incorporated business and Unpaid family workers (%)
Class of Workers - Self-employed workers in own not incorporated business and Unpaid family workers (% change since 2000)
Means of transportation to work - Drove car alone (%)
Means of transportation to work - Drove car alone (% change since 2000)
Means of transportation to work - Carpooled (%)
Means of transportation to work - Carpooled (% change since 2000)
Means of transportation to work - Public transportation (%)
Means of transportation to work - Public transportation (% change since 2000)
Means of transportation to work - Bus or trolley bus (%)
Means of transportation to work - Bus or trolley bus (% change since 2000)
Means of transportation to work - Streetcar or trolley car (%)
Means of transportation to work - Streetcar or trolley car (% change since 2000)
Means of transportation to work - Subway or elevated (%)
Means of transportation to work - Subway or elevated (% change since 2000)
Means of transportation to work - Railroad (%)
Means of transportation to work - Railroad (% change since 2000)
Means of transportation to work - Ferryboat (%)
Means of transportation to work - Ferryboat (% change since 2000)
Means of transportation to work - Taxicab (%)
Means of transportation to work - Taxicab (% change since 2000)
Means of transportation to work - Motorcycle (%)
Means of transportation to work - Motorcycle (% change since 2000)
Means of transportation to work - Bicycle (%)
Means of transportation to work - Bicycle (% change since 2000)
Means of transportation to work - Walked (%)
Means of transportation to work - Walked (% change since 2000)
Means of transportation to work - Other means (%)
Means of transportation to work - Other means (% change since 2000)
Working at home (%)
Working at home (% change since 2000)
Travel time to work - Less than 5 minutes (%)
Travel time to work - Less than 5 minutes (% change since 2000)
Travel time to work - 5 to 9 minutes (%)
Travel time to work - 5 to 9 minutes (% change since 2000)
Travel time to work - 10 to 19 minutes (%)
Travel time to work - 10 to 19 minutes (% change since 2000)
Travel time to work - 20 to 29 minutes (%)
Travel time to work - 20 to 29 minutes (% change since 2000)
Travel time to work - 30 to 39 minutes (%)
Travel time to work - 30 to 39 minutes (% change since 2000)
Travel time to work - 40 to 59 minutes (%)
Travel time to work - 40 to 59 minutes (% change since 2000)
Travel time to work - 60 to 89 minutes (%)
Travel time to work - 60 to 89 minutes (% change since 2000)
Travel time to work - 90 or more minutes (%)
Travel time to work - 90 or more minutes (% change since 2000)
Latest news about work in Cairo, IL collected exclusively by city-data.com from local newspapers, TV, and radio stations
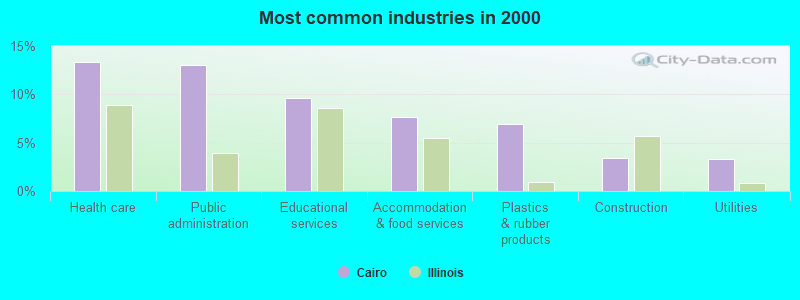
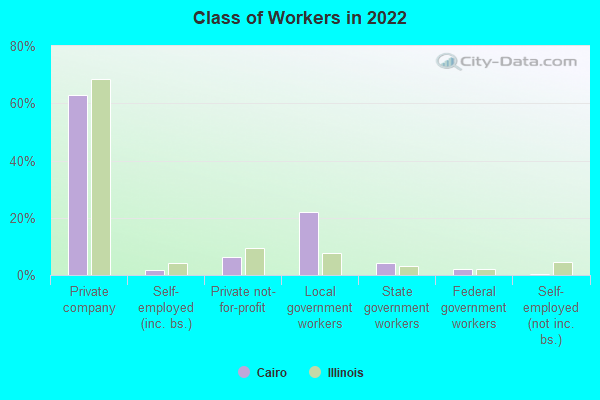
The most common industries in Cairo are: Health care (13.3% of civilian employees), Public administration (13.1% of civilian employees), Educational services (9.6% of civilian employees). 52.5% of workers work in Alexander County and 1.2% of all workers work at home. 63.0% of workers are employees of private companies, which is 8.5% less than the rate of 68.3% across the entire state of Illinois.
Whole page based on the data from 2000 / 2022 when the population of Cairo, Illinois was 3,632 / 1,489
Most common industries
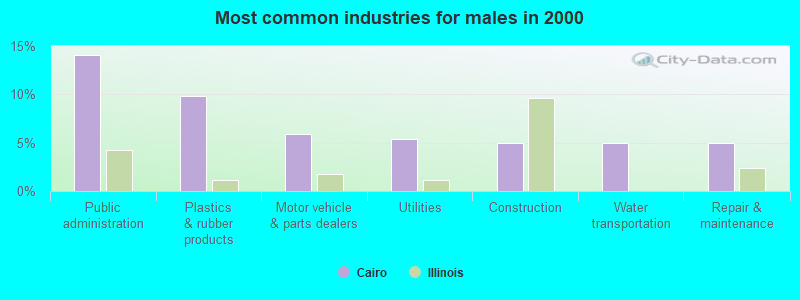
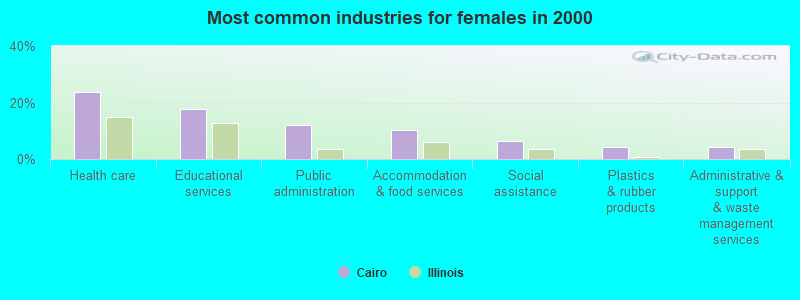
Most common industries Industry All Males Females
Health care 13.3% 2.7% 23.6% Public administration 13.1% 14.1% 12.0% Educational services 9.6% 1.2% 17.7% Accommodation and food services 7.6% 5.0% 10.2% Plastics and rubber products 6.9% 9.8% 4.1% Construction 3.4% 5.0% 1.9% Utilities 3.3% 5.4% 1.4% Administrative and support and waste management services 3.2% 2.3% 4.1% Social assistance 3.2% 0.0% 6.2% Motor vehicle and parts dealers 2.9% 5.9% 0.0% Paper 2.5% 3.6% 1.5% Water transportation 2.5% 5.0% 0.0% Repair and maintenance 2.5% 5.0% 0.0% Food 2.0% 3.4% 0.7% Real estate and rental and leasing 1.9% 2.7% 1.2% Food and beverage stores 1.8% 1.8% 1.9% Department and other general merchandise stores 1.4% 1.2% 1.5% Broadcasting and telecommunications 1.3% 1.4% 1.2% Drugs, sundries, and chemical and allied products merchant wholesalers 1.3% 2.7% 0.0% Chemicals 1.2% 2.5% 0.0% Transportation equipment 1.1% 1.1% 1.2% Machinery 1.1% 2.3% 0.0% Printing and related support activities 1.1% 0.0% 2.1% Nonmetallic mineral products 1.1% 2.1% 0.0% Arts, entertainment, and recreation 1.1% 0.0% 2.1% Metal and metal products 0.9% 0.0% 1.7% Motor vehicles, parts and supplies merchant wholesalers 0.9% 1.8% 0.0% Publishing, and motion picture and sound recording industries 0.9% 0.9% 0.9% Beverage and tobacco products 0.8% 1.6% 0.0% Professional, scientific, and technical services 0.8% 0.9% 0.7% Warehousing and storage 0.7% 1.4% 0.0% Machinery, equipment, and supplies merchant wholesalers 0.6% 1.2% 0.0% Mining, quarrying, and oil and gas extraction 0.6% 1.2% 0.0% Other transportation, and support activities, and couriers 0.6% 0.0% 1.2% Agriculture, forestry, fishing and hunting 0.5% 1.1% 0.0% Other direct selling establishments 0.5% 1.1% 0.0% Gasoline stations 0.4% 0.0% 0.9% Sporting goods, camera, and hobby and toy stores 0.4% 0.9% 0.0% Computer and electronic products 0.4% 0.9% 0.0% Miscellaneous nondurable goods merchant wholesalers 0.4% 0.7% 0.0%
Unemployment in Cairo Unemployment by race in 2022
Unemployment rate for White non-Hispanic residents 36.9% FemalesUnemployment rate for Black residents 21.0% MalesUnemployment rate for two or more race residents 23.7% MalesUnemployment by race in 2000
Unemployment rate for White non-Hispanic residents 6.6% Males13.8% FemalesUnemployment rate for Black residents 22.6% Males14.7% Females
Time leaving home to go to work 12:00 a.m. to 4:59 a.m.: Cairo:
19.4% (91)Illinois:
6.0% (313,385)
6:30 a.m. to 6:59 a.m.: Cairo:
13.6% (64)Illinois:
9.3% (484,300)
7:00 a.m. to 7:29 a.m.: Cairo:
10.5% (50)Illinois:
14.3% (746,798)
7:30 a.m. to 7:59 a.m.: Cairo:
29.8% (141)Illinois:
11.5% (597,236)
8:00 a.m. to 8:29 a.m.: Cairo:
19.8% (93)Illinois:
11.2% (585,810)
8:30 a.m. to 8:59 a.m.: Cairo:
1.0% (5)Illinois:
5.2% (271,981)
12:00 p.m. to 3:59 p.m.: Cairo:
4.4% (21)Illinois:
7.6% (397,128)
4:00 p.m. to 11:59 p.m.: Cairo:
3.0% (14)Illinois:
6.3% (328,692)
5:30am: Cairo:
2.1% (23)Illinois:
3.5% (199,483)
6am: Cairo:
10.6% (118)Illinois:
4.8% (274,395)
6:30am: Cairo:
5.3% (59)Illinois:
9.3% (532,224)
7am: Cairo:
10.6% (118)Illinois:
10.3% (593,196)
7:30am: Cairo:
6.7% (75)Illinois:
14.1% (808,399)
8am: Cairo:
21.4% (239)Illinois:
14.5% (834,444)
8:30am: Cairo:
13.3% (149)Illinois:
10.2% (588,282)
9am: Cairo:
3.6% (40)Illinois:
4.6% (266,648)
10am: Cairo:
3.9% (44)Illinois:
4.7% (269,854)
11am: Cairo:
0.5% (6)Illinois:
2.1% (118,418)
12pm: Cairo:
2.6% (29)Illinois:
1.0% (59,913)
4pm: Cairo:
10.6% (119)Illinois:
7.4% (425,049)
>4pm: Cairo:
8.9% (99)Illinois:
6.8% (393,506)
12:00 a.m. to 4:59 a.m. - Males: Cairo:
24.1% (68)Illinois:
7.8% (217,984)
6:30 a.m. to 6:59 a.m. - Males: Cairo:
18.8% (53)Illinois:
9.4% (261,362)
7:00 a.m. to 7:29 a.m. - Males: Cairo:
8.9% (25)Illinois:
12.9% (360,098)
7:30 a.m. to 7:59 a.m. - Males: Cairo:
26.1% (74)Illinois:
9.5% (265,464)
8:00 a.m. to 8:29 a.m. - Males: Cairo:
15.9% (45)Illinois:
10.1% (280,890)
8:30 a.m. to 8:59 a.m. - Males: Cairo:
1.8% (5)Illinois:
4.4% (122,100)
12:00 p.m. to 3:59 p.m. - Males: Cairo:
4.5% (13)Illinois:
8.0% (224,733)
4:00 p.m. to 11:59 p.m. - Males: Cairo:
2.0% (6)Illinois:
6.4% (179,820)
12:00 a.m. to 4:59 a.m. - Females: Cairo:
12.4% (23)Illinois:
3.9% (95,401)
6:30 a.m. to 6:59 a.m. - Females: Cairo:
5.9% (11)Illinois:
9.2% (222,938)
7:00 a.m. to 7:29 a.m. - Females: Cairo:
13.0% (25)Illinois:
16.0% (386,700)
7:30 a.m. to 7:59 a.m. - Females: Cairo:
35.4% (67)Illinois:
13.7% (331,772)
8:00 a.m. to 8:29 a.m. - Females: Cairo:
25.7% (49)Illinois:
12.6% (304,920)
12:00 p.m. to 3:59 p.m. - Females: Cairo:
4.3% (8)Illinois:
7.1% (172,395)
4:00 p.m. to 11:59 p.m. - Females: Cairo:
4.4% (8)Illinois:
6.2% (148,872)
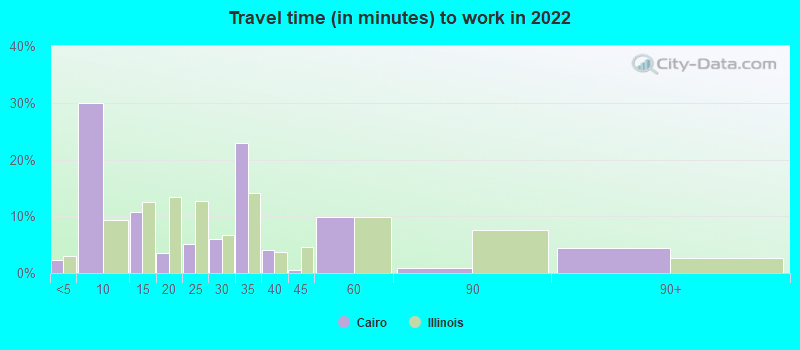
Travel time to work Percentage of workers working in this county: 52.5%Number of people working at home: 6 (1.2% of all workers )
Less than 5 minutes: Cairo:
2.3% (11)Illinois:
2.9% (151,500)
5 to 9 minutes: Cairo:
30.0% (148)Illinois:
9.3% (484,780)
10 to 14 minutes: Cairo:
10.7% (53)Illinois:
12.6% (654,154)
15 to 19 minutes: Cairo:
3.6% (18)Illinois:
13.4% (697,690)
20 to 24 minutes: Cairo:
5.1% (25)Illinois:
12.7% (661,266)
25 to 29 minutes: Cairo:
6.0% (29)Illinois:
6.6% (345,772)
30 to 34 minutes: Cairo:
22.9% (113)Illinois:
14.0% (729,633)
35 to 39 minutes: Cairo:
4.1% (20)Illinois:
3.6% (189,131)
40 to 44 minutes: Cairo:
0.6% (3)Illinois:
4.6% (241,655)
45 to 59 minutes: Cairo:
9.9% (49)Illinois:
9.9% (515,517)
60 to 89 minutes: Cairo:
0.9% (5)Illinois:
7.5% (392,412)
90 or more minutes: Cairo:
4.4% (22)Illinois:
2.7% (139,001)
Less than 5 minutes: Cairo:
17.3% (193)Illinois:
3.2% (183,600)
5 to 9 minutes: Cairo:
26.8% (300)Illinois:
10.2% (587,746)
10 to 14 minutes: Cairo:
17.4% (194)Illinois:
12.9% (743,149)
15 to 19 minutes: Cairo:
7.3% (82)Illinois:
13.0% (748,578)
20 to 24 minutes: Cairo:
7.7% (86)Illinois:
12.2% (703,743)
25 to 29 minutes: Cairo:
3.0% (33)Illinois:
5.2% (298,361)
30 to 34 minutes: Cairo:
1.9% (21)Illinois:
12.9% (741,188)
35 to 39 minutes: Cairo:
1.8% (20)Illinois:
2.9% (165,521)
40 to 44 minutes: Cairo:
6.5% (73)Illinois:
4.3% (244,350)
45 to 59 minutes: Cairo:
7.2% (80)Illinois:
9.6% (551,290)
60 to 89 minutes: Cairo:
2.6% (29)Illinois:
7.5% (432,921)
90 or more minutes: Cairo:
0.6% (7)Illinois:
2.9% (168,793)
Less than 5 minutes - Males: Cairo:
1.5% (5)Illinois:
2.6% (74,189)
5 to 9 minutes - Males: Cairo:
27.1% (84)Illinois:
8.4% (236,590)
10 to 14 minutes - Males: Cairo:
10.8% (33)Illinois:
11.7% (327,032)
15 to 19 minutes - Males: Cairo:
5.4% (17)Illinois:
12.6% (352,436)
20 to 24 minutes - Males: Cairo:
7.8% (24)Illinois:
12.7% (354,987)
25 to 29 minutes - Males: Cairo:
5.5% (17)Illinois:
6.6% (186,300)
30 to 34 minutes - Males: Cairo:
25.5% (79)Illinois:
14.4% (404,047)
35 to 39 minutes - Males: Cairo:
6.6% (21)Illinois:
3.8% (105,284)
45 to 59 minutes - Males: Cairo:
4.5% (14)Illinois:
10.7% (299,173)
90 or more minutes - Males: Cairo:
6.3% (20)Illinois:
3.1% (85,766)
Less than 5 minutes - Females: Cairo:
3.8% (7)Illinois:
3.2% (77,311)
5 to 9 minutes - Females: Cairo:
35.0% (64)Illinois:
10.3% (248,190)
10 to 14 minutes - Females: Cairo:
10.7% (20)Illinois:
13.6% (327,122)
15 to 19 minutes - Females: Cairo:
0.5% (1)Illinois:
14.4% (345,254)
20 to 24 minutes - Females: Cairo:
1.0% (2)Illinois:
12.8% (306,279)
25 to 29 minutes - Females: Cairo:
6.8% (13)Illinois:
6.6% (159,472)
30 to 34 minutes - Females: Cairo:
18.4% (34)Illinois:
13.6% (325,586)
40 to 44 minutes - Females: Cairo:
1.5% (3)Illinois:
4.4% (104,545)
45 to 59 minutes - Females: Cairo:
18.8% (35)Illinois:
9.0% (216,344)
60 to 89 minutes - Females: Cairo:
2.4% (4)Illinois:
6.4% (153,574)
90 or more minutes - Females: Cairo:
1.0% (2)Illinois:
2.2% (53,235)
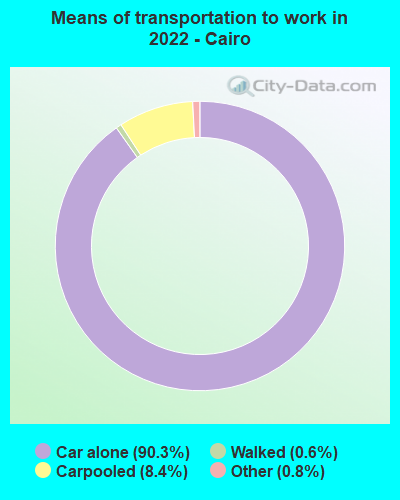
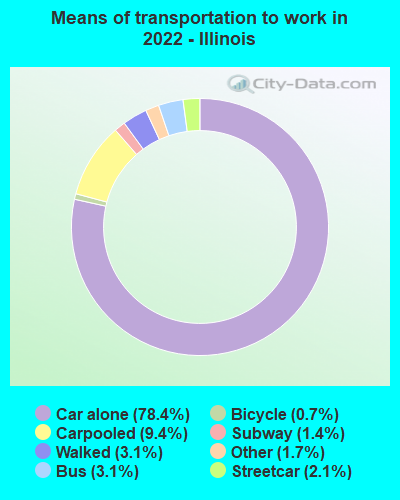
Means of transportation to work Drove car alone: Cairo:
90.3% (465)Illinois:
78.4% (1,864,540)
Carpooled: Cairo:
8.4% (43)Illinois:
9.4% (240,564)
Walked: Cairo:
0.6% (3)Illinois:
3.1% (75,886)
Other means: Cairo:
0.8% (4)Illinois:
1.7% (40,328)
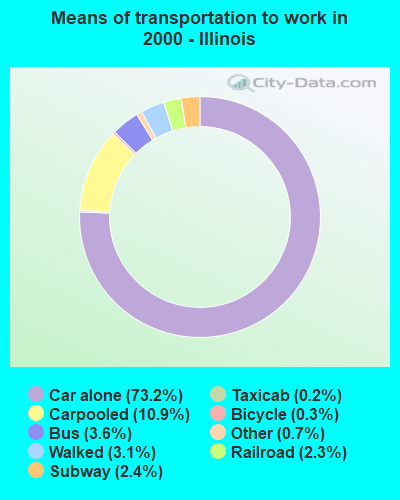
Drove car alone: Cairo:
74.5% (833)Illinois:
73.2% (4,207,339)
Carpooled: Cairo:
15.4% (172)Illinois:
10.9% (625,411)
Bus or trolley bus: Cairo:
1.3% (14)Illinois:
3.6% (207,517)
Bicycle: Cairo:
0.8% (9)Illinois:
0.3% (18,406)
Walked: Cairo:
7.4% (83)Illinois:
3.1% (180,119)
Other means: Cairo:
0.6% (7)Illinois:
0.7% (37,823)
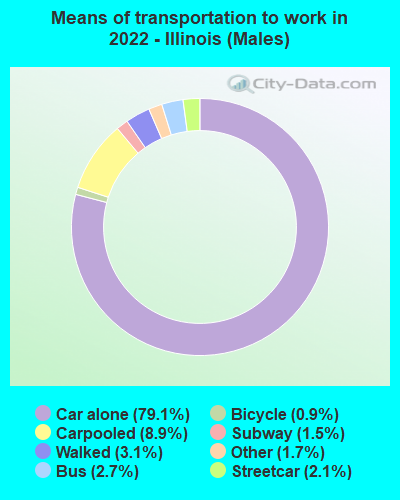
Drove car alone - Males: Cairo:
86.6% (278)Illinois:
79.1% (1,864,540)
Carpooled - Males: Cairo:
11.2% (36)Illinois:
8.9% (240,564)
Walked - Males: Cairo:
0.9% (3)Illinois:
3.1% (75,886)
Other means - Males: Cairo:
1.2% (4)Illinois:
1.7% (40,328)
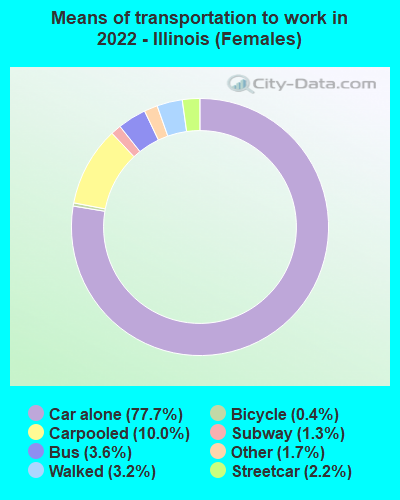
Drove car alone - Females: Cairo:
96.4% (187)Illinois:
77.7% (1,864,540)
Carpooled - Females: Cairo:
3.6% (7)Illinois:
10.0% (240,564)
Private vehicle occupancy Drove alone: Cairo:
95.7% (428)Illinois:
89.3% (4,089,987)
In 2 person carpool: Cairo:
3.8% (17)Illinois:
7.9% (361,887)
Drove alone: Cairo:
82.9% (833)Illinois:
87.1% (4,207,339)
In 2 person carpool: Cairo:
11.8% (119)Illinois:
10.0% (484,652)
In 3 person carpool: Cairo:
2.8% (28)Illinois:
1.7% (84,139)
In 4 person carpool: Cairo:
1.6% (16)Illinois:
0.6% (30,865)
In 7+ person carpool: Cairo:
0.9% (9)Illinois:
0.2% (10,268)
Class of workers
Employee of private company: Cairo:
63.0% (314)Illinois:
68.3% (4,298,982)
Self-employed in own incorporated business: Cairo:
1.8% (9)Illinois:
4.3% (267,866)
Private not-for-profit wage and salary workers: Cairo:
6.4% (32)Illinois:
9.5% (597,909)
Local government workers: Cairo:
22.1% (110)Illinois:
7.8% (491,805)
State government workers: Cairo:
4.2% (21)Illinois:
3.3% (207,590)
Federal government workers: Cairo:
2.0% (10)Illinois:
1.9% (122,680)
Self-employed workers in own not incorporated business: Cairo:
0.4% (2)Illinois:
4.7% (295,989)
Employee of private company: Cairo:
56.5% (645)Illinois:
70.3% (4,102,786)
Self-employed in own incorporated business: Cairo:
3.9% (45)Illinois:
3.2% (184,981)
Private not-for-profit wage and salary workers: Cairo:
7.5% (86)Illinois:
8.3% (484,163)
Local government workers: Cairo:
14.2% (162)Illinois:
6.8% (395,132)
State government workers: Cairo:
8.7% (99)Illinois:
3.8% (220,995)
Federal government workers: Cairo:
3.0% (34)Illinois:
2.1% (121,776)
Self-employed workers in own not incorporated business: Cairo:
5.4% (62)Illinois:
5.3% (307,691)
Unpaid family workers: Cairo:
0.7% (8)Illinois:
0.3% (15,661)
Employee of private company - Males: Cairo:
69.7% (207)Illinois:
72.3% (2,390,375)
Local government workers - Males: Cairo:
26.9% (80)Illinois:
5.9% (193,630)
Federal government workers - Males: Cairo:
3.4% (10)Illinois:
2.0% (64,842)
Employee of private company - Females: Cairo:
53.0% (106)Illinois:
63.9% (1,908,607)
Self-employed in own incorporated business - Females: Cairo:
4.5% (9)Illinois:
2.9% (88,045)
Private not-for-profit wage and salary workers - Females: Cairo:
16.0% (32)Illinois:
13.1% (392,281)
Local government workers - Females: Cairo:
15.0% (30)Illinois:
10.0% (298,175)
State government workers - Females: Cairo:
10.5% (21)Illinois:
3.6% (108,656)
Self-employed workers in own not incorporated business - Females: Cairo:
1.0% (2)Illinois:
4.3% (128,324)