Work and Jobs in Cedar Glen Lakes, New Jersey (NJ) Detailed Stats
Data:
Unemployment (%)
Unemployment (% change since 2000)
Unemployment (%) - White
Unemployment (% change since 2000) - White
Unemployment (%) - Black or African American
Unemployment (% change since 2000) - Black or African American
Unemployment (%) - Asian
Unemployment (% change since 2000) - Asian
Unemployment (%) - Hispanic or Latino
Unemployment (% change since 2000) - Hispanic or Latino
Unemployment (%) - American Indian and Alaska Native
Unemployment (% change since 2000) - American Indian and Alaska Native
Unemployment (%) - Multirace
Unemployment (% change since 2000) - Multirace
Unemployment (%) - Other Race
Unemployment (% change since 2000) - Other Race
Industry diversity
Most Common Industries - Agriculture, forestry, fishing and hunting, and mining (%)
Most Common Industries - Agriculture, forestry, fishing and hunting (%)
Most Common Industries - Mining, quarrying, and oil and gas extraction (%)
Most Common Industries - Construction (%)
Most Common Industries - Manufacturing (%)
Most Common Industries - Wholesale trade (%)
Most Common Industries - Retail trade (%)
Most Common Industries - Transportation and warehousing, and utilities (%)
Most Common Industries - Transportation and warehousing (%)
Most Common Industries - Utilities (%)
Most Common Industries - Information (%)
Most Common Industries - Finance and insurance, and real estate and rental and leasing (%)
Most Common Industries - Finance and insurance (%)
Most Common Industries - Real estate and rental and leasing (%)
Most Common Industries - Professional, scientific, and management, and administrative and waste management services (%)
Most Common Industries - Professional, scientific, and technical services (%)
Most Common Industries - Management of companies and enterprises (%)
Most Common Industries - Administrative and support and waste management services (%)
Most Common Industries - Educational services, and health care and social assistance (%)
Most Common Industries - Educational services (%)
Most Common Industries - Health care and social assistance (%)
Most Common Industries - Arts, entertainment, and recreation, and accommodation and food services (%)
Most Common Industries - Arts, entertainment, and recreation (%)
Most Common Industries - Accommodation and food services (%)
Most Common Industries - Other services, except public administration (%)
Most Common Industries - Public administration (%)
Occupation diversity
Most Common Occupations - Management, business, science, and arts occupations (%)
Most Common Occupations - Management, business, and financial occupations (%)
Most Common Occupations - Management occupations (%)
Most Common Occupations - Business and financial operations occupations (%)
Most Common Occupations - Computer, engineering, and science occupations (%)
Most Common Occupations - Computer and mathematical occupations (%)
Most Common Occupations - Architecture and engineering occupations (%)
Most Common Occupations - Life, physical, and social science occupations (%)
Most Common Occupations - Education, legal, community service, arts, and media occupations (%)
Most Common Occupations - Community and social service occupations (%)
Most Common Occupations - Legal occupations (%)
Most Common Occupations - Education, training, and library occupations (%)
Most Common Occupations - Arts, design, entertainment, sports, and media occupations (%)
Most Common Occupations - Healthcare practitioners and technical occupations (%)
Most Common Occupations - Health diagnosing and treating practitioners and other technical occupations (%)
Most Common Occupations - Health technologists and technicians (%)
Most Common Occupations - Service occupations (%)
Most Common Occupations - Healthcare support occupations (%)
Most Common Occupations - Protective service occupations (%)
Most Common Occupations - Fire fighting and prevention, and other protective service workers including supervisors (%)
Most Common Occupations - Law enforcement workers including supervisors (%)
Most Common Occupations - Food preparation and serving related occupations (%)
Most Common Occupations - Building and grounds cleaning and maintenance occupations (%)
Most Common Occupations - Personal care and service occupations (%)
Most Common Occupations - Sales and office occupations (%)
Most Common Occupations - Sales and related occupations (%)
Most Common Occupations - Office and administrative support occupations (%)
Most Common Occupations - Natural resources, construction, and maintenance occupations (%)
Most Common Occupations - Farming, fishing, and forestry occupations (%)
Most Common Occupations - Construction and extraction occupations (%)
Most Common Occupations - Installation, maintenance, and repair occupations (%)
Most Common Occupations - Production, transportation, and material moving occupations (%)
Most Common Occupations - Production occupations (%)
Most Common Occupations - Transportation occupations (%)
Most Common Occupations - Material moving occupations (%)
Private vehicle occupancy - Drove alone (% change since 2000)
Private vehicle occupancy - Carpooled (%)
Private vehicle occupancy - Carpooled (% change since 2000)
Private vehicle occupancy - In 2-person carpool (%)
Private vehicle occupancy - In 2-person carpool (% change since 2000)
Private vehicle occupancy - In 3-person carpool (%)
Private vehicle occupancy - In 3-person carpool (% change since 2000)
Private vehicle occupancy - In 4-person carpool (%)
Private vehicle occupancy - In 4-person carpool (% change since 2000)
Private vehicle occupancy - In 5- or 6-person carpool (%)
Private vehicle occupancy - In 5- or 6-person carpool (% change since 2000)
Private vehicle occupancy - In 7-or-more-person carpool (%)
Private vehicle occupancy - In 7-or-more-person carpool (% change since 2000)
Time Leaving Home To Go To Work - 12:00 a.m. to 4:59 a.m. (%)
Time Leaving Home To Go To Work - 12:00 a.m. to 4:59 a.m. (% change since 2000)
Time Leaving Home To Go To Work - 5:00 a.m. to 5:59 a.m. (%)
Time Leaving Home To Go To Work - 5:00 a.m. to 5:59 a.m. (% change since 2000)
Time Leaving Home To Go To Work - 6:00 a.m. to 6:59 a.m. (%)
Time Leaving Home To Go To Work - 6:00 a.m. to 6:59 a.m. (% change since 2000)
Time Leaving Home To Go To Work - 7:00 a.m. to 7:59 a.m. (%)
Time Leaving Home To Go To Work - 7:00 a.m. to 7:59 a.m. (% change since 2000)
Time Leaving Home To Go To Work - 8:00 a.m. to 8:59 a.m. (%)
Time Leaving Home To Go To Work - 8:00 a.m. to 8:59 a.m. (% change since 2000)
Time Leaving Home To Go To Work - 9:00 a.m. to 9:59 a.m. (%)
Time Leaving Home To Go To Work - 9:00 a.m. to 9:59 a.m. (% change since 2000)
Time Leaving Home To Go To Work - 10:00 a.m. to 10:59 a.m. (%)
Time Leaving Home To Go To Work - 10:00 a.m. to 10:59 a.m. (% change since 2000)
Time Leaving Home To Go To Work - 11:00 a.m. to 11:59 a.m. (%)
Time Leaving Home To Go To Work - 11:00 a.m. to 11:59 a.m. (% change since 2000)
Time Leaving Home To Go To Work - 12:00 p.m. to 3:59 p.m. (%)
Time Leaving Home To Go To Work - 12:00 p.m. to 3:59 p.m. (% change since 2000)
Time Leaving Home To Go To Work - 4:00 p.m. to 11:59 p.m. (%)
Time Leaving Home To Go To Work - 4:00 p.m. to 11:59 p.m. (% change since 2000)
Class of Workers - Employee of private company (%)
Class of Workers - Employee of private company (% change since 2000)
Class of Workers - Self-employed in own incorporated business (%)
Class of Workers - Self-employed in own incorporated business (% change since 2000)
Class of Workers - Private not-for-profit wage and salary workers (%)
Class of Workers - Private not-for-profit wage and salary workers (% change since 2000)
Class of Workers - Local government workers (%)
Class of Workers - Local government workers (% change since 2000)
Class of Workers - State government workers (%)
Class of Workers - State government workers (% change since 2000)
Class of Workers - Federal government workers (%)
Class of Workers - Federal government workers (% change since 2000)
Class of Workers - Self-employed workers in own not incorporated business and Unpaid family workers (%)
Class of Workers - Self-employed workers in own not incorporated business and Unpaid family workers (% change since 2000)
Means of transportation to work - Drove car alone (%)
Means of transportation to work - Drove car alone (% change since 2000)
Means of transportation to work - Carpooled (%)
Means of transportation to work - Carpooled (% change since 2000)
Means of transportation to work - Public transportation (%)
Means of transportation to work - Public transportation (% change since 2000)
Means of transportation to work - Bus or trolley bus (%)
Means of transportation to work - Bus or trolley bus (% change since 2000)
Means of transportation to work - Streetcar or trolley car (%)
Means of transportation to work - Streetcar or trolley car (% change since 2000)
Means of transportation to work - Subway or elevated (%)
Means of transportation to work - Subway or elevated (% change since 2000)
Means of transportation to work - Railroad (%)
Means of transportation to work - Railroad (% change since 2000)
Means of transportation to work - Ferryboat (%)
Means of transportation to work - Ferryboat (% change since 2000)
Means of transportation to work - Taxicab (%)
Means of transportation to work - Taxicab (% change since 2000)
Means of transportation to work - Motorcycle (%)
Means of transportation to work - Motorcycle (% change since 2000)
Means of transportation to work - Bicycle (%)
Means of transportation to work - Bicycle (% change since 2000)
Means of transportation to work - Walked (%)
Means of transportation to work - Walked (% change since 2000)
Means of transportation to work - Other means (%)
Means of transportation to work - Other means (% change since 2000)
Working at home (%)
Working at home (% change since 2000)
Travel time to work - Less than 5 minutes (%)
Travel time to work - Less than 5 minutes (% change since 2000)
Travel time to work - 5 to 9 minutes (%)
Travel time to work - 5 to 9 minutes (% change since 2000)
Travel time to work - 10 to 19 minutes (%)
Travel time to work - 10 to 19 minutes (% change since 2000)
Travel time to work - 20 to 29 minutes (%)
Travel time to work - 20 to 29 minutes (% change since 2000)
Travel time to work - 30 to 39 minutes (%)
Travel time to work - 30 to 39 minutes (% change since 2000)
Travel time to work - 40 to 59 minutes (%)
Travel time to work - 40 to 59 minutes (% change since 2000)
Travel time to work - 60 to 89 minutes (%)
Travel time to work - 60 to 89 minutes (% change since 2000)
Travel time to work - 90 or more minutes (%)
Travel time to work - 90 or more minutes (% change since 2000)
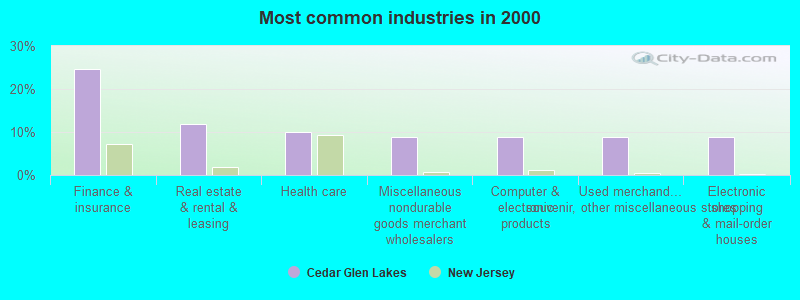
The most common industries in Cedar Glen Lakes are: Finance & insurance (24.8% of civilian employees), Real estate & rental & leasing (11.9% of civilian employees), Health care (9.9% of civilian employees). 41.3% of workers work in Ocean County. 69.8% of workers are employees of private companies, which is about the same as the rate of 68.8% across the entire state of New Jersey.
Whole page based on the data from 2000 / 2022 when the population of Cedar Glen Lakes, New Jersey was 1,617 / 1,500
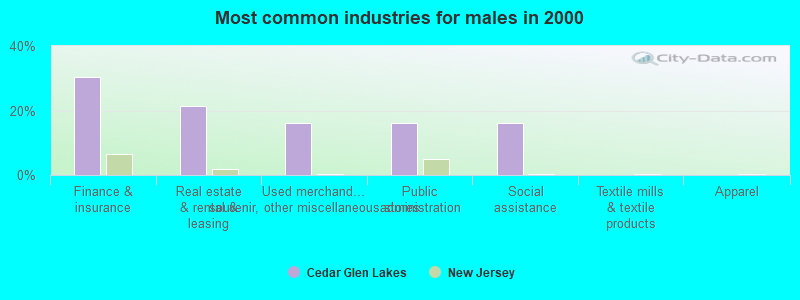
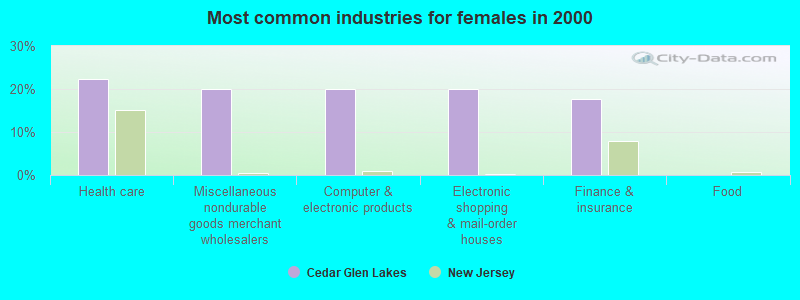
Most common industries
Most common industries Industry All Males Females
Finance and insurance 24.8% 30.4% 17.8% Real estate and rental and leasing 11.9% 21.4% 0.0% Health care 9.9% 0.0% 22.2% Miscellaneous nondurable goods merchant wholesalers 8.9% 0.0% 20.0% Computer and electronic products 8.9% 0.0% 20.0% Used merchandise, gift, novelty, and souvenir, and other miscellaneous stores 8.9% 16.1% 0.0% Electronic shopping and mail-order houses 8.9% 0.0% 20.0% Public administration 8.9% 16.1% 0.0% Social assistance 8.9% 16.1% 0.0%
Unemployment in Cedar Glen Lakes Unemployment by race in 2022
Unemployment rate for White non-Hispanic residents 7.9% Males4.0% FemalesUnemployment rate for Asian residents 100.0% FemalesUnemployment by race in 2000
Unemployment rate for White non-Hispanic residents 26.2% Females
Time leaving home to go to work 5:00 a.m. to 5:29 a.m.: Cedar Glen Lakes:
3.7% (9)New Jersey:
2.8% (107,136)
6:00 a.m. to 6:29 a.m.: Cedar Glen Lakes:
33.0% (83)New Jersey:
7.9% (305,654)
6:30 a.m. to 6:59 a.m.: Cedar Glen Lakes:
10.1% (25)New Jersey:
8.9% (340,440)
7:00 a.m. to 7:29 a.m.: Cedar Glen Lakes:
10.3% (26)New Jersey:
13.9% (534,088)
7:30 a.m. to 7:59 a.m.: Cedar Glen Lakes:
5.9% (15)New Jersey:
12.3% (471,489)
8:00 a.m. to 8:29 a.m.: Cedar Glen Lakes:
4.6% (11)New Jersey:
14.1% (542,061)
9:00 a.m. to 9:59 a.m.: Cedar Glen Lakes:
20.2% (51)New Jersey:
8.2% (315,306)
10:00 a.m. to 10:59 a.m.: Cedar Glen Lakes:
3.7% (9)New Jersey:
3.2% (121,390)
12:00 p.m. to 3:59 p.m.: Cedar Glen Lakes:
2.9% (7)New Jersey:
6.2% (238,009)
4:00 p.m. to 11:59 p.m.: Cedar Glen Lakes:
6.9% (17)New Jersey:
5.6% (215,268)
<5am: Cedar Glen Lakes:
7.9% (8)New Jersey:
2.4% (92,776)
6:30am: Cedar Glen Lakes:
17.8% (18)New Jersey:
7.7% (297,494)
7am: Cedar Glen Lakes:
20.8% (21)New Jersey:
9.5% (369,088)
7:30am: Cedar Glen Lakes:
17.8% (18)New Jersey:
14.4% (558,435)
8am: Cedar Glen Lakes:
9.9% (10)New Jersey:
15.3% (592,839)
8:30am: Cedar Glen Lakes:
16.8% (17)New Jersey:
14.0% (541,137)
10am: Cedar Glen Lakes:
8.9% (9)New Jersey:
6.4% (246,745)
5:00 a.m. to 5:29 a.m. - Males: Cedar Glen Lakes:
17.3% (11)New Jersey:
4.0% (82,885)
7:00 a.m. to 7:29 a.m. - Males: Cedar Glen Lakes:
25.6% (17)New Jersey:
14.0% (288,907)
7:30 a.m. to 7:59 a.m. - Males: Cedar Glen Lakes:
23.4% (15)New Jersey:
10.9% (224,409)
10:00 a.m. to 10:59 a.m. - Males: Cedar Glen Lakes:
4.5% (3)New Jersey:
2.8% (58,200)
4:00 p.m. to 11:59 p.m. - Males: Cedar Glen Lakes:
30.6% (20)New Jersey:
5.7% (117,720)
6:00 a.m. to 6:29 a.m. - Females: Cedar Glen Lakes:
45.6% (85)New Jersey:
5.9% (105,203)
6:30 a.m. to 6:59 a.m. - Females: Cedar Glen Lakes:
12.1% (23)New Jersey:
8.3% (149,072)
7:00 a.m. to 7:29 a.m. - Females: Cedar Glen Lakes:
5.1% (9)New Jersey:
13.7% (245,181)
8:00 a.m. to 8:29 a.m. - Females: Cedar Glen Lakes:
6.3% (12)New Jersey:
16.2% (290,093)
9:00 a.m. to 9:59 a.m. - Females: Cedar Glen Lakes:
31.0% (58)New Jersey:
9.3% (166,349)
10:00 a.m. to 10:59 a.m. - Females: Cedar Glen Lakes:
3.4% (6)New Jersey:
3.5% (63,190)
12:00 p.m. to 3:59 p.m. - Females: Cedar Glen Lakes:
3.9% (7)New Jersey:
6.2% (111,338)
Travel time to work Percentage of workers working in this county: 41.3%
10 to 14 minutes: Cedar Glen Lakes:
8.9% (9)New Jersey:
12.5% (482,988)
15 to 19 minutes: Cedar Glen Lakes:
16.8% (17)New Jersey:
13.2% (510,571)
25 to 29 minutes: Cedar Glen Lakes:
27.7% (28)New Jersey:
5.4% (210,226)
30 to 34 minutes: Cedar Glen Lakes:
17.8% (18)New Jersey:
12.7% (492,539)
45 to 59 minutes: Cedar Glen Lakes:
20.8% (21)New Jersey:
9.1% (352,609)
90 or more minutes: Cedar Glen Lakes:
7.9% (8)New Jersey:
4.5% (175,142)
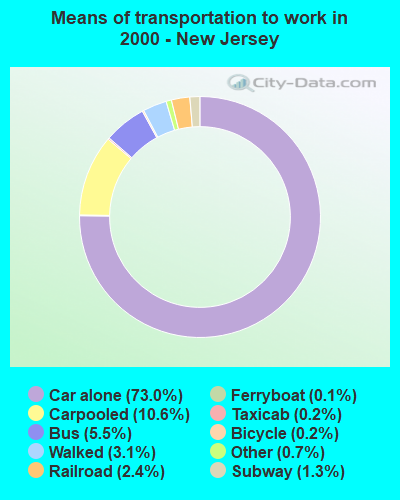
Means of transportation to work Drove car alone: Cedar Glen Lakes:
62.4% (63)New Jersey:
73.0% (2,828,303)
Carpooled: Cedar Glen Lakes:
29.7% (30)New Jersey:
10.6% (412,299)
Bus or trolley bus: Cedar Glen Lakes:
7.9% (8)New Jersey:
5.5% (213,067)
Private vehicle occupancy Drove alone: Cedar Glen Lakes:
94.2% (236)New Jersey:
88.1% (2,840,182)
In 2 person carpool: Cedar Glen Lakes:
4.4% (11)New Jersey:
8.5% (274,126)
Drove alone: Cedar Glen Lakes:
67.7% (63)New Jersey:
87.3% (2,828,303)
In 2 person carpool: Cedar Glen Lakes:
32.3% (30)New Jersey:
9.6% (311,146)
Class of workers
Employee of private company: Cedar Glen Lakes:
69.8% (190)New Jersey:
68.8% (3,236,727)
Local government workers: Cedar Glen Lakes:
10.4% (28)New Jersey:
8.4% (397,465)
Federal government workers: Cedar Glen Lakes:
14.6% (40)New Jersey:
2.0% (94,493)
Self-employed workers in own not incorporated business: Cedar Glen Lakes:
5.2% (14)New Jersey:
4.7% (223,359)
Employee of private company: Cedar Glen Lakes:
65.3% (66)New Jersey:
70.6% (2,789,718)
Private not-for-profit wage and salary workers: Cedar Glen Lakes:
8.9% (9)New Jersey:
6.4% (254,203)
Local government workers: Cedar Glen Lakes:
8.9% (9)New Jersey:
7.9% (311,080)
Federal government workers: Cedar Glen Lakes:
16.8% (17)New Jersey:
2.2% (88,294)
Employee of private company - Males: Cedar Glen Lakes:
100.0% (72)New Jersey:
72.0% (1,792,593)
Employee of private company - Females: Cedar Glen Lakes:
58.9% (118)New Jersey:
65.2% (1,444,134)
Local government workers - Females: Cedar Glen Lakes:
14.2% (28)New Jersey:
10.9% (241,361)
Federal government workers - Females: Cedar Glen Lakes:
19.8% (40)New Jersey:
1.6% (35,056)
Self-employed workers in own not incorporated business - Females: Cedar Glen Lakes:
7.1% (14)New Jersey:
4.1% (91,332)