Work and Jobs in Charlestown, Rhode Island (RI) Detailed Stats
Occupations, Industries, Unemployment, Workers, Commute
Settings
X


Recent posts about work in Charlestown, Rhode Island on our local forum with over 2,400,000 registered users:
 | Providence people, will you go to Charlestown for the food trucks? (21 replies) |
| Woman murdered in South Kingstown (51 replies) |
| Coastal Rhode Island for Retirement (46 replies) |
| Rhode Island residential real estate on fire. Up 12%+ over last year. (59 replies) |
| Nordstrom to leave Providence Place (217 replies) |
| Looking to Move to Providence Area (222 replies) |
Latest news about work in Charlestown, RI collected exclusively by city-data.com from local newspapers, TV, and radio stations
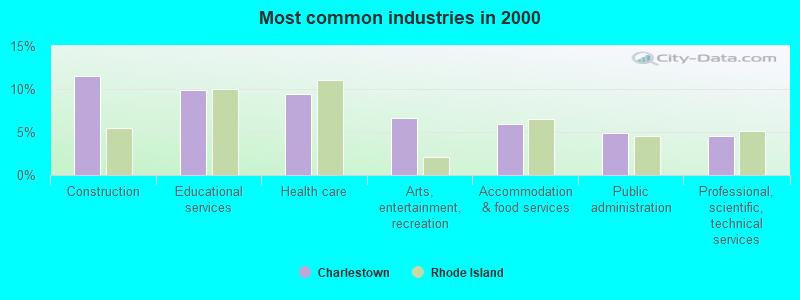
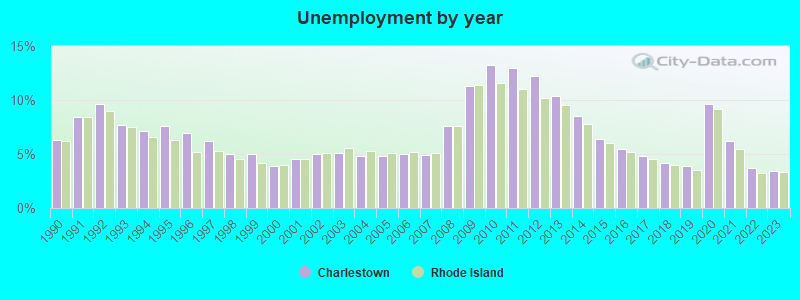
The unemployment rate in 2023 in Charlestown, RI was 3.4%, which was 2.9% greater than the unemployment rate of 3.3% across the entire state of Rhode Island. Compared to the unemployment rate of 10.4% in 2013, this represents a decrease of 205.9%. The most common industries in Charlestown are: Construction (11.5% of civilian employees), Educational services (9.9% of civilian employees), Health care (9.4% of civilian employees). 61.7% of workers are employees of private companies, which is 8.5% less than the rate of 66.9% across the entire state of Rhode Island.
Most common industries
Most common industries | |||
|---|---|---|---|
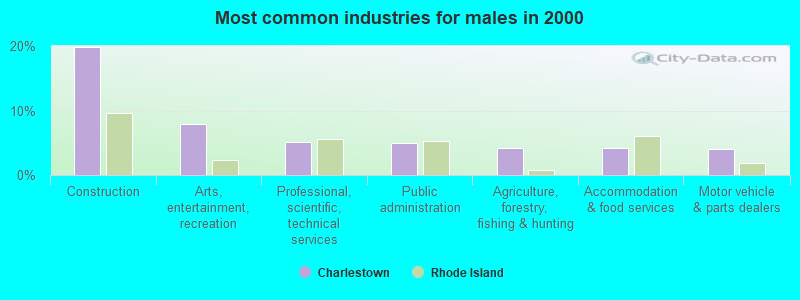
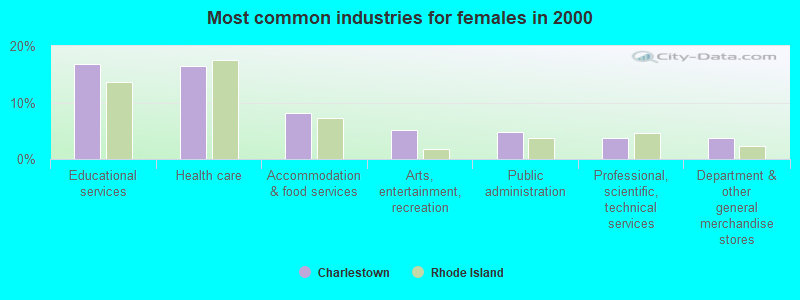
Industry | All | Males | Females |
| Construction | 11.5% (473) | 19.9% (438) | 1.8% (35) |
| Educational services | 9.9% (410) | 3.9% (85) | 16.9% (325) |
| Health care | 9.4% (387) | 3.3% (72) | 16.4% (315) |
| Arts, entertainment, and recreation | 6.6% (273) | 7.9% (174) | 5.1% (99) |
| Accommodation and food services | 6.0% (246) | 4.1% (91) | 8.1% (155) |
| Public administration | 4.8% (200) | 4.9% (108) | 4.8% (92) |
| Professional, scientific, and technical services | 4.5% (186) | 5.2% (114) | 3.7% (72) |
| Textile mills and textile products | 3.1% (129) | 2.6% (58) | 3.7% (71) |
| Finance and insurance | 2.8% (115) | 2.7% (59) | 2.9% (56) |
| Electrical equipment, appliances, and components | 2.7% (113) | 3.0% (67) | 2.4% (46) |
| Motor vehicle and parts dealers | 2.7% (113) | 4.0% (89) | 1.2% (24) |
| Agriculture, forestry, fishing and hunting | 2.4% (100) | 4.2% (92) | 0.4% (8) |
| Food and beverage stores | 2.2% (90) | 2.5% (56) | 1.8% (34) |
| Religious, grantmaking, civic, professional, and similar organizations | 2.2% (90) | 2.0% (44) | 2.4% (46) |
| Department and other general merchandise stores | 1.9% (78) | 0.3% (6) | 3.7% (72) |
| Social assistance | 1.8% (75) | 0.6% (13) | 3.2% (62) |
| Repair and maintenance | 1.7% (69) | 2.5% (55) | 0.7% (14) |
| Administrative and support and waste management services | 1.6% (67) | 2.6% (57) | 0.5% (10) |
| Miscellaneous manufacturing | 1.6% (66) | 1.6% (35) | 1.6% (31) |
| Computer and electronic products | 1.4% (57) | 1.9% (41) | 0.8% (16) |
| Transportation equipment | 1.3% (53) | 2.4% (52) | 0.1% (1) |
| Building material and garden equipment and supplies dealers | 1.1% (47) | 2.1% (47) | 0.0% (0) |
| Plastics and rubber products | 1.1% (47) | 1.5% (32) | 0.8% (15) |
| Chemicals | 1.1% (46) | 0.7% (15) | 1.6% (31) |
| Real estate and rental and leasing | 1.0% (43) | 1.1% (24) | 1.0% (19) |
| Machinery | 0.9% (38) | 1.3% (28) | 0.5% (10) |
| Clothing and accessories, including shoe, stores | 0.9% (36) | 0.0% (0) | 1.9% (36) |
| Personal and laundry services | 0.8% (35) | 0.0% (0) | 1.8% (35) |
| Utilities | 0.8% (34) | 1.3% (29) | 0.3% (5) |
| Other transportation, and support activities, and couriers | 0.8% (31) | 0.5% (12) | 1.0% (19) |
| Truck transportation | 0.7% (28) | 1.0% (21) | 0.4% (7) |
| Food | 0.6% (25) | 0.7% (15) | 0.5% (10) |
| Wood products | 0.6% (25) | 1.1% (25) | 0.0% (0) |
| Publishing, and motion picture and sound recording industries | 0.6% (25) | 0.7% (15) | 0.5% (10) |
| Electronic shopping and mail-order houses | 0.6% (24) | 0.0% (0) | 1.2% (24) |
| Used merchandise, gift, novelty, and souvenir, and other miscellaneous stores | 0.6% (24) | 0.3% (6) | 0.9% (18) |
| U. S. Postal service | 0.5% (21) | 0.1% (2) | 1.0% (19) |
| Book stores and news dealers | 0.5% (21) | 0.0% (0) | 1.1% (21) |
| Groceries and related products merchant wholesalers | 0.5% (21) | 1.0% (21) | 0.0% (0) |
| Furniture and home furnishings, and household appliance stores | 0.4% (18) | 0.5% (11) | 0.4% (7) |
| Private households | 0.4% (18) | 0.0% (0) | 0.9% (18) |
| Metal and metal products | 0.4% (15) | 0.3% (6) | 0.5% (9) |
| Other direct selling establishments | 0.3% (11) | 0.5% (11) | 0.0% (0) |
| Air transportation | 0.3% (11) | 0.0% (0) | 0.6% (11) |
| Jewelry, luggage, and leather goods stores | 0.2% (10) | 0.5% (10) | 0.0% (0) |
| Machinery, equipment, and supplies merchant wholesalers | 0.2% (9) | 0.4% (9) | 0.0% (0) |
| Nonmetallic mineral products | 0.2% (8) | 0.4% (8) | 0.0% (0) |
| Lumber and other construction materials merchant wholesalers | 0.2% (8) | 0.4% (8) | 0.0% (0) |
| Pharmacies and drug stores | 0.2% (8) | 0.1% (2) | 0.3% (6) |
| Gasoline stations | 0.2% (8) | 0.4% (8) | 0.0% (0) |
| Furniture and related product manufacturing | 0.1% (6) | 0.3% (6) | 0.0% (0) |
| Hardware, plumbing and heating equipment, and supplies merchant wholesalers | 0.1% (6) | 0.3% (6) | 0.0% (0) |
| Beverage and tobacco products | 0.1% (5) | 0.2% (5) | 0.0% (0) |
| Retail florists | 0.1% (5) | 0.2% (5) | 0.0% (0) |
| Mining, quarrying, and oil and gas extraction | 0.1% (4) | 0.2% (4) | 0.0% (0) |
| Printing and related support activities | 0.1% (4) | 0.2% (4) | 0.0% (0) |
| Professional and commercial equipment and supplies merchant wholesalers | 0.1% (3) | 0.1% (3) | 0.0% (0) |
Unemployment in Charlestown
- Unemployment by race in 2000
- Unemployment rate for White non-Hispanic residents
- 3.3%Males
- 1.6%Females
Unemployment in 2023:
| Charlestown: | 3.4% |
| Rhode Island: | 3.3% |
Unemployment in 2022:
| Charlestown: | 3.7% |
| Rhode Island: | 3.2% |
Unemployment in 2021:
| Charlestown: | 6.2% |
| Rhode Island: | 5.5% |
Unemployment in 2020:
| Charlestown: | 9.6% |
| Rhode Island: | 9.2% |
Unemployment in 2019:
| Charlestown: | 3.9% |
| Rhode Island: | 3.5% |
Unemployment in 2018:
| Charlestown: | 4.2% |
| Rhode Island: | 4.0% |
Unemployment in 2017:
| Charlestown: | 4.8% |
| Rhode Island: | 4.5% |
Unemployment in 2016:
| Charlestown: | 5.5% |
| Rhode Island: | 5.2% |
Unemployment in 2015:
| Charlestown: | 6.4% |
| Rhode Island: | 6.0% |
Unemployment in 2014:
| Charlestown: | 8.5% |
| Rhode Island: | 7.8% |
Unemployment in 2013:
| Charlestown: | 10.4% |
| Rhode Island: | 9.5% |
Unemployment in 2012:
| Charlestown: | 12.2% |
| Rhode Island: | 10.2% |
Unemployment in 2011:
| Charlestown: | 13.0% |
| Rhode Island: | 11.0% |
Unemployment in 2010:
| Charlestown: | 13.2% |
| Rhode Island: | 11.6% |
Unemployment in 2009:
| Charlestown: | 11.3% |
| Rhode Island: | 11.4% |
Unemployment in 2008:
| Charlestown: | 7.6% |
| Rhode Island: | 7.6% |
Unemployment in 2007:
| Charlestown: | 4.9% |
| Rhode Island: | 5.1% |
Unemployment in 2006:
| Charlestown: | 5.0% |
| Rhode Island: | 5.2% |
Unemployment in 2005:
| Charlestown: | 4.8% |
| Rhode Island: | 5.1% |
Unemployment in 2004:
| Charlestown: | 4.8% |
| Rhode Island: | 5.3% |
Unemployment in 2003:
| Charlestown: | 5.1% |
| Rhode Island: | 5.6% |
Unemployment in 2002:
| Charlestown: | 5.0% |
| Rhode Island: | 5.1% |
Unemployment in 2001:
| Charlestown: | 4.5% |
| Rhode Island: | 4.5% |
Unemployment in 2000:
| Charlestown: | 3.9% |
| Rhode Island: | 4.0% |
Unemployment in 1999:
| Charlestown: | 5.0% |
| Rhode Island: | 4.2% |
Unemployment in 1998:
| Charlestown: | 5.0% |
| Rhode Island: | 4.5% |
Unemployment in 1997:
| Charlestown: | 6.2% |
| Rhode Island: | 5.3% |
Unemployment in 1996:
| Charlestown: | 6.9% |
| Rhode Island: | 5.2% |
Unemployment in 1995:
| Charlestown: | 7.6% |
| Rhode Island: | 6.3% |
Unemployment in 1994:
| Charlestown: | 7.1% |
| Rhode Island: | 6.6% |
Unemployment in 1993:
| Charlestown: | 7.7% |
| Rhode Island: | 7.5% |
Unemployment in 1992:
| Charlestown: | 9.6% |
| Rhode Island: | 9.0% |
Unemployment in 1991:
| Charlestown: | 8.4% |
| Rhode Island: | 8.4% |
Unemployment in 1990:
| Charlestown: | 6.3% |
| Rhode Island: | 6.2% |
Time leaving home to go to work

<5am:
| Charlestown: | 2.7% (110) |
| Rhode Island: | 2.4% (11,721) |
5:30am:
| Charlestown: | 2.8% (112) |
| Rhode Island: | 1.9% (9,427) |
6am:
| Charlestown: | 4.9% (199) |
| Rhode Island: | 3.4% (16,776) |
6:30am:
| Charlestown: | 7.7% (312) |
| Rhode Island: | 7.4% (36,550) |
7am:
| Charlestown: | 13.3% (536) |
| Rhode Island: | 11.2% (55,159) |
7:30am:
| Charlestown: | 13.8% (558) |
| Rhode Island: | 13.7% (67,410) |
8am:
| Charlestown: | 11.6% (466) |
| Rhode Island: | 15.2% (74,686) |
8:30am:
| Charlestown: | 14.2% (574) |
| Rhode Island: | 12.7% (62,164) |
9am:
| Charlestown: | 5.8% (235) |
| Rhode Island: | 6.3% (31,014) |
10am:
| Charlestown: | 4.9% (196) |
| Rhode Island: | 5.5% (26,918) |
11am:
| Charlestown: | 2.9% (115) |
| Rhode Island: | 2.3% (11,126) |
12pm:
| Charlestown: | 1.0% (41) |
| Rhode Island: | 1.1% (5,446) |
4pm:
| Charlestown: | 6.4% (259) |
| Rhode Island: | 7.6% (37,510) |
>4pm:
| Charlestown: | 5.2% (211) |
| Rhode Island: | 6.9% (34,003) |
Travel time to work


Less than 5 minutes:
| Charlestown: | 3.6% (145) |
| Rhode Island: | 3.4% (16,500) |
5 to 9 minutes:
| Charlestown: | 4.0% (163) |
| Rhode Island: | 12.0% (59,005) |
10 to 14 minutes:
| Charlestown: | 10.7% (431) |
| Rhode Island: | 17.3% (85,107) |
15 to 19 minutes:
| Charlestown: | 16.7% (672) |
| Rhode Island: | 17.1% (83,738) |
20 to 24 minutes:
| Charlestown: | 16.9% (681) |
| Rhode Island: | 15.5% (76,224) |
25 to 29 minutes:
| Charlestown: | 4.8% (195) |
| Rhode Island: | 6.2% (30,333) |
30 to 34 minutes:
| Charlestown: | 11.4% (458) |
| Rhode Island: | 10.7% (52,752) |
35 to 39 minutes:
| Charlestown: | 3.6% (144) |
| Rhode Island: | 2.3% (11,163) |
40 to 44 minutes:
| Charlestown: | 5.7% (228) |
| Rhode Island: | 2.7% (13,119) |
45 to 59 minutes:
| Charlestown: | 15.0% (605) |
| Rhode Island: | 5.2% (25,297) |
60 to 89 minutes:
| Charlestown: | 3.8% (154) |
| Rhode Island: | 3.5% (16,992) |
90 or more minutes:
| Charlestown: | 1.2% (48) |
| Rhode Island: | 2.0% (9,680) |
Means of transportation to work

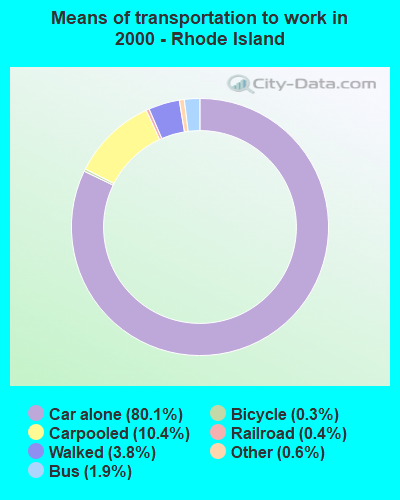
Drove car alone:
| Charlestown: | 84.2% (3,396) |
| Rhode Island: | 80.1% (393,322) |
Carpooled:
| Charlestown: | 9.2% (372) |
| Rhode Island: | 10.4% (51,004) |
Bus or trolley bus:
| Charlestown: | 0.2% (9) |
| Rhode Island: | 1.9% (9,171) |
Subway or elevated:
| Charlestown: | 0.1% (6) |
| Rhode Island: | 0.0% (236) |
Railroad:
| Charlestown: | 0.1% (6) |
| Rhode Island: | 0.4% (2,015) |
Motorcycle:
| Charlestown: | 0.0% (1) |
| Rhode Island: | 0.0% (214) |
Bicycle:
| Charlestown: | 0.5% (19) |
| Rhode Island: | 0.3% (1,338) |
Walked:
| Charlestown: | 2.0% (82) |
| Rhode Island: | 3.8% (18,717) |
Other means:
| Charlestown: | 0.8% (33) |
| Rhode Island: | 0.6% (3,118) |
Private vehicle occupancy

Drove alone:
| Charlestown: | 90.1% (3,396) |
| Rhode Island: | 88.5% (393,322) |
In 2 person carpool:
| Charlestown: | 9.2% (348) |
| Rhode Island: | 9.3% (41,362) |
In 3 person carpool:
| Charlestown: | 0.4% (16) |
| Rhode Island: | 1.3% (5,736) |
In 5-6 person carpool:
| Charlestown: | 0.2% (7) |
| Rhode Island: | 0.3% (1,129) |
In 7+ person carpool:
| Charlestown: | 0.0% (1) |
| Rhode Island: | 0.2% (1,009) |
Class of workers

Employee of private company:
| Charlestown: | 61.7% (2,548) |
| Rhode Island: | 66.9% (335,216) |
Self-employed in own incorporated business:
| Charlestown: | 4.6% (189) |
| Rhode Island: | 3.3% (16,647) |
Private not-for-profit wage and salary workers:
| Charlestown: | 9.5% (393) |
| Rhode Island: | 10.3% (51,704) |
Local government workers:
| Charlestown: | 7.4% (304) |
| Rhode Island: | 6.7% (33,698) |
State government workers:
| Charlestown: | 5.1% (209) |
| Rhode Island: | 4.6% (23,172) |
Federal government workers:
| Charlestown: | 2.4% (98) |
| Rhode Island: | 2.4% (12,228) |
Self-employed workers in own not incorporated business:
| Charlestown: | 9.3% (382) |
| Rhode Island: | 5.4% (26,974) |
Unpaid family workers:
| Charlestown: | 0.1% (6) |
| Rhode Island: | 0.2% (1,092) |

Employee of private company - Males:
| Charlestown: | 65.2% (1,438) |
| Rhode Island: | 69.2% (178,819) |
Self-employed in own incorporated business - Males:
| Charlestown: | 6.1% (135) |
| Rhode Island: | 4.8% (12,406) |
Private not-for-profit wage and salary workers - Males:
| Charlestown: | 4.9% (107) |
| Rhode Island: | 6.5% (16,690) |
Local government workers - Males:
| Charlestown: | 5.1% (112) |
| Rhode Island: | 5.3% (13,791) |
State government workers - Males:
| Charlestown: | 2.9% (64) |
| Rhode Island: | 4.2% (10,825) |
Federal government workers - Males:
| Charlestown: | 2.4% (53) |
| Rhode Island: | 3.1% (8,047) |
Self-employed workers in own not incorporated business - Males:
| Charlestown: | 13.5% (297) |
| Rhode Island: | 6.6% (17,109) |

Employee of private company - Females:
| Charlestown: | 57.7% (1,110) |
| Rhode Island: | 64.5% (156,397) |
Self-employed in own incorporated business - Females:
| Charlestown: | 2.8% (54) |
| Rhode Island: | 1.7% (4,241) |
Private not-for-profit wage and salary workers - Females:
| Charlestown: | 14.9% (286) |
| Rhode Island: | 14.4% (35,014) |
Local government workers - Females:
| Charlestown: | 10.0% (192) |
| Rhode Island: | 8.2% (19,907) |
State government workers - Females:
| Charlestown: | 7.5% (145) |
| Rhode Island: | 5.1% (12,347) |
Federal government workers - Females:
| Charlestown: | 2.3% (45) |
| Rhode Island: | 1.7% (4,181) |
Self-employed workers in own not incorporated business - Females:
| Charlestown: | 4.4% (85) |
| Rhode Island: | 4.1% (9,865) |
Unpaid family workers - Females:
| Charlestown: | 0.3% (6) |
| Rhode Island: | 0.2% (539) |