Work and Jobs in City of The Dalles, Oregon (OR) Detailed Stats
Occupations, Industries, Unemployment, Workers, Commute

Discuss City of The Dalles, Oregon work on our local forum with over 2,400,000 registered users
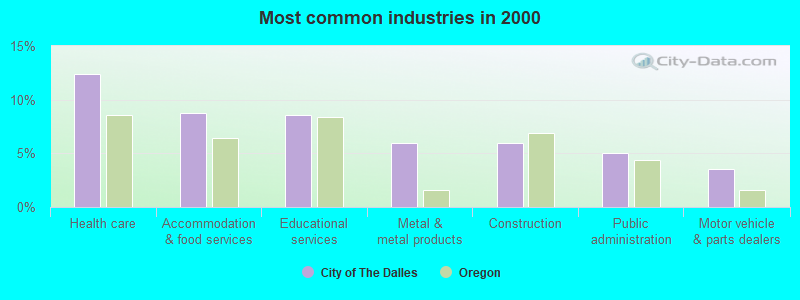
The most common industries in City of The Dalles are: Health care (12.4% of civilian employees), Accommodation & food services (8.7% of civilian employees), Educational services (8.6% of civilian employees). 62.9% of workers are employees of private companies, which is 3.4% less than the rate of 65.1% across the entire state of Oregon.
Most common industries
Most common industries | |||
|---|---|---|---|
Industry | All | Males | Females |
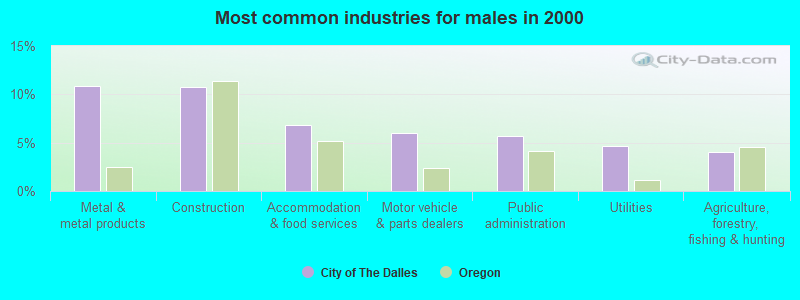
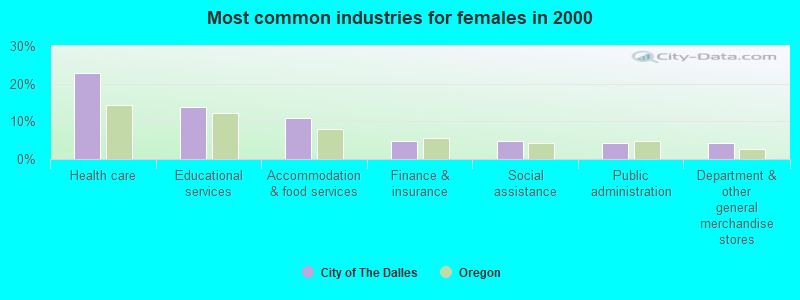
| Health care | 12.4% (666) | 3.0% (85) | 22.7% (581) |
| Accommodation and food services | 8.7% (470) | 6.9% (194) | 10.8% (276) |
| Educational services | 8.6% (463) | 3.9% (109) | 13.8% (354) |
| Metal and metal products | 6.0% (323) | 10.8% (306) | 0.7% (17) |
| Construction | 5.9% (319) | 10.8% (305) | 0.5% (14) |
| Public administration | 5.0% (271) | 5.7% (161) | 4.3% (110) |
| Motor vehicle and parts dealers | 3.6% (193) | 6.0% (169) | 0.9% (24) |
| Finance and insurance | 3.0% (163) | 1.4% (40) | 4.8% (123) |
| Agriculture, forestry, fishing and hunting | 2.6% (141) | 4.1% (115) | 1.0% (26) |
| Utilities | 2.6% (141) | 4.7% (133) | 0.3% (8) |
| Social assistance | 2.5% (134) | 0.4% (11) | 4.8% (123) |
| Administrative and support and waste management services | 2.5% (132) | 2.2% (63) | 2.7% (69) |
| Department and other general merchandise stores | 2.4% (129) | 0.8% (23) | 4.1% (106) |
| Food and beverage stores | 2.4% (127) | 1.8% (52) | 2.9% (75) |
| Repair and maintenance | 2.2% (116) | 3.6% (101) | 0.6% (15) |
| Professional, scientific, and technical services | 1.9% (104) | 1.9% (53) | 2.0% (51) |
| Truck transportation | 1.8% (99) | 3.2% (91) | 0.3% (8) |
| Religious, grantmaking, civic, professional, and similar organizations | 1.8% (96) | 2.2% (61) | 1.4% (35) |
| Real estate and rental and leasing | 1.6% (87) | 1.9% (53) | 1.3% (34) |
| Building material and garden equipment and supplies dealers | 1.6% (86) | 2.3% (64) | 0.9% (22) |
| Food | 1.6% (85) | 1.7% (49) | 1.4% (36) |
| Used merchandise, gift, novelty, and souvenir, and other miscellaneous stores | 1.4% (77) | 1.7% (48) | 1.1% (29) |
| Groceries and related products merchant wholesalers | 1.2% (62) | 1.3% (36) | 1.0% (26) |
| Furniture and home furnishings, and household appliance stores | 1.1% (58) | 1.1% (30) | 1.1% (28) |
| Gasoline stations | 1.0% (56) | 1.4% (39) | 0.7% (17) |
| Arts, entertainment, and recreation | 0.9% (51) | 0.6% (16) | 1.4% (35) |
| Wood products | 0.9% (46) | 1.3% (38) | 0.3% (8) |
| Broadcasting and telecommunications | 0.9% (46) | 0.6% (16) | 1.2% (30) |
| Pharmacies and drug stores | 0.9% (46) | 0.6% (16) | 1.2% (30) |
| Office supplies and stationery stores | 0.7% (38) | 0.7% (19) | 0.7% (19) |
| Personal and laundry services | 0.7% (36) | 0.0% (0) | 1.4% (36) |
| Miscellaneous manufacturing | 0.7% (35) | 1.2% (35) | 0.0% (0) |
| Publishing, and motion picture and sound recording industries | 0.7% (35) | 0.5% (14) | 0.8% (21) |
| Rail transportation | 0.6% (32) | 1.1% (32) | 0.0% (0) |
| Machinery, equipment, and supplies merchant wholesalers | 0.6% (31) | 1.1% (31) | 0.0% (0) |
| Private households | 0.6% (30) | 0.1% (2) | 1.1% (28) |
| Clothing and accessories, including shoe, stores | 0.5% (29) | 0.5% (13) | 0.6% (16) |
| Other transportation, and support activities, and couriers | 0.5% (26) | 0.5% (15) | 0.4% (11) |
| Other direct selling establishments | 0.4% (24) | 0.5% (14) | 0.4% (10) |
| Jewelry, luggage, and leather goods stores | 0.4% (23) | 0.3% (8) | 0.6% (15) |
| Music stores | 0.4% (22) | 0.5% (15) | 0.3% (7) |
| Printing and related support activities | 0.4% (21) | 0.5% (14) | 0.3% (7) |
| Computer and electronic products | 0.4% (20) | 0.3% (8) | 0.5% (12) |
| Alcoholic beverages merchant wholesalers | 0.3% (16) | 0.6% (16) | 0.0% (0) |
| Recyclable material merchant wholesalers | 0.3% (15) | 0.4% (10) | 0.2% (5) |
| Farm product raw materials merchant wholesalers | 0.3% (14) | 0.5% (14) | 0.0% (0) |
| U. S. Postal service | 0.2% (13) | 0.5% (13) | 0.0% (0) |
| Sewing, needlework, and piece goods stores | 0.2% (11) | 0.3% (8) | 0.1% (3) |
| Transportation equipment | 0.2% (11) | 0.3% (9) | 0.1% (2) |
| Apparel | 0.2% (10) | 0.0% (0) | 0.4% (10) |
| Plastics and rubber products | 0.2% (10) | 0.4% (10) | 0.0% (0) |
| Chemicals | 0.2% (9) | 0.3% (9) | 0.0% (0) |
| Mining, quarrying, and oil and gas extraction | 0.2% (9) | 0.0% (0) | 0.4% (9) |
| Radio, TV, and computer stores | 0.1% (8) | 0.0% (0) | 0.3% (8) |
| Vending machine operators | 0.1% (8) | 0.3% (8) | 0.0% (0) |
| Miscellaneous nondurable goods merchant wholesalers | 0.1% (7) | 0.1% (2) | 0.2% (5) |
| Warehousing and storage | 0.1% (7) | 0.2% (7) | 0.0% (0) |
| Data processing, libraries, and other information services | 0.1% (7) | 0.0% (0) | 0.3% (7) |
| Petroleum and petroleum products merchant wholesalers | 0.1% (7) | 0.0% (0) | 0.3% (7) |
| Electronic shopping and mail-order houses | 0.1% (6) | 0.0% (0) | 0.2% (6) |
| Professional and commercial equipment and supplies merchant wholesalers | 0.1% (5) | 0.2% (5) | 0.0% (0) |
| Water transportation | 0.1% (5) | 0.2% (5) | 0.0% (0) |
| Nonmetallic mineral products | 0.1% (5) | 0.2% (5) | 0.0% (0) |
| Sporting goods, camera, and hobby and toy stores | 0.1% (4) | 0.1% (4) | 0.0% (0) |
| Farm supplies merchant wholesalers | 0.1% (4) | 0.1% (4) | 0.0% (0) |
Unemployment in City of The Dalles
- Unemployment by race in 2000
- Unemployment rate for White non-Hispanic residents
- 8.1%Males
- 8.5%Females
- Unemployment rate for Black residents
- 31.6%Males
- Unemployment rate for American Indian and Alaska Native residents
- 19.4%Females
- Unemployment rate for other race residents
- 3.2%Males
- 6.7%Females
- Unemployment rate for two or more race residents
- 54.3%Females
- Unemployment rate for Hispanic or Latino residents
- 2.1%Males
- 11.6%Females
Time leaving home to go to work
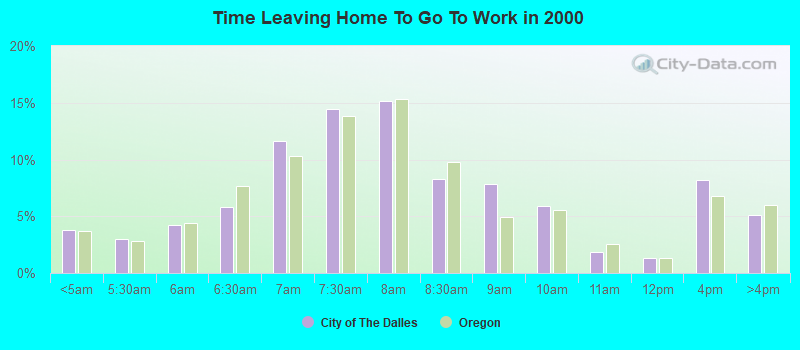
<5am:
| City of The Dalles: | 3.8% (202) |
| Oregon: | 3.7% (58,821) |
5:30am:
| City of The Dalles: | 3.0% (159) |
| Oregon: | 2.8% (44,872) |
6am:
| City of The Dalles: | 4.2% (223) |
| Oregon: | 4.4% (71,163) |
6:30am:
| City of The Dalles: | 5.8% (305) |
| Oregon: | 7.7% (122,707) |
7am:
| City of The Dalles: | 11.6% (614) |
| Oregon: | 10.3% (165,185) |
7:30am:
| City of The Dalles: | 14.5% (765) |
| Oregon: | 13.9% (222,209) |
8am:
| City of The Dalles: | 15.2% (800) |
| Oregon: | 15.3% (245,415) |
8:30am:
| City of The Dalles: | 8.3% (439) |
| Oregon: | 9.8% (156,781) |
9am:
| City of The Dalles: | 7.8% (414) |
| Oregon: | 4.9% (78,436) |
10am:
| City of The Dalles: | 5.9% (312) |
| Oregon: | 5.5% (88,783) |
11am:
| City of The Dalles: | 1.8% (96) |
| Oregon: | 2.6% (41,539) |
12pm:
| City of The Dalles: | 1.4% (72) |
| Oregon: | 1.3% (20,765) |
4pm:
| City of The Dalles: | 8.2% (431) |
| Oregon: | 6.8% (108,927) |
>4pm:
| City of The Dalles: | 5.2% (272) |
| Oregon: | 6.0% (95,989) |
Travel time to work
Daytime population change due to commuting: +1,763 (+14.5%)
Workers who live and work in this city: 3,735 (70.7%)
Workers who live and work in this city: 3,735 (70.7%)
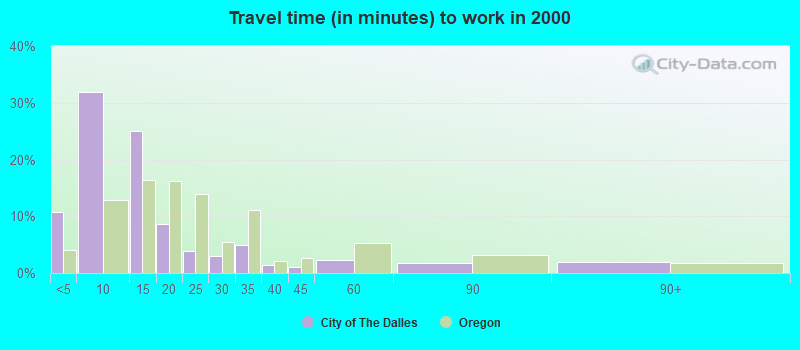
Less than 5 minutes:
| City of The Dalles: | 10.8% (570) |
| Oregon: | 4.1% (66,369) |
5 to 9 minutes:
| City of The Dalles: | 31.9% (1,685) |
| Oregon: | 12.9% (206,168) |
10 to 14 minutes:
| City of The Dalles: | 25.1% (1,326) |
| Oregon: | 16.5% (263,466) |
15 to 19 minutes:
| City of The Dalles: | 8.6% (455) |
| Oregon: | 16.1% (258,476) |
20 to 24 minutes:
| City of The Dalles: | 3.9% (207) |
| Oregon: | 13.9% (223,370) |
25 to 29 minutes:
| City of The Dalles: | 3.0% (158) |
| Oregon: | 5.4% (87,147) |
30 to 34 minutes:
| City of The Dalles: | 4.9% (257) |
| Oregon: | 11.0% (176,763) |
35 to 39 minutes:
| City of The Dalles: | 1.4% (76) |
| Oregon: | 2.0% (32,680) |
40 to 44 minutes:
| City of The Dalles: | 1.1% (60) |
| Oregon: | 2.7% (43,262) |
45 to 59 minutes:
| City of The Dalles: | 2.2% (117) |
| Oregon: | 5.2% (83,858) |
60 to 89 minutes:
| City of The Dalles: | 1.7% (92) |
| Oregon: | 3.2% (51,318) |
90 or more minutes:
| City of The Dalles: | 1.9% (101) |
| Oregon: | 1.8% (28,715) |
Means of transportation to work
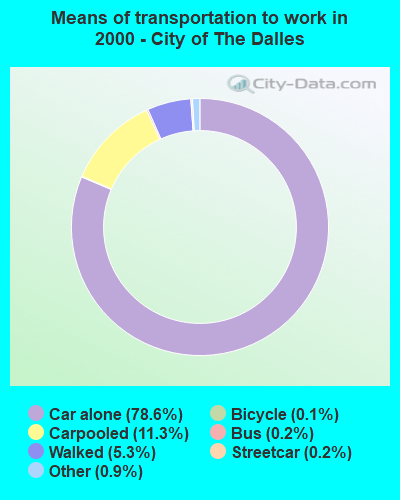

Drove car alone:
| City of The Dalles: | 78.6% (4,149) |
| Oregon: | 73.2% (1,171,641) |
Carpooled:
| City of The Dalles: | 11.3% (598) |
| Oregon: | 12.2% (195,950) |
Bus or trolley bus:
| City of The Dalles: | 0.2% (9) |
| Oregon: | 3.5% (56,795) |
Streetcar or trolley car:
| City of The Dalles: | 0.2% (12) |
| Oregon: | 0.2% (3,173) |
Motorcycle:
| City of The Dalles: | 0.1% (5) |
| Oregon: | 0.1% (1,942) |
Bicycle:
| City of The Dalles: | 0.1% (6) |
| Oregon: | 1.1% (17,172) |
Walked:
| City of The Dalles: | 5.3% (280) |
| Oregon: | 3.6% (57,217) |
Other means:
| City of The Dalles: | 0.9% (45) |
| Oregon: | 0.7% (10,882) |
Private vehicle occupancy
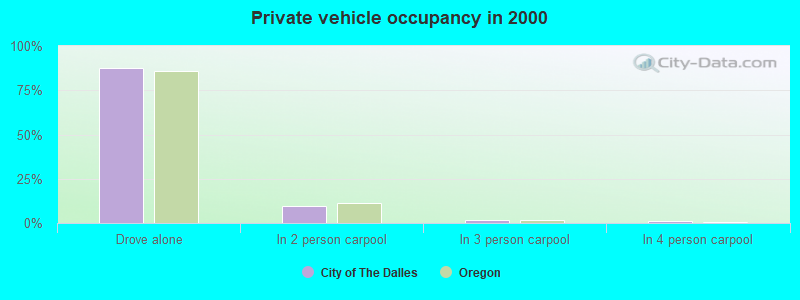
Drove alone:
| City of The Dalles: | 87.4% (4,149) |
| Oregon: | 85.7% (1,171,641) |
In 2 person carpool:
| City of The Dalles: | 9.6% (456) |
| Oregon: | 11.5% (156,754) |
In 3 person carpool:
| City of The Dalles: | 1.8% (84) |
| Oregon: | 1.9% (25,457) |
In 4 person carpool:
| City of The Dalles: | 0.9% (44) |
| Oregon: | 0.6% (8,345) |
In 5-6 person carpool:
| City of The Dalles: | 0.1% (3) |
| Oregon: | 0.3% (3,715) |
In 7+ person carpool:
| City of The Dalles: | 0.2% (11) |
| Oregon: | 0.1% (1,679) |
Class of workers
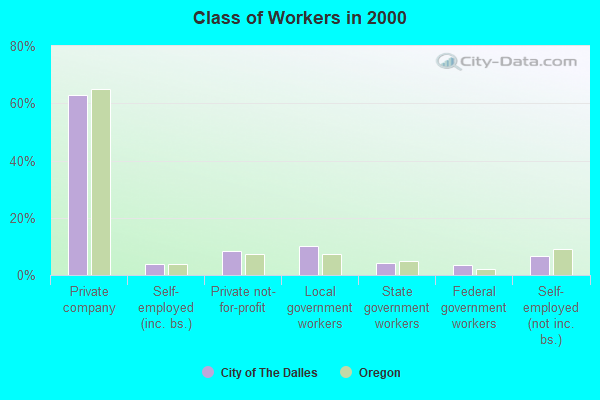
Employee of private company:
| City of The Dalles: | 62.9% (3,388) |
| Oregon: | 65.1% (1,059,139) |
Self-employed in own incorporated business:
| City of The Dalles: | 3.9% (212) |
| Oregon: | 3.8% (61,386) |
Private not-for-profit wage and salary workers:
| City of The Dalles: | 8.4% (453) |
| Oregon: | 7.4% (120,839) |
Local government workers:
| City of The Dalles: | 10.2% (548) |
| Oregon: | 7.2% (116,733) |
State government workers:
| City of The Dalles: | 4.2% (228) |
| Oregon: | 5.0% (81,804) |
Federal government workers:
| City of The Dalles: | 3.4% (183) |
| Oregon: | 2.2% (36,076) |
Self-employed workers in own not incorporated business:
| City of The Dalles: | 6.7% (363) |
| Oregon: | 8.9% (145,020) |
Unpaid family workers:
| City of The Dalles: | 0.2% (9) |
| Oregon: | 0.4% (6,772) |
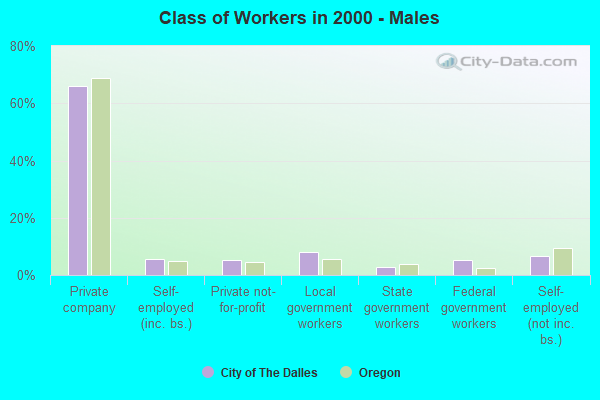
Employee of private company - Males:
| City of The Dalles: | 66.0% (1,867) |
| Oregon: | 68.9% (605,246) |
Self-employed in own incorporated business - Males:
| City of The Dalles: | 5.7% (161) |
| Oregon: | 5.0% (44,188) |
Private not-for-profit wage and salary workers - Males:
| City of The Dalles: | 5.2% (146) |
| Oregon: | 4.5% (39,938) |
Local government workers - Males:
| City of The Dalles: | 8.0% (227) |
| Oregon: | 5.6% (49,371) |
State government workers - Males:
| City of The Dalles: | 2.8% (78) |
| Oregon: | 3.9% (33,917) |
Federal government workers - Males:
| City of The Dalles: | 5.2% (148) |
| Oregon: | 2.3% (20,185) |
Self-employed workers in own not incorporated business - Males:
| City of The Dalles: | 6.8% (192) |
| Oregon: | 9.4% (82,902) |
Unpaid family workers - Males:
| City of The Dalles: | 0.3% (9) |
| Oregon: | 0.3% (2,982) |
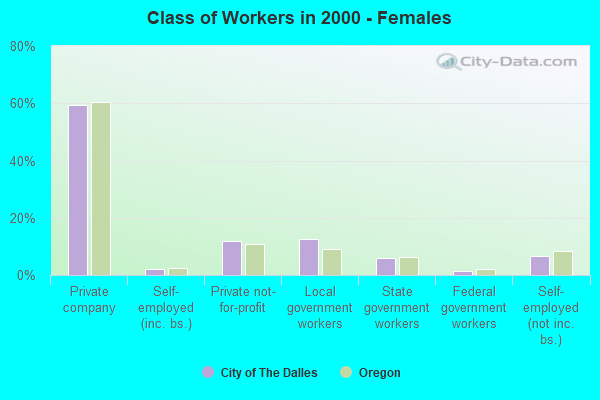
Employee of private company - Females:
| City of The Dalles: | 59.5% (1,521) |
| Oregon: | 60.6% (453,893) |
Self-employed in own incorporated business - Females:
| City of The Dalles: | 2.0% (51) |
| Oregon: | 2.3% (17,198) |
Private not-for-profit wage and salary workers - Females:
| City of The Dalles: | 12.0% (307) |
| Oregon: | 10.8% (80,901) |
Local government workers - Females:
| City of The Dalles: | 12.6% (321) |
| Oregon: | 9.0% (67,362) |
State government workers - Females:
| City of The Dalles: | 5.9% (150) |
| Oregon: | 6.4% (47,887) |
Federal government workers - Females:
| City of The Dalles: | 1.4% (35) |
| Oregon: | 2.1% (15,891) |
Self-employed workers in own not incorporated business - Females:
| City of The Dalles: | 6.7% (171) |
| Oregon: | 8.3% (62,118) |