Work and Jobs in Clackamas, Oregon (OR) Detailed Stats
Occupations, Industries, Unemployment, Workers, Commute

Recent posts about work in Clackamas, Oregon on our local forum with over 2,400,000 registered users:
 | Welding jobs in Portland (15 replies) |
| What's the market like for teaching jobs? (12 replies) |
| New district attorney, tough on crime? (4 replies) |
| Oregon suburbs vs Washington suburbs in Portland metro (48 replies) |
| Redrawing Oregon Border (290 replies) |
| Oregon income tax (56 replies) |
Latest news about work in Clackamas, OR collected exclusively by city-data.com from local newspapers, TV, and radio stations
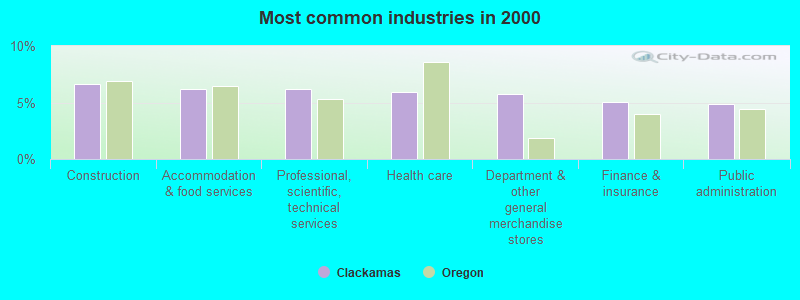
The most common industries in Clackamas are: Construction (6.6% of civilian employees), Accommodation & food services (6.2% of civilian employees), Professional, scientific, technical services (6.2% of civilian employees). 73.8% of workers are employees of private companies, which is 11.8% greater than the rate of 65.1% across the entire state of Oregon.
Most common industries
Most common industries | |||
|---|---|---|---|
Industry | All | Males | Females |
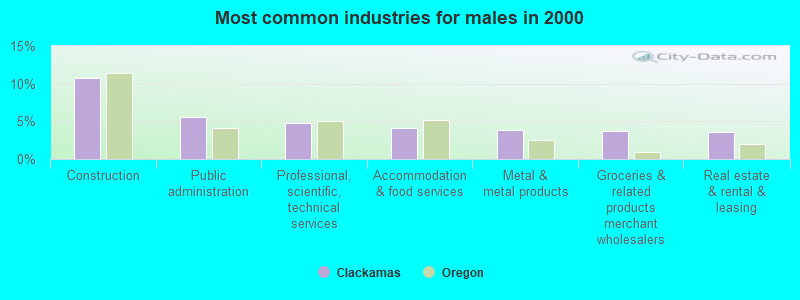
| Construction | 6.6% (180) | 10.7% (155) | 2.0% (25) |
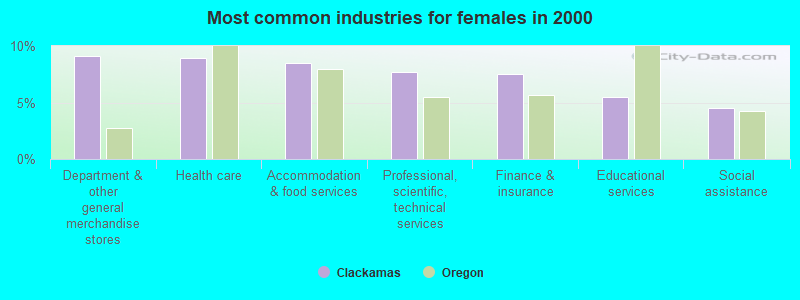
| Accommodation and food services | 6.2% (168) | 4.2% (60) | 8.5% (108) |
| Professional, scientific, and technical services | 6.2% (167) | 4.8% (69) | 7.7% (98) |
| Health care | 5.9% (161) | 3.3% (47) | 9.0% (114) |
| Department and other general merchandise stores | 5.7% (155) | 2.7% (39) | 9.1% (116) |
| Finance and insurance | 5.0% (136) | 2.8% (40) | 7.6% (96) |
| Public administration | 4.8% (131) | 5.6% (81) | 3.9% (50) |
| Educational services | 3.8% (103) | 2.3% (33) | 5.5% (70) |
| Metal and metal products | 2.8% (77) | 3.8% (55) | 1.7% (22) |
| Administrative and support and waste management services | 2.8% (75) | 2.2% (32) | 3.4% (43) |
| Truck transportation | 2.6% (71) | 2.8% (41) | 2.4% (30) |
| Groceries and related products merchant wholesalers | 2.5% (67) | 3.7% (54) | 1.0% (13) |
| Social assistance | 2.5% (67) | 0.7% (10) | 4.5% (57) |
| Real estate and rental and leasing | 2.4% (64) | 3.5% (51) | 1.0% (13) |
| Food and beverage stores | 2.1% (56) | 2.4% (35) | 1.7% (21) |
| Other transportation, and support activities, and couriers | 2.0% (53) | 2.6% (38) | 1.2% (15) |
| Motor vehicle and parts dealers | 1.8% (48) | 2.9% (42) | 0.5% (6) |
| Used merchandise, gift, novelty, and souvenir, and other miscellaneous stores | 1.7% (47) | 1.6% (23) | 1.9% (24) |
| Printing and related support activities | 1.7% (46) | 2.0% (29) | 1.3% (17) |
| Data processing, libraries, and other information services | 1.6% (44) | 1.3% (19) | 2.0% (25) |
| Arts, entertainment, and recreation | 1.6% (44) | 1.8% (26) | 1.4% (18) |
| Computer and electronic products | 1.5% (40) | 2.4% (34) | 0.5% (6) |
| Food | 1.4% (38) | 2.1% (30) | 0.6% (8) |
| Transportation equipment | 1.3% (36) | 2.5% (36) | 0.0% (0) |
| Repair and maintenance | 1.3% (36) | 2.5% (36) | 0.0% (0) |
| Miscellaneous durable goods merchant wholesalers | 1.3% (34) | 1.2% (17) | 1.3% (17) |
| Personal and laundry services | 1.3% (34) | 0.6% (9) | 2.0% (25) |
| Miscellaneous manufacturing | 1.2% (32) | 1.2% (17) | 1.2% (15) |
| Religious, grantmaking, civic, professional, and similar organizations | 1.1% (31) | 1.0% (15) | 1.3% (16) |
| Building material and garden equipment and supplies dealers | 1.0% (27) | 1.9% (27) | 0.0% (0) |
| Other direct selling establishments | 0.9% (24) | 0.0% (0) | 1.9% (24) |
| Pharmacies and drug stores | 0.9% (24) | 0.0% (0) | 1.9% (24) |
| Broadcasting and telecommunications | 0.9% (24) | 1.2% (17) | 0.6% (7) |
| Publishing, and motion picture and sound recording industries | 0.9% (24) | 1.7% (24) | 0.0% (0) |
| Miscellaneous nondurable goods merchant wholesalers | 0.8% (22) | 0.0% (0) | 1.7% (22) |
| Radio, TV, and computer stores | 0.7% (20) | 1.0% (14) | 0.5% (6) |
| Wood products | 0.7% (19) | 1.3% (19) | 0.0% (0) |
| Utilities | 0.7% (18) | 0.5% (7) | 0.9% (11) |
| Gasoline stations | 0.7% (18) | 0.0% (0) | 1.4% (18) |
| Paper | 0.6% (17) | 1.2% (17) | 0.0% (0) |
| Machinery | 0.6% (16) | 0.6% (8) | 0.6% (8) |
| Book stores and news dealers | 0.6% (15) | 0.0% (0) | 1.2% (15) |
| Air transportation | 0.6% (15) | 0.4% (6) | 0.7% (9) |
| Electronic shopping and mail-order houses | 0.6% (15) | 1.0% (15) | 0.0% (0) |
| Lumber and other construction materials merchant wholesalers | 0.6% (15) | 1.0% (15) | 0.0% (0) |
| Chemicals | 0.5% (14) | 1.0% (14) | 0.0% (0) |
| Machinery, equipment, and supplies merchant wholesalers | 0.5% (14) | 1.0% (14) | 0.0% (0) |
| Alcoholic beverages merchant wholesalers | 0.5% (14) | 1.0% (14) | 0.0% (0) |
| Clothing and accessories, including shoe, stores | 0.5% (14) | 0.0% (0) | 1.1% (14) |
| Paper and paper products merchant wholesalers | 0.5% (13) | 0.9% (13) | 0.0% (0) |
| Sporting goods, camera, and hobby and toy stores | 0.4% (12) | 0.0% (0) | 0.9% (12) |
| Warehousing and storage | 0.4% (11) | 0.0% (0) | 0.9% (11) |
| Leather and allied products | 0.4% (11) | 0.0% (0) | 0.9% (11) |
| Electrical and electronic goods merchant wholesalers | 0.4% (11) | 0.8% (11) | 0.0% (0) |
| Sewing, needlework, and piece goods stores | 0.4% (10) | 0.0% (0) | 0.8% (10) |
| Electrical equipment, appliances, and components | 0.4% (10) | 0.7% (10) | 0.0% (0) |
| Motor vehicles, parts and supplies merchant wholesalers | 0.4% (10) | 0.7% (10) | 0.0% (0) |
| Recyclable material merchant wholesalers | 0.3% (9) | 0.6% (9) | 0.0% (0) |
| Furniture and related product manufacturing | 0.3% (7) | 0.5% (7) | 0.0% (0) |
Unemployment in Clackamas
- Unemployment by race in 2000
- Unemployment rate for White non-Hispanic residents
- 9.0%Males
- 11.2%Females
- Unemployment rate for Black residents
- 37.5%Males
- Unemployment rate for Asian residents
- 12.5%Females
Time leaving home to go to work

<5am:
| Clackamas: | 5.6% (150) |
| Oregon: | 3.7% (58,821) |
5:30am:
| Clackamas: | 4.3% (114) |
| Oregon: | 2.8% (44,872) |
6am:
| Clackamas: | 5.5% (146) |
| Oregon: | 4.4% (71,163) |
6:30am:
| Clackamas: | 12.2% (325) |
| Oregon: | 7.7% (122,707) |
7am:
| Clackamas: | 8.7% (231) |
| Oregon: | 10.3% (165,185) |
7:30am:
| Clackamas: | 12.7% (338) |
| Oregon: | 13.9% (222,209) |
8am:
| Clackamas: | 11.5% (306) |
| Oregon: | 15.3% (245,415) |
8:30am:
| Clackamas: | 7.2% (191) |
| Oregon: | 9.8% (156,781) |
9am:
| Clackamas: | 5.6% (150) |
| Oregon: | 4.9% (78,436) |
10am:
| Clackamas: | 6.4% (171) |
| Oregon: | 5.5% (88,783) |
11am:
| Clackamas: | 1.2% (32) |
| Oregon: | 2.6% (41,539) |
12pm:
| Clackamas: | 0.3% (9) |
| Oregon: | 1.3% (20,765) |
4pm:
| Clackamas: | 9.6% (254) |
| Oregon: | 6.8% (108,927) |
>4pm:
| Clackamas: | 5.5% (145) |
| Oregon: | 6.0% (95,989) |
Travel time to work
Daytime population change due to commuting: +5,176 (+100.0%)
Workers who live and work in this place: 364 (13.7%)
Workers who live and work in this place: 364 (13.7%)


Less than 5 minutes:
| Clackamas: | 4.3% (115) |
| Oregon: | 4.1% (66,369) |
5 to 9 minutes:
| Clackamas: | 6.6% (175) |
| Oregon: | 12.9% (206,168) |
10 to 14 minutes:
| Clackamas: | 16.0% (425) |
| Oregon: | 16.5% (263,466) |
15 to 19 minutes:
| Clackamas: | 11.2% (298) |
| Oregon: | 16.1% (258,476) |
20 to 24 minutes:
| Clackamas: | 13.5% (358) |
| Oregon: | 13.9% (223,370) |
25 to 29 minutes:
| Clackamas: | 6.1% (161) |
| Oregon: | 5.4% (87,147) |
30 to 34 minutes:
| Clackamas: | 20.0% (532) |
| Oregon: | 11.0% (176,763) |
35 to 39 minutes:
| Clackamas: | 2.4% (63) |
| Oregon: | 2.0% (32,680) |
40 to 44 minutes:
| Clackamas: | 5.0% (133) |
| Oregon: | 2.7% (43,262) |
45 to 59 minutes:
| Clackamas: | 6.5% (172) |
| Oregon: | 5.2% (83,858) |
60 to 89 minutes:
| Clackamas: | 2.9% (76) |
| Oregon: | 3.2% (51,318) |
90 or more minutes:
| Clackamas: | 2.0% (54) |
| Oregon: | 1.8% (28,715) |
Means of transportation to work


Drove car alone:
| Clackamas: | 75.0% (1,993) |
| Oregon: | 73.2% (1,171,641) |
Carpooled:
| Clackamas: | 12.9% (344) |
| Oregon: | 12.2% (195,950) |
Bus or trolley bus:
| Clackamas: | 4.3% (114) |
| Oregon: | 3.5% (56,795) |
Subway or elevated:
| Clackamas: | 0.5% (14) |
| Oregon: | 0.2% (3,906) |
Bicycle:
| Clackamas: | 1.2% (31) |
| Oregon: | 1.1% (17,172) |
Walked:
| Clackamas: | 1.7% (46) |
| Oregon: | 3.6% (57,217) |
Other means:
| Clackamas: | 0.8% (20) |
| Oregon: | 0.7% (10,882) |
Private vehicle occupancy

Drove alone:
| Clackamas: | 85.3% (1,993) |
| Oregon: | 85.7% (1,171,641) |
In 2 person carpool:
| Clackamas: | 13.3% (311) |
| Oregon: | 11.5% (156,754) |
In 3 person carpool:
| Clackamas: | 0.3% (7) |
| Oregon: | 1.9% (25,457) |
In 5-6 person carpool:
| Clackamas: | 0.6% (14) |
| Oregon: | 0.3% (3,715) |
In 7+ person carpool:
| Clackamas: | 0.5% (12) |
| Oregon: | 0.1% (1,679) |
Class of workers

Employee of private company:
| Clackamas: | 73.8% (2,002) |
| Oregon: | 65.1% (1,059,139) |
Self-employed in own incorporated business:
| Clackamas: | 3.5% (95) |
| Oregon: | 3.8% (61,386) |
Private not-for-profit wage and salary workers:
| Clackamas: | 6.7% (182) |
| Oregon: | 7.4% (120,839) |
Local government workers:
| Clackamas: | 5.6% (153) |
| Oregon: | 7.2% (116,733) |
State government workers:
| Clackamas: | 2.1% (56) |
| Oregon: | 5.0% (81,804) |
Federal government workers:
| Clackamas: | 2.7% (72) |
| Oregon: | 2.2% (36,076) |
Self-employed workers in own not incorporated business:
| Clackamas: | 5.3% (143) |
| Oregon: | 8.9% (145,020) |
Unpaid family workers:
| Clackamas: | 0.4% (11) |
| Oregon: | 0.4% (6,772) |

Employee of private company - Males:
| Clackamas: | 75.1% (1,084) |
| Oregon: | 68.9% (605,246) |
Self-employed in own incorporated business - Males:
| Clackamas: | 4.7% (68) |
| Oregon: | 5.0% (44,188) |
Private not-for-profit wage and salary workers - Males:
| Clackamas: | 4.2% (61) |
| Oregon: | 4.5% (39,938) |
Local government workers - Males:
| Clackamas: | 6.1% (88) |
| Oregon: | 5.6% (49,371) |
State government workers - Males:
| Clackamas: | 2.0% (29) |
| Oregon: | 3.9% (33,917) |
Federal government workers - Males:
| Clackamas: | 3.3% (48) |
| Oregon: | 2.3% (20,185) |
Self-employed workers in own not incorporated business - Males:
| Clackamas: | 4.6% (66) |
| Oregon: | 9.4% (82,902) |

Employee of private company - Females:
| Clackamas: | 72.3% (918) |
| Oregon: | 60.6% (453,893) |
Self-employed in own incorporated business - Females:
| Clackamas: | 2.1% (27) |
| Oregon: | 2.3% (17,198) |
Private not-for-profit wage and salary workers - Females:
| Clackamas: | 9.5% (121) |
| Oregon: | 10.8% (80,901) |
Local government workers - Females:
| Clackamas: | 5.1% (65) |
| Oregon: | 9.0% (67,362) |
State government workers - Females:
| Clackamas: | 2.1% (27) |
| Oregon: | 6.4% (47,887) |
Federal government workers - Females:
| Clackamas: | 1.9% (24) |
| Oregon: | 2.1% (15,891) |
Self-employed workers in own not incorporated business - Females:
| Clackamas: | 6.1% (77) |
| Oregon: | 8.3% (62,118) |
Unpaid family workers - Females:
| Clackamas: | 0.9% (11) |
| Oregon: | 0.5% (3,790) |