Work and Jobs in Columbus, Georgia (GA) Detailed Stats
Occupations, Industries, Unemployment, Workers, Commute
Settings
X


Recent posts about work in Columbus, Georgia on our local forum with over 2,400,000 registered users:
 | Job Offer In Columbus, Ohio from Dallas, Texas (15 replies) |
| Teacher Jobs in Columbus and Surrounding Area (3 replies) |
| Columbus as an option to move??? (2 replies) |
| Need advise about a possible move to Columbus from Los Angeles. (5 replies) |
| Clerical Hospital work in Columbus (0 replies) |
| IT jobs in Columbus (0 replies) |
Latest news about work in Columbus, GA collected exclusively by city-data.com from local newspapers, TV, and radio stations
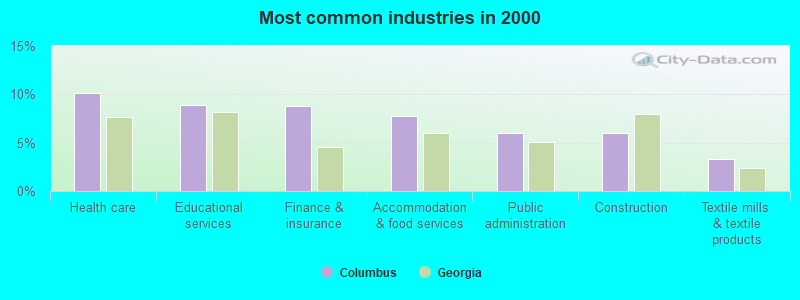
The most common industries in Columbus are: Health care (10.1% of civilian employees), Educational services (8.9% of civilian employees), Finance & insurance (8.8% of civilian employees). 67.4% of workers are employees of private companies, which is 4.5% less than the rate of 70.5% across the entire state of Georgia.
Most common industries
Most common industries | |||
|---|---|---|---|
Industry | All | Males | Females |
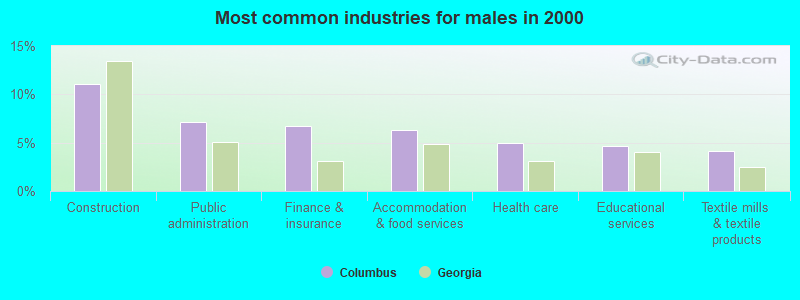
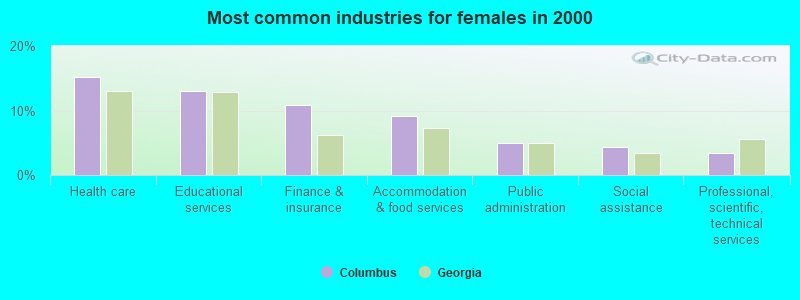
| Health care | 10.1% (7,643) | 5.0% (1,848) | 15.2% (5,795) |
| Educational services | 8.9% (6,699) | 4.7% (1,748) | 13.0% (4,951) |
| Finance and insurance | 8.8% (6,631) | 6.7% (2,508) | 10.8% (4,123) |
| Accommodation and food services | 7.7% (5,844) | 6.3% (2,346) | 9.2% (3,498) |
| Public administration | 6.0% (4,536) | 7.2% (2,667) | 4.9% (1,869) |
| Construction | 6.0% (4,524) | 11.1% (4,139) | 1.0% (385) |
| Textile mills and textile products | 3.3% (2,500) | 4.1% (1,527) | 2.5% (973) |
| Professional, scientific, and technical services | 3.1% (2,319) | 2.8% (1,039) | 3.3% (1,280) |
| Administrative and support and waste management services | 2.8% (2,124) | 3.6% (1,350) | 2.0% (774) |
| Social assistance | 2.5% (1,863) | 0.5% (189) | 4.4% (1,674) |
| Food and beverage stores | 2.4% (1,784) | 2.5% (918) | 2.3% (866) |
| Electrical equipment, appliances, and components | 2.4% (1,777) | 2.6% (966) | 2.1% (811) |
| Department and other general merchandise stores | 2.3% (1,701) | 1.2% (464) | 3.2% (1,237) |
| Real estate and rental and leasing | 2.0% (1,519) | 1.9% (710) | 2.1% (809) |
| Food | 1.8% (1,335) | 1.8% (687) | 1.7% (648) |
| Religious, grantmaking, civic, professional, and similar organizations | 1.7% (1,289) | 1.5% (548) | 1.9% (741) |
| Repair and maintenance | 1.7% (1,250) | 3.0% (1,113) | 0.4% (137) |
| Personal and laundry services | 1.5% (1,133) | 0.9% (332) | 2.1% (801) |
| Metal and metal products | 1.5% (1,119) | 2.4% (891) | 0.6% (228) |
| Motor vehicle and parts dealers | 1.4% (1,038) | 2.3% (853) | 0.5% (185) |
| Transportation equipment | 1.3% (998) | 2.1% (794) | 0.5% (204) |
| Truck transportation | 1.3% (997) | 2.3% (862) | 0.4% (135) |
| Arts, entertainment, and recreation | 1.3% (977) | 1.3% (474) | 1.3% (503) |
| Broadcasting and telecommunications | 1.1% (795) | 1.3% (473) | 0.8% (322) |
| Miscellaneous manufacturing | 0.9% (704) | 1.0% (385) | 0.8% (319) |
| Data processing, libraries, and other information services | 0.9% (680) | 0.9% (325) | 0.9% (355) |
| Other transportation, and support activities, and couriers | 0.9% (642) | 1.3% (472) | 0.4% (170) |
| Publishing, and motion picture and sound recording industries | 0.8% (609) | 0.9% (320) | 0.8% (289) |
| Printing and related support activities | 0.8% (567) | 0.8% (307) | 0.7% (260) |
| Clothing and accessories, including shoe, stores | 0.7% (547) | 0.3% (106) | 1.2% (441) |
| Building material and garden equipment and supplies dealers | 0.7% (531) | 1.0% (370) | 0.4% (161) |
| Used merchandise, gift, novelty, and souvenir, and other miscellaneous stores | 0.7% (518) | 0.5% (172) | 0.9% (346) |
| Other direct selling establishments | 0.6% (446) | 0.4% (152) | 0.8% (294) |
| Furniture and home furnishings, and household appliance stores | 0.6% (422) | 0.7% (267) | 0.4% (155) |
| Private households | 0.5% (392) | 0.1% (45) | 0.9% (347) |
| Machinery | 0.5% (389) | 0.9% (324) | 0.2% (65) |
| U. S. Postal service | 0.5% (386) | 0.8% (281) | 0.3% (105) |
| Nonmetallic mineral products | 0.5% (380) | 0.8% (307) | 0.2% (73) |
| Utilities | 0.5% (359) | 0.8% (304) | 0.1% (55) |
| Chemicals | 0.4% (333) | 0.7% (260) | 0.2% (73) |
| Groceries and related products merchant wholesalers | 0.4% (333) | 0.8% (289) | 0.1% (44) |
| Paper | 0.4% (312) | 0.6% (227) | 0.2% (85) |
| Pharmacies and drug stores | 0.4% (296) | 0.3% (130) | 0.4% (166) |
| Agriculture, forestry, fishing and hunting | 0.4% (291) | 0.5% (203) | 0.2% (88) |
| Radio, TV, and computer stores | 0.4% (270) | 0.6% (232) | 0.1% (38) |
| Gasoline stations | 0.4% (269) | 0.2% (85) | 0.5% (184) |
| Beverage and tobacco products | 0.3% (252) | 0.6% (217) | 0.1% (35) |
| Warehousing and storage | 0.3% (193) | 0.4% (139) | 0.1% (54) |
| Sporting goods, camera, and hobby and toy stores | 0.2% (163) | 0.3% (99) | 0.2% (64) |
| Machinery, equipment, and supplies merchant wholesalers | 0.2% (155) | 0.3% (112) | 0.1% (43) |
| Miscellaneous nondurable goods merchant wholesalers | 0.2% (153) | 0.3% (95) | 0.2% (58) |
| Electronic shopping and mail-order houses | 0.2% (134) | 0.1% (33) | 0.3% (101) |
| Lumber and other construction materials merchant wholesalers | 0.2% (131) | 0.3% (113) | 0.0% (18) |
| Apparel | 0.2% (120) | 0.1% (44) | 0.2% (76) |
| Management of companies and enterprises | 0.2% (117) | 0.1% (46) | 0.2% (71) |
| Alcoholic beverages merchant wholesalers | 0.2% (116) | 0.3% (101) | 0.0% (15) |
| Furniture and related product manufacturing | 0.2% (115) | 0.3% (101) | 0.0% (14) |
| Electrical and electronic goods merchant wholesalers | 0.2% (115) | 0.2% (76) | 0.1% (39) |
| Health and personal care, except drug, stores | 0.2% (115) | 0.1% (26) | 0.2% (89) |
| Wood products | 0.1% (111) | 0.3% (102) | 0.0% (9) |
| Jewelry, luggage, and leather goods stores | 0.1% (111) | 0.1% (33) | 0.2% (78) |
| Retail florists | 0.1% (110) | 0.0% (9) | 0.3% (101) |
| Drugs, sundries, and chemical and allied products merchant wholesalers | 0.1% (108) | 0.2% (80) | 0.1% (28) |
| Plastics and rubber products | 0.1% (97) | 0.2% (88) | 0.0% (9) |
| Motor vehicles, parts and supplies merchant wholesalers | 0.1% (87) | 0.2% (87) | 0.0% (0) |
| Computer and electronic products | 0.1% (84) | 0.2% (67) | 0.0% (17) |
| Rail transportation | 0.1% (79) | 0.2% (79) | 0.0% (0) |
| Air transportation | 0.1% (77) | 0.1% (39) | 0.1% (38) |
| Music stores | 0.1% (72) | 0.1% (49) | 0.1% (23) |
| Office supplies and stationery stores | 0.1% (69) | 0.1% (40) | 0.1% (29) |
| Hardware, plumbing and heating equipment, and supplies merchant wholesalers | 0.1% (66) | 0.2% (59) | 0.0% (7) |
| Miscellaneous durable goods merchant wholesalers | 0.1% (64) | 0.1% (49) | 0.0% (15) |
| Professional and commercial equipment and supplies merchant wholesalers | 0.1% (57) | 0.2% (57) | 0.0% (0) |
Unemployment in Columbus
- Unemployment by race in 2000
- Unemployment rate for White non-Hispanic residents
- 2.7%Males
- 4.4%Females
- Unemployment rate for Black residents
- 11.8%Males
- 10.9%Females
- Unemployment rate for American Indian and Alaska Native residents
- 7.4%Males
- Unemployment rate for Asian residents
- 2.0%Males
- 9.6%Females
- Unemployment rate for other race residents
- 9.6%Males
- 3.9%Females
- Unemployment rate for two or more race residents
- 8.9%Males
- 8.5%Females
- Unemployment rate for Hispanic or Latino residents
- 8.0%Males
- 6.3%Females
Time leaving home to go to work

<5am:
| Columbus: | 5.1% (4,260) |
| Georgia: | 2.8% (108,019) |
5:30am:
| Columbus: | 5.3% (4,409) |
| Georgia: | 2.7% (102,302) |
6am:
| Columbus: | 5.8% (4,792) |
| Georgia: | 4.1% (156,682) |
6:30am:
| Columbus: | 6.0% (4,946) |
| Georgia: | 9.0% (343,349) |
7am:
| Columbus: | 7.6% (6,282) |
| Georgia: | 11.0% (422,728) |
7:30am:
| Columbus: | 12.0% (9,913) |
| Georgia: | 15.9% (608,777) |
8am:
| Columbus: | 16.2% (13,412) |
| Georgia: | 15.9% (610,869) |
8:30am:
| Columbus: | 11.8% (9,741) |
| Georgia: | 10.2% (391,849) |
9am:
| Columbus: | 5.7% (4,704) |
| Georgia: | 4.9% (187,692) |
10am:
| Columbus: | 5.0% (4,156) |
| Georgia: | 5.3% (204,205) |
11am:
| Columbus: | 2.3% (1,872) |
| Georgia: | 2.1% (79,927) |
12pm:
| Columbus: | 1.3% (1,047) |
| Georgia: | 0.9% (34,761) |
4pm:
| Columbus: | 6.4% (5,332) |
| Georgia: | 5.7% (219,434) |
>4pm:
| Columbus: | 7.8% (6,428) |
| Georgia: | 6.6% (253,223) |
Travel time to work
Daytime population change due to commuting: +18,456 (+9.9%)
Workers who live and work in this city: 71,631 (86.5%)
Workers who live and work in this city: 71,631 (86.5%)


Less than 5 minutes:
| Columbus: | 3.5% (2,918) |
| Georgia: | 2.4% (93,446) |
5 to 9 minutes:
| Columbus: | 11.9% (9,839) |
| Georgia: | 8.7% (334,403) |
10 to 14 minutes:
| Columbus: | 19.4% (16,062) |
| Georgia: | 13.3% (511,628) |
15 to 19 minutes:
| Columbus: | 25.0% (20,662) |
| Georgia: | 15.2% (583,820) |
20 to 24 minutes:
| Columbus: | 18.2% (15,081) |
| Georgia: | 13.6% (519,875) |
25 to 29 minutes:
| Columbus: | 4.5% (3,746) |
| Georgia: | 5.5% (209,374) |
30 to 34 minutes:
| Columbus: | 7.5% (6,216) |
| Georgia: | 14.0% (535,531) |
35 to 39 minutes:
| Columbus: | 0.9% (743) |
| Georgia: | 2.8% (108,867) |
40 to 44 minutes:
| Columbus: | 0.9% (717) |
| Georgia: | 3.4% (132,121) |
45 to 59 minutes:
| Columbus: | 2.4% (2,014) |
| Georgia: | 9.1% (347,610) |
60 to 89 minutes:
| Columbus: | 1.9% (1,542) |
| Georgia: | 6.1% (234,588) |
90 or more minutes:
| Columbus: | 2.1% (1,754) |
| Georgia: | 2.9% (112,554) |
Means of transportation to work

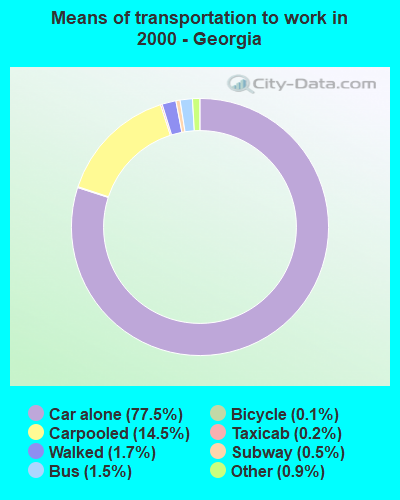
Drove car alone:
| Columbus: | 75.5% (62,516) |
| Georgia: | 77.5% (2,968,910) |
Carpooled:
| Columbus: | 14.6% (12,077) |
| Georgia: | 14.5% (557,062) |
Bus or trolley bus:
| Columbus: | 1.1% (900) |
| Georgia: | 1.5% (59,355) |
Subway or elevated:
| Columbus: | 0.0% (22) |
| Georgia: | 0.5% (20,116) |
Taxicab:
| Columbus: | 0.3% (277) |
| Georgia: | 0.2% (7,572) |
Motorcycle:
| Columbus: | 0.0% (36) |
| Georgia: | 0.1% (3,055) |
Bicycle:
| Columbus: | 0.1% (94) |
| Georgia: | 0.1% (5,588) |
Walked:
| Columbus: | 4.7% (3,882) |
| Georgia: | 1.7% (65,776) |
Other means:
| Columbus: | 1.8% (1,490) |
| Georgia: | 0.9% (33,396) |
Private vehicle occupancy

Drove alone:
| Columbus: | 83.8% (62,516) |
| Georgia: | 84.2% (2,968,910) |
In 2 person carpool:
| Columbus: | 12.4% (9,248) |
| Georgia: | 11.5% (406,954) |
In 3 person carpool:
| Columbus: | 2.3% (1,703) |
| Georgia: | 2.5% (87,725) |
In 4 person carpool:
| Columbus: | 0.8% (599) |
| Georgia: | 1.0% (34,505) |
In 5-6 person carpool:
| Columbus: | 0.3% (223) |
| Georgia: | 0.5% (18,718) |
In 7+ person carpool:
| Columbus: | 0.4% (304) |
| Georgia: | 0.3% (9,160) |
Class of workers
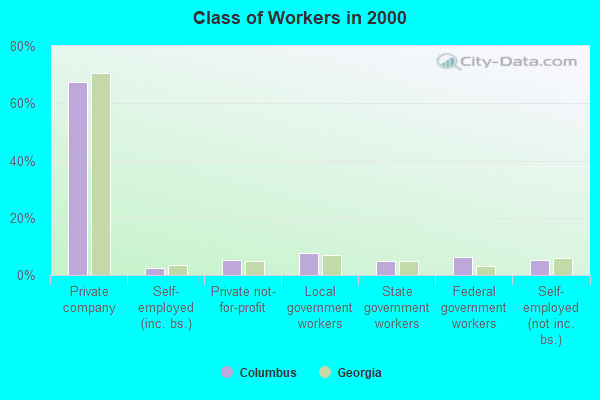
Employee of private company:
| Columbus: | 67.4% (50,903) |
| Georgia: | 70.5% (2,705,775) |
Self-employed in own incorporated business:
| Columbus: | 2.6% (1,958) |
| Georgia: | 3.6% (137,778) |
Private not-for-profit wage and salary workers:
| Columbus: | 5.3% (4,010) |
| Georgia: | 4.8% (185,815) |
Local government workers:
| Columbus: | 7.6% (5,760) |
| Georgia: | 6.9% (265,340) |
State government workers:
| Columbus: | 5.0% (3,806) |
| Georgia: | 5.0% (190,664) |
Federal government workers:
| Columbus: | 6.4% (4,836) |
| Georgia: | 3.1% (118,038) |
Self-employed workers in own not incorporated business:
| Columbus: | 5.3% (3,992) |
| Georgia: | 5.9% (226,595) |
Unpaid family workers:
| Columbus: | 0.3% (211) |
| Georgia: | 0.3% (9,751) |

Employee of private company - Males:
| Columbus: | 70.1% (26,124) |
| Georgia: | 73.4% (1,505,132) |
Self-employed in own incorporated business - Males:
| Columbus: | 3.6% (1,349) |
| Georgia: | 4.9% (100,388) |
Private not-for-profit wage and salary workers - Males:
| Columbus: | 3.4% (1,274) |
| Georgia: | 3.0% (62,400) |
Local government workers - Males:
| Columbus: | 6.2% (2,293) |
| Georgia: | 4.9% (99,702) |
State government workers - Males:
| Columbus: | 3.8% (1,407) |
| Georgia: | 3.4% (69,665) |
Federal government workers - Males:
| Columbus: | 6.3% (2,362) |
| Georgia: | 3.0% (61,555) |
Self-employed workers in own not incorporated business - Males:
| Columbus: | 6.4% (2,398) |
| Georgia: | 7.2% (148,029) |
Unpaid family workers - Males:
| Columbus: | 0.2% (58) |
| Georgia: | 0.2% (4,652) |

Employee of private company - Females:
| Columbus: | 64.8% (24,779) |
| Georgia: | 67.1% (1,200,643) |
Self-employed in own incorporated business - Females:
| Columbus: | 1.6% (609) |
| Georgia: | 2.1% (37,390) |
Private not-for-profit wage and salary workers - Females:
| Columbus: | 7.2% (2,736) |
| Georgia: | 6.9% (123,415) |
Local government workers - Females:
| Columbus: | 9.1% (3,467) |
| Georgia: | 9.3% (165,638) |
State government workers - Females:
| Columbus: | 6.3% (2,399) |
| Georgia: | 6.8% (120,999) |
Federal government workers - Females:
| Columbus: | 6.5% (2,474) |
| Georgia: | 3.2% (56,483) |
Self-employed workers in own not incorporated business - Females:
| Columbus: | 4.2% (1,594) |
| Georgia: | 4.4% (78,566) |
Unpaid family workers - Females:
| Columbus: | 0.4% (153) |
| Georgia: | 0.3% (5,099) |