Work and Jobs in Colver, Pennsylvania (PA) Detailed Stats
Occupations, Industries, Unemployment, Workers, Commute
Settings
X


Discuss Colver, Pennsylvania work on our local forum with over 2,400,000 registered users
Latest news about work in Colver, PA collected exclusively by city-data.com from local newspapers, TV, and radio stations
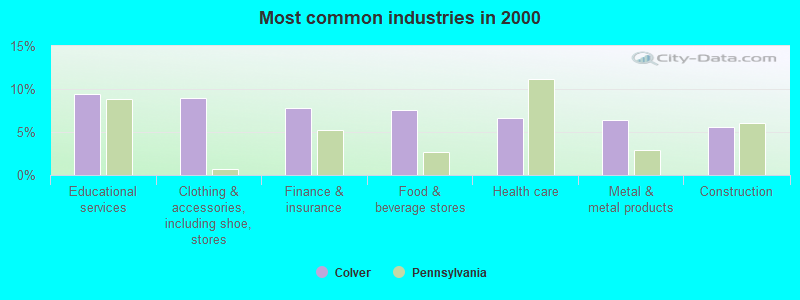
The most common industries in Colver are: Educational services (9.5% of civilian employees), Clothing & accessories, including shoe, stores (8.9% of civilian employees), Finance & insurance (7.8% of civilian employees). 92.9% of workers work in Cambria County. 91.2% of workers are employees of private companies, which is 25.7% greater than the rate of 67.7% across the entire state of Pennsylvania.
Whole page based on the data from 2000 / 2022 when the population of Colver, Pennsylvania was 1,035 / 537
Whole page based on the data from 2000 / 2022 when the population of Colver, Pennsylvania was 1,035 / 537
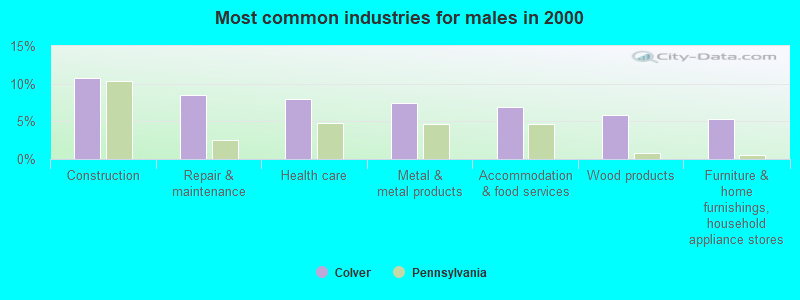
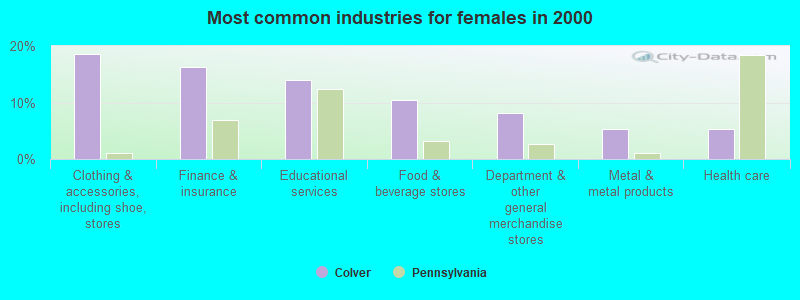
Most common industries
Most common industries | |||
|---|---|---|---|
Industry | All | Males | Females |
| Educational services | 9.5% (34) | 5.3% (10) | 14.0% (24) |
| Clothing and accessories, including shoe, stores | 8.9% (32) | 0.0% (0) | 18.6% (32) |
| Finance and insurance | 7.8% (28) | 0.0% (0) | 16.3% (28) |
| Food and beverage stores | 7.5% (27) | 4.8% (9) | 10.5% (18) |
| Health care | 6.7% (24) | 8.0% (15) | 5.2% (9) |
| Metal and metal products | 6.4% (23) | 7.5% (14) | 5.2% (9) |
| Construction | 5.6% (20) | 10.7% (20) | 0.0% (0) |
| Accommodation and food services | 5.6% (20) | 7.0% (13) | 4.1% (7) |
| Repair and maintenance | 4.5% (16) | 8.6% (16) | 0.0% (0) |
| Department and other general merchandise stores | 3.9% (14) | 0.0% (0) | 8.1% (14) |
| Wood products | 3.1% (11) | 5.9% (11) | 0.0% (0) |
| Furniture and home furnishings, and household appliance stores | 2.8% (10) | 5.3% (10) | 0.0% (0) |
| Other transportation, and support activities, and couriers | 2.8% (10) | 5.3% (10) | 0.0% (0) |
| Building material and garden equipment and supplies dealers | 2.5% (9) | 4.8% (9) | 0.0% (0) |
| Groceries and related products merchant wholesalers | 2.5% (9) | 4.8% (9) | 0.0% (0) |
| Health and personal care, except drug, stores | 2.2% (8) | 0.0% (0) | 4.7% (8) |
| Used merchandise, gift, novelty, and souvenir, and other miscellaneous stores | 2.2% (8) | 0.0% (0) | 4.7% (8) |
| Truck transportation | 2.2% (8) | 4.3% (8) | 0.0% (0) |
| Administrative and support and waste management services | 2.2% (8) | 4.3% (8) | 0.0% (0) |
| Personal and laundry services | 2.2% (8) | 0.0% (0) | 4.7% (8) |
| Agriculture, forestry, fishing and hunting | 1.9% (7) | 0.0% (0) | 4.1% (7) |
| Electrical equipment, appliances, and components | 1.9% (7) | 3.7% (7) | 0.0% (0) |
| Machinery | 1.9% (7) | 3.7% (7) | 0.0% (0) |
| Utilities | 1.7% (6) | 3.2% (6) | 0.0% (0) |
| Social assistance | 1.4% (5) | 2.7% (5) | 0.0% (0) |
Unemployment in Colver
- Unemployment by race in 2000
- Unemployment rate for White non-Hispanic residents
- 3.4%Females
Time leaving home to go to work
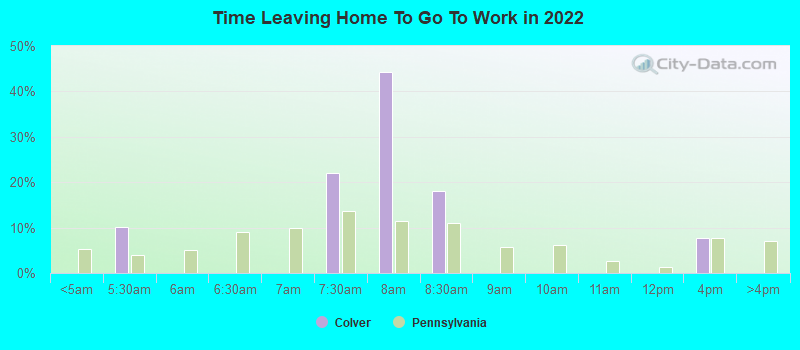
5:00 a.m. to 5:29 a.m.:
| Colver: | 10.2% (27) |
| Pennsylvania: | 3.9% (210,362) |
7:00 a.m. to 7:29 a.m.:
| Colver: | 22.1% (58) |
| Pennsylvania: | 13.6% (726,980) |
7:30 a.m. to 7:59 a.m.:
| Colver: | 44.2% (117) |
| Pennsylvania: | 11.5% (611,627) |
8:00 a.m. to 8:29 a.m.:
| Colver: | 18.0% (48) |
| Pennsylvania: | 11.0% (585,665) |
12:00 p.m. to 3:59 p.m.:
| Colver: | 7.8% (21) |
| Pennsylvania: | 7.6% (407,255) |

<5am:
| Colver: | 2.5% (9) |
| Pennsylvania: | 3.1% (172,304) |
6am:
| Colver: | 6.4% (23) |
| Pennsylvania: | 4.4% (245,004) |
6:30am:
| Colver: | 9.5% (34) |
| Pennsylvania: | 8.6% (478,636) |
7am:
| Colver: | 19.3% (69) |
| Pennsylvania: | 10.8% (599,808) |
7:30am:
| Colver: | 25.2% (90) |
| Pennsylvania: | 13.7% (759,372) |
8am:
| Colver: | 14.0% (50) |
| Pennsylvania: | 14.9% (826,968) |
8:30am:
| Colver: | 6.7% (24) |
| Pennsylvania: | 10.6% (588,440) |
9am:
| Colver: | 2.8% (10) |
| Pennsylvania: | 5.5% (304,765) |
4pm:
| Colver: | 6.4% (23) |
| Pennsylvania: | 7.3% (404,775) |
>4pm:
| Colver: | 7.0% (25) |
| Pennsylvania: | 7.3% (408,070) |

7:00 a.m. to 7:29 a.m. - Males:
| Colver: | 11.4% (21) |
| Pennsylvania: | 12.6% (356,257) |
7:30 a.m. to 7:59 a.m. - Males:
| Colver: | 63.4% (115) |
| Pennsylvania: | 9.5% (268,895) |
8:00 a.m. to 8:29 a.m. - Males:
| Colver: | 28.7% (52) |
| Pennsylvania: | 9.7% (274,966) |
12:00 p.m. to 3:59 p.m. - Males:
| Colver: | 11.8% (21) |
| Pennsylvania: | 7.4% (210,601) |

5:00 a.m. to 5:29 a.m. - Females:
| Colver: | 39.9% (33) |
| Pennsylvania: | 2.1% (52,533) |
7:00 a.m. to 7:29 a.m. - Females:
| Colver: | 45.7% (38) |
| Pennsylvania: | 14.8% (370,723) |
7:30 a.m. to 7:59 a.m. - Females:
| Colver: | 18.6% (15) |
| Pennsylvania: | 13.7% (342,732) |
Travel time to work
Percentage of workers working in this county: 92.9%


5 to 9 minutes:
| Colver: | 4.5% (16) |
| Pennsylvania: | 11.1% (615,919) |
10 to 14 minutes:
| Colver: | 19.9% (71) |
| Pennsylvania: | 14.9% (825,199) |
15 to 19 minutes:
| Colver: | 38.9% (139) |
| Pennsylvania: | 15.0% (836,006) |
20 to 24 minutes:
| Colver: | 8.7% (31) |
| Pennsylvania: | 14.1% (782,790) |
25 to 29 minutes:
| Colver: | 2.5% (9) |
| Pennsylvania: | 5.9% (327,459) |
30 to 34 minutes:
| Colver: | 3.6% (13) |
| Pennsylvania: | 11.8% (655,811) |
40 to 44 minutes:
| Colver: | 7.6% (27) |
| Pennsylvania: | 3.4% (187,483) |
45 to 59 minutes:
| Colver: | 9.2% (33) |
| Pennsylvania: | 7.3% (407,516) |
60 to 89 minutes:
| Colver: | 2.8% (10) |
| Pennsylvania: | 4.8% (265,759) |
90 or more minutes:
| Colver: | 2.2% (8) |
| Pennsylvania: | 2.6% (142,325) |
Means of transportation to work


Drove car alone:
| Colver: | 91.6% (327) |
| Pennsylvania: | 76.5% (4,247,836) |
Carpooled:
| Colver: | 8.4% (30) |
| Pennsylvania: | 10.4% (577,364) |
Private vehicle occupancy

Drove alone:
| Colver: | 91.8% (248) |
| Pennsylvania: | 90.2% (4,322,003) |
In 2 person carpool:
| Colver: | 8.2% (22) |
| Pennsylvania: | 7.7% (367,639) |

Drove alone:
| Colver: | 91.6% (327) |
| Pennsylvania: | 88.0% (4,247,836) |
In 2 person carpool:
| Colver: | 8.4% (30) |
| Pennsylvania: | 9.7% (470,174) |
Class of workers
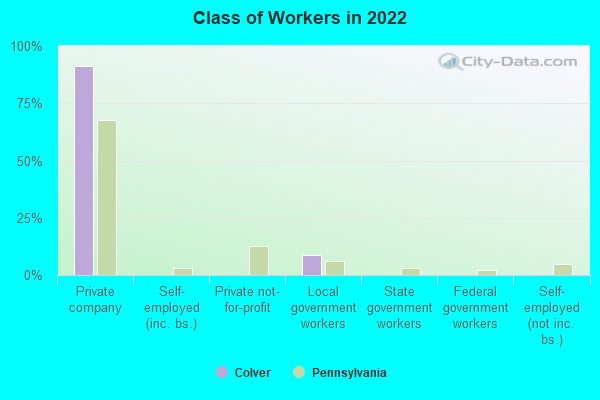
Employee of private company:
| Colver: | 91.2% (249) |
| Pennsylvania: | 67.7% (4,333,849) |
Local government workers:
| Colver: | 8.8% (24) |
| Pennsylvania: | 6.2% (397,120) |

Employee of private company:
| Colver: | 71.9% (258) |
| Pennsylvania: | 69.7% (3,942,119) |
Private not-for-profit wage and salary workers:
| Colver: | 6.4% (23) |
| Pennsylvania: | 10.3% (580,382) |
Local government workers:
| Colver: | 1.7% (6) |
| Pennsylvania: | 5.8% (326,222) |
State government workers:
| Colver: | 10.0% (36) |
| Pennsylvania: | 3.2% (182,232) |
Self-employed workers in own not incorporated business:
| Colver: | 8.1% (29) |
| Pennsylvania: | 6.0% (339,631) |
Unpaid family workers:
| Colver: | 1.9% (7) |
| Pennsylvania: | 0.3% (17,409) |

Employee of private company - Males:
| Colver: | 100.0% (187) |
| Pennsylvania: | 71.5% (2,388,579) |

Employee of private company - Females:
| Colver: | 71.9% (62) |
| Pennsylvania: | 63.5% (1,945,270) |
Local government workers - Females:
| Colver: | 28.1% (24) |
| Pennsylvania: | 7.5% (228,810) |