Work and Jobs in District 1, Taneytown, Maryland (MD) Detailed Stats
Occupations, Industries, Unemployment, Workers, Commute
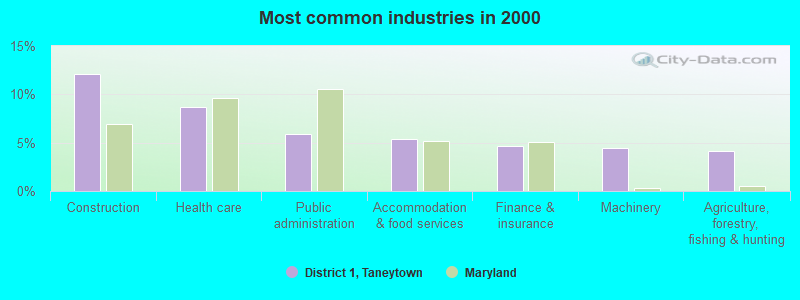
The most common industries in District 1, Taneytown are: Construction (12.1% of civilian employees), Health care (8.6% of civilian employees), Public administration (5.9% of civilian employees). 70.5% of workers are employees of private companies, which is 14.1% greater than the rate of 60.5% across the entire state of Maryland.
Most common industries
Most common industries | |||
|---|---|---|---|
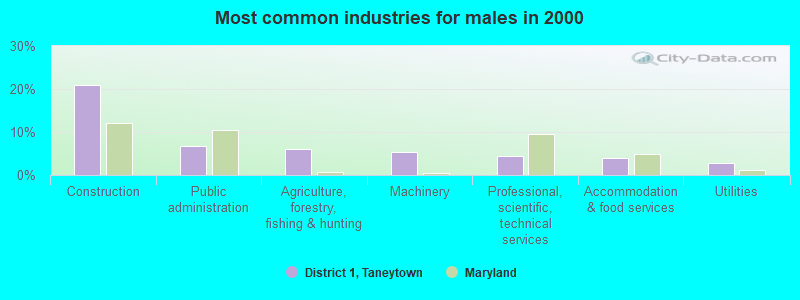
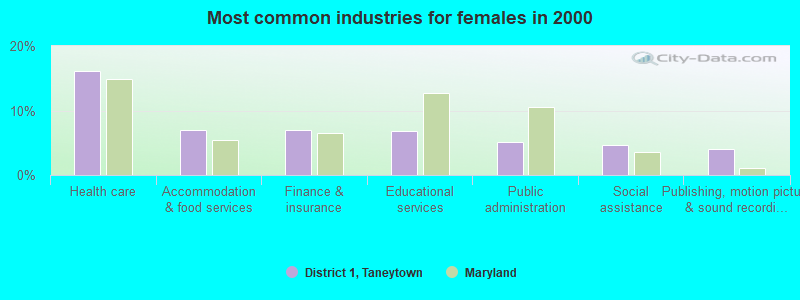
Industry | All | Males | Females |
| Construction | 12.1% (471) | 21.0% (436) | 1.9% (35) |
| Health care | 8.6% (336) | 2.1% (44) | 16.2% (292) |
| Public administration | 5.9% (230) | 6.6% (138) | 5.1% (92) |
| Accommodation and food services | 5.4% (209) | 4.0% (83) | 7.0% (126) |
| Finance and insurance | 4.6% (180) | 2.6% (54) | 7.0% (126) |
| Machinery | 4.5% (174) | 5.2% (109) | 3.6% (65) |
| Agriculture, forestry, fishing and hunting | 4.1% (159) | 6.1% (127) | 1.8% (32) |
| Educational services | 4.1% (158) | 1.7% (35) | 6.8% (123) |
| Professional, scientific, and technical services | 3.5% (138) | 4.5% (94) | 2.4% (44) |
| Administrative and support and waste management services | 2.9% (111) | 2.3% (47) | 3.5% (64) |
| Publishing, and motion picture and sound recording industries | 2.8% (110) | 1.8% (37) | 4.0% (73) |
| Food and beverage stores | 2.3% (89) | 1.0% (20) | 3.8% (69) |
| Social assistance | 2.2% (85) | 0.1% (2) | 4.6% (83) |
| Used merchandise, gift, novelty, and souvenir, and other miscellaneous stores | 1.8% (71) | 1.7% (35) | 2.0% (36) |
| Truck transportation | 1.8% (69) | 2.5% (51) | 1.0% (18) |
| Utilities | 1.7% (66) | 2.7% (57) | 0.5% (9) |
| Wood products | 1.7% (65) | 2.0% (41) | 1.3% (24) |
| Apparel | 1.6% (62) | 0.6% (12) | 2.8% (50) |
| Broadcasting and telecommunications | 1.6% (61) | 2.0% (41) | 1.1% (20) |
| Motor vehicle and parts dealers | 1.5% (57) | 1.6% (33) | 1.3% (24) |
| Metal and metal products | 1.4% (56) | 1.7% (35) | 1.2% (21) |
| Computer and electronic products | 1.4% (56) | 2.2% (46) | 0.6% (10) |
| Personal and laundry services | 1.4% (54) | 0.2% (5) | 2.7% (49) |
| Repair and maintenance | 1.4% (53) | 2.1% (44) | 0.5% (9) |
| Furniture and related product manufacturing | 1.3% (52) | 1.7% (36) | 0.9% (16) |
| Religious, grantmaking, civic, professional, and similar organizations | 1.2% (47) | 0.8% (17) | 1.7% (30) |
| Department and other general merchandise stores | 1.2% (46) | 1.0% (21) | 1.4% (25) |
| Transportation equipment | 1.0% (40) | 1.7% (36) | 0.2% (4) |
| Real estate and rental and leasing | 1.0% (39) | 1.2% (24) | 0.8% (15) |
| Paper | 0.9% (36) | 1.1% (23) | 0.7% (13) |
| Arts, entertainment, and recreation | 0.9% (34) | 1.3% (28) | 0.3% (6) |
| Printing and related support activities | 0.8% (33) | 1.1% (22) | 0.6% (11) |
| Food | 0.8% (31) | 1.2% (25) | 0.3% (6) |
| Nonmetallic mineral products | 0.8% (31) | 0.7% (15) | 0.9% (16) |
| Building material and garden equipment and supplies dealers | 0.7% (29) | 0.7% (14) | 0.8% (15) |
| Other transportation, and support activities, and couriers | 0.7% (29) | 1.1% (23) | 0.3% (6) |
| Pharmacies and drug stores | 0.7% (26) | 0.0% (0) | 1.4% (26) |
| Miscellaneous nondurable goods merchant wholesalers | 0.6% (24) | 0.1% (2) | 1.2% (22) |
| Textile mills and textile products | 0.6% (24) | 0.4% (8) | 0.9% (16) |
| Electrical equipment, appliances, and components | 0.5% (21) | 0.4% (9) | 0.7% (12) |
| Miscellaneous manufacturing | 0.5% (21) | 1.0% (21) | 0.0% (0) |
| Groceries and related products merchant wholesalers | 0.4% (15) | 0.2% (5) | 0.6% (10) |
| Clothing and accessories, including shoe, stores | 0.3% (12) | 0.1% (3) | 0.5% (9) |
| Other direct selling establishments | 0.3% (12) | 0.2% (4) | 0.4% (8) |
| Radio, TV, and computer stores | 0.3% (11) | 0.5% (11) | 0.0% (0) |
| Data processing, libraries, and other information services | 0.3% (11) | 0.2% (5) | 0.3% (6) |
| Private households | 0.2% (9) | 0.0% (0) | 0.5% (9) |
| U. S. Postal service | 0.2% (9) | 0.4% (9) | 0.0% (0) |
| Beverage and tobacco products | 0.2% (8) | 0.0% (0) | 0.4% (8) |
| Miscellaneous durable goods merchant wholesalers | 0.2% (8) | 0.0% (0) | 0.4% (8) |
| Gasoline stations | 0.2% (8) | 0.2% (5) | 0.2% (3) |
| Music stores | 0.2% (8) | 0.4% (8) | 0.0% (0) |
| Air transportation | 0.2% (8) | 0.4% (8) | 0.0% (0) |
| Farm supplies merchant wholesalers | 0.2% (7) | 0.3% (7) | 0.0% (0) |
| Petroleum and petroleum products merchant wholesalers | 0.2% (7) | 0.3% (7) | 0.0% (0) |
| Furniture and home furnishings, and household appliance stores | 0.2% (7) | 0.3% (7) | 0.0% (0) |
| Electrical and electronic goods merchant wholesalers | 0.2% (7) | 0.3% (7) | 0.0% (0) |
| Professional and commercial equipment and supplies merchant wholesalers | 0.2% (7) | 0.3% (7) | 0.0% (0) |
| Alcoholic beverages merchant wholesalers | 0.2% (6) | 0.3% (6) | 0.0% (0) |
| Chemicals | 0.2% (6) | 0.3% (6) | 0.0% (0) |
| Plastics and rubber products | 0.2% (6) | 0.3% (6) | 0.0% (0) |
| Mining, quarrying, and oil and gas extraction | 0.1% (5) | 0.2% (5) | 0.0% (0) |
| Furniture and home furnishing merchant wholesalers | 0.1% (4) | 0.0% (0) | 0.2% (4) |
| Electronic shopping and mail-order houses | 0.1% (4) | 0.2% (4) | 0.0% (0) |
| Petroleum and coal products | 0.1% (4) | 0.2% (4) | 0.0% (0) |
| Rail transportation | 0.1% (4) | 0.0% (0) | 0.2% (4) |
| Lumber and other construction materials merchant wholesalers | 0.1% (4) | 0.2% (4) | 0.0% (0) |
| Machinery, equipment, and supplies merchant wholesalers | 0.1% (3) | 0.1% (3) | 0.0% (0) |
Unemployment in District 1, Taneytown
- Unemployment by race in 2000
- Unemployment rate for White non-Hispanic residents
- 2.9%Males
- 4.9%Females
- Unemployment rate for two or more race residents
- 25.0%Females
Time leaving home to go to work

<5am:
| District 1, Taneytown: | 6.9% (265) |
| Maryland: | 3.0% (77,561) |
5:30am:
| District 1, Taneytown: | 3.9% (151) |
| Maryland: | 3.2% (81,972) |
6am:
| District 1, Taneytown: | 7.3% (283) |
| Maryland: | 4.7% (120,768) |
6:30am:
| District 1, Taneytown: | 14.5% (558) |
| Maryland: | 9.1% (235,203) |
7am:
| District 1, Taneytown: | 12.1% (466) |
| Maryland: | 10.3% (267,702) |
7:30am:
| District 1, Taneytown: | 13.1% (505) |
| Maryland: | 14.9% (386,941) |
8am:
| District 1, Taneytown: | 9.7% (373) |
| Maryland: | 14.3% (370,838) |
8:30am:
| District 1, Taneytown: | 5.8% (222) |
| Maryland: | 11.6% (300,061) |
9am:
| District 1, Taneytown: | 5.7% (218) |
| Maryland: | 6.0% (154,337) |
10am:
| District 1, Taneytown: | 2.1% (81) |
| Maryland: | 5.9% (151,747) |
11am:
| District 1, Taneytown: | 1.3% (50) |
| Maryland: | 2.2% (56,218) |
4pm:
| District 1, Taneytown: | 7.8% (300) |
| Maryland: | 5.3% (136,187) |
>4pm:
| District 1, Taneytown: | 6.0% (230) |
| Maryland: | 5.4% (139,172) |
Travel time to work


Less than 5 minutes:
| District 1, Taneytown: | 4.8% (185) |
| Maryland: | 1.8% (47,843) |
5 to 9 minutes:
| District 1, Taneytown: | 10.0% (386) |
| Maryland: | 6.6% (169,884) |
10 to 14 minutes:
| District 1, Taneytown: | 5.4% (207) |
| Maryland: | 10.5% (271,204) |
15 to 19 minutes:
| District 1, Taneytown: | 8.8% (339) |
| Maryland: | 12.4% (320,679) |
20 to 24 minutes:
| District 1, Taneytown: | 14.9% (573) |
| Maryland: | 13.0% (337,452) |
25 to 29 minutes:
| District 1, Taneytown: | 6.1% (236) |
| Maryland: | 6.1% (158,702) |
30 to 34 minutes:
| District 1, Taneytown: | 12.2% (470) |
| Maryland: | 14.5% (375,140) |
35 to 39 minutes:
| District 1, Taneytown: | 3.8% (145) |
| Maryland: | 3.5% (91,893) |
40 to 44 minutes:
| District 1, Taneytown: | 4.3% (165) |
| Maryland: | 4.8% (123,823) |
45 to 59 minutes:
| District 1, Taneytown: | 10.1% (388) |
| Maryland: | 11.3% (291,586) |
60 to 89 minutes:
| District 1, Taneytown: | 11.9% (459) |
| Maryland: | 8.6% (223,613) |
90 or more minutes:
| District 1, Taneytown: | 3.9% (149) |
| Maryland: | 3.6% (93,148) |
Means of transportation to work


Drove car alone:
| District 1, Taneytown: | 80.6% (3,106) |
| Maryland: | 73.7% (1,910,917) |
Carpooled:
| District 1, Taneytown: | 12.7% (491) |
| Maryland: | 12.4% (320,992) |
Bus or trolley bus:
| District 1, Taneytown: | 0.3% (12) |
| Maryland: | 3.6% (93,111) |
Streetcar or trolley car:
| District 1, Taneytown: | 0.2% (6) |
| Maryland: | 0.1% (1,619) |
Bicycle:
| District 1, Taneytown: | 0.2% (9) |
| Maryland: | 0.2% (4,843) |
Walked:
| District 1, Taneytown: | 1.5% (57) |
| Maryland: | 2.5% (64,852) |
Other means:
| District 1, Taneytown: | 0.5% (21) |
| Maryland: | 0.6% (14,621) |
Private vehicle occupancy

Drove alone:
| District 1, Taneytown: | 86.3% (3,106) |
| Maryland: | 85.6% (1,910,917) |
In 2 person carpool:
| District 1, Taneytown: | 9.8% (352) |
| Maryland: | 11.2% (249,591) |
In 3 person carpool:
| District 1, Taneytown: | 1.3% (46) |
| Maryland: | 1.9% (43,068) |
In 4 person carpool:
| District 1, Taneytown: | 1.8% (65) |
| Maryland: | 0.7% (15,540) |
In 5-6 person carpool:
| District 1, Taneytown: | 0.3% (10) |
| Maryland: | 0.3% (6,773) |
In 7+ person carpool:
| District 1, Taneytown: | 0.5% (18) |
| Maryland: | 0.3% (6,020) |
Class of workers
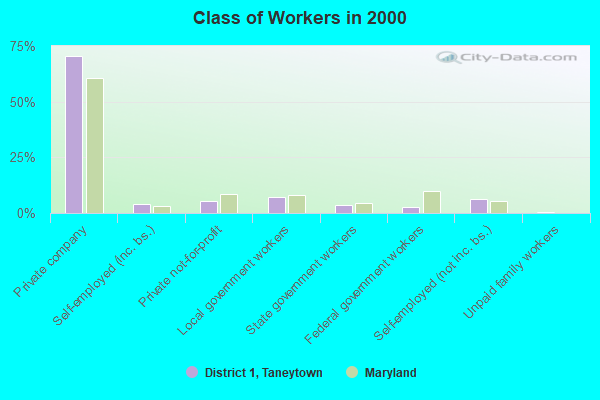
Employee of private company:
| District 1, Taneytown: | 70.5% (2,740) |
| Maryland: | 60.5% (1,579,238) |
Self-employed in own incorporated business:
| District 1, Taneytown: | 3.9% (150) |
| Maryland: | 3.2% (82,204) |
Private not-for-profit wage and salary workers:
| District 1, Taneytown: | 5.6% (218) |
| Maryland: | 8.4% (219,162) |
Local government workers:
| District 1, Taneytown: | 7.4% (286) |
| Maryland: | 7.9% (204,895) |
State government workers:
| District 1, Taneytown: | 3.4% (131) |
| Maryland: | 4.4% (114,670) |
Federal government workers:
| District 1, Taneytown: | 2.6% (103) |
| Maryland: | 10.0% (262,046) |
Self-employed workers in own not incorporated business:
| District 1, Taneytown: | 6.1% (236) |
| Maryland: | 5.4% (140,769) |
Unpaid family workers:
| District 1, Taneytown: | 0.6% (25) |
| Maryland: | 0.2% (5,473) |

Employee of private company - Males:
| District 1, Taneytown: | 72.6% (1,510) |
| Maryland: | 64.1% (851,203) |
Self-employed in own incorporated business - Males:
| District 1, Taneytown: | 4.4% (92) |
| Maryland: | 4.5% (59,935) |
Private not-for-profit wage and salary workers - Males:
| District 1, Taneytown: | 2.5% (52) |
| Maryland: | 5.6% (74,545) |
Local government workers - Males:
| District 1, Taneytown: | 7.3% (151) |
| Maryland: | 6.0% (80,099) |
State government workers - Males:
| District 1, Taneytown: | 2.4% (49) |
| Maryland: | 3.8% (49,893) |
Federal government workers - Males:
| District 1, Taneytown: | 3.0% (62) |
| Maryland: | 9.9% (131,256) |
Self-employed workers in own not incorporated business - Males:
| District 1, Taneytown: | 7.1% (148) |
| Maryland: | 6.0% (79,372) |
Unpaid family workers - Males:
| District 1, Taneytown: | 0.8% (17) |
| Maryland: | 0.2% (2,117) |

Employee of private company - Females:
| District 1, Taneytown: | 68.0% (1,230) |
| Maryland: | 56.9% (728,035) |
Self-employed in own incorporated business - Females:
| District 1, Taneytown: | 3.2% (58) |
| Maryland: | 1.7% (22,269) |
Private not-for-profit wage and salary workers - Females:
| District 1, Taneytown: | 9.2% (166) |
| Maryland: | 11.3% (144,617) |
Local government workers - Females:
| District 1, Taneytown: | 7.5% (135) |
| Maryland: | 9.7% (124,796) |
State government workers - Females:
| District 1, Taneytown: | 4.5% (82) |
| Maryland: | 5.1% (64,777) |
Federal government workers - Females:
| District 1, Taneytown: | 2.3% (41) |
| Maryland: | 10.2% (130,790) |
Self-employed workers in own not incorporated business - Females:
| District 1, Taneytown: | 4.9% (88) |
| Maryland: | 4.8% (61,397) |
Unpaid family workers - Females:
| District 1, Taneytown: | 0.4% (8) |
| Maryland: | 0.3% (3,356) |