Work and Jobs in District 17, Hagerstown, Maryland (MD) Detailed Stats
Occupations, Industries, Unemployment, Workers, Commute
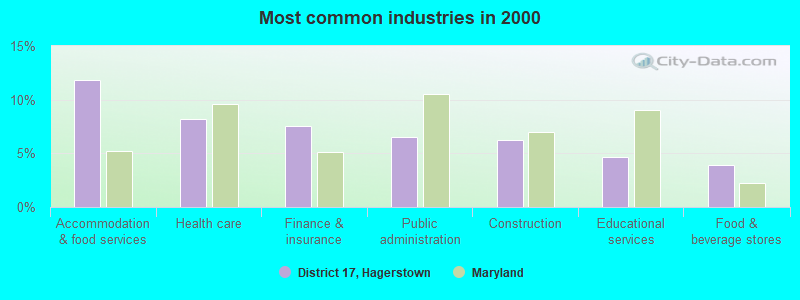
The most common industries in District 17, Hagerstown are: Accommodation & food services (11.8% of civilian employees), Health care (8.2% of civilian employees), Finance & insurance (7.5% of civilian employees). 74.5% of workers are employees of private companies, which is 18.7% greater than the rate of 60.5% across the entire state of Maryland.
Most common industries
Most common industries | |||
|---|---|---|---|
Industry | All | Males | Females |
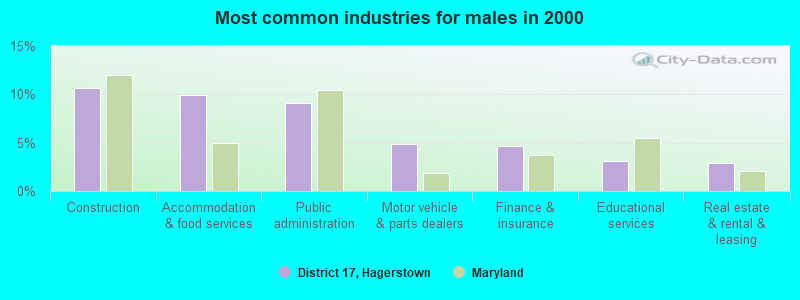
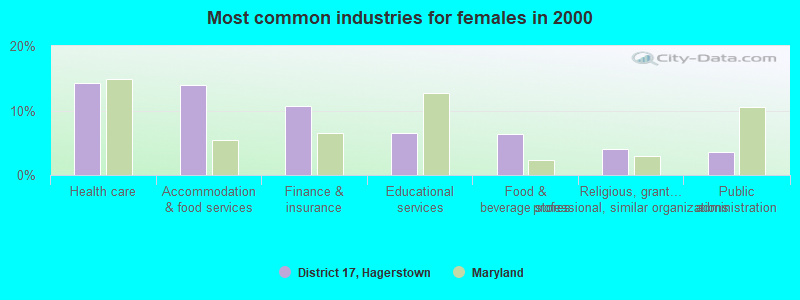
| Accommodation and food services | 11.8% (390) | 9.9% (173) | 14.0% (217) |
| Health care | 8.2% (270) | 2.8% (49) | 14.2% (221) |
| Finance and insurance | 7.5% (248) | 4.7% (82) | 10.7% (166) |
| Public administration | 6.5% (215) | 9.1% (160) | 3.5% (55) |
| Construction | 6.2% (206) | 10.7% (187) | 1.2% (19) |
| Educational services | 4.7% (155) | 3.1% (54) | 6.5% (101) |
| Food and beverage stores | 3.9% (129) | 1.7% (30) | 6.4% (99) |
| Administrative and support and waste management services | 2.8% (94) | 2.9% (51) | 2.8% (43) |
| Motor vehicle and parts dealers | 2.8% (93) | 4.9% (86) | 0.5% (7) |
| Religious, grantmaking, civic, professional, and similar organizations | 2.5% (84) | 1.2% (21) | 4.1% (63) |
| Professional, scientific, and technical services | 2.5% (81) | 2.2% (38) | 2.8% (43) |
| Real estate and rental and leasing | 2.4% (80) | 2.9% (51) | 1.9% (29) |
| Social assistance | 1.8% (60) | 0.6% (11) | 3.2% (49) |
| Printing and related support activities | 1.8% (60) | 2.5% (44) | 1.0% (16) |
| Transportation equipment | 1.8% (58) | 2.7% (48) | 0.6% (10) |
| Textile mills and textile products | 1.6% (53) | 1.8% (31) | 1.4% (22) |
| Truck transportation | 1.6% (52) | 2.4% (42) | 0.6% (10) |
| Food | 1.5% (51) | 1.9% (33) | 1.2% (18) |
| Office supplies and stationery stores | 1.5% (48) | 2.2% (38) | 0.6% (10) |
| Personal and laundry services | 1.4% (47) | 0.0% (0) | 3.0% (47) |
| Apparel | 1.4% (46) | 2.1% (36) | 0.6% (10) |
| Repair and maintenance | 1.3% (43) | 2.4% (42) | 0.1% (1) |
| Used merchandise, gift, novelty, and souvenir, and other miscellaneous stores | 1.3% (42) | 1.3% (23) | 1.2% (19) |
| Furniture and related product manufacturing | 1.2% (38) | 1.4% (25) | 0.8% (13) |
| Other transportation, and support activities, and couriers | 1.2% (38) | 1.3% (23) | 1.0% (15) |
| Broadcasting and telecommunications | 1.1% (37) | 1.8% (31) | 0.4% (6) |
| Arts, entertainment, and recreation | 1.1% (35) | 0.4% (7) | 1.8% (28) |
| Data processing, libraries, and other information services | 1.0% (33) | 0.0% (0) | 2.1% (33) |
| Groceries and related products merchant wholesalers | 1.0% (33) | 1.5% (26) | 0.5% (7) |
| Radio, TV, and computer stores | 0.9% (31) | 1.3% (23) | 0.5% (8) |
| Publishing, and motion picture and sound recording industries | 0.9% (29) | 0.7% (13) | 1.0% (16) |
| Gasoline stations | 0.8% (26) | 0.7% (12) | 0.9% (14) |
| Leather and allied products | 0.8% (25) | 1.0% (17) | 0.5% (8) |
| Furniture and home furnishings, and household appliance stores | 0.7% (23) | 0.9% (16) | 0.5% (7) |
| Plastics and rubber products | 0.7% (23) | 1.3% (23) | 0.0% (0) |
| Metal and metal products | 0.7% (23) | 1.3% (23) | 0.0% (0) |
| Machinery | 0.6% (20) | 1.1% (20) | 0.0% (0) |
| Miscellaneous manufacturing | 0.6% (20) | 0.7% (13) | 0.5% (7) |
| U. S. Postal service | 0.5% (18) | 1.0% (18) | 0.0% (0) |
| Warehousing and storage | 0.5% (17) | 0.6% (10) | 0.5% (7) |
| Chemicals | 0.5% (16) | 0.4% (7) | 0.6% (9) |
| Building material and garden equipment and supplies dealers | 0.5% (16) | 0.9% (16) | 0.0% (0) |
| Sporting goods, camera, and hobby and toy stores | 0.4% (13) | 0.0% (0) | 0.8% (13) |
| Book stores and news dealers | 0.3% (11) | 0.0% (0) | 0.7% (11) |
| Department and other general merchandise stores | 0.3% (11) | 0.0% (0) | 0.7% (11) |
| Clothing and accessories, including shoe, stores | 0.3% (11) | 0.0% (0) | 0.7% (11) |
| Paper | 0.3% (10) | 0.6% (10) | 0.0% (0) |
| Electrical equipment, appliances, and components | 0.3% (10) | 0.6% (10) | 0.0% (0) |
| Private households | 0.3% (10) | 0.0% (0) | 0.6% (10) |
| Air transportation | 0.3% (9) | 0.5% (9) | 0.0% (0) |
| Agriculture, forestry, fishing and hunting | 0.2% (8) | 0.5% (8) | 0.0% (0) |
| Paper and paper products merchant wholesalers | 0.2% (8) | 0.5% (8) | 0.0% (0) |
| Other direct selling establishments | 0.2% (7) | 0.0% (0) | 0.5% (7) |
| Hardware, plumbing and heating equipment, and supplies merchant wholesalers | 0.2% (7) | 0.4% (7) | 0.0% (0) |
| Drugs, sundries, and chemical and allied products merchant wholesalers | 0.2% (6) | 0.0% (0) | 0.4% (6) |
| Recyclable material merchant wholesalers | 0.2% (6) | 0.0% (0) | 0.4% (6) |
| Utilities | 0.2% (6) | 0.0% (0) | 0.4% (6) |
| Computer and electronic products | 0.2% (6) | 0.3% (5) | 0.1% (1) |
| Beverage and tobacco products | 0.2% (6) | 0.0% (0) | 0.4% (6) |
| Electronic shopping and mail-order houses | 0.2% (5) | 0.2% (3) | 0.1% (2) |
| Water transportation | 0.2% (5) | 0.3% (5) | 0.0% (0) |
| Music stores | 0.2% (5) | 0.3% (5) | 0.0% (0) |
| Lumber and other construction materials merchant wholesalers | 0.2% (5) | 0.3% (5) | 0.0% (0) |
| Nonmetallic mineral products | 0.2% (5) | 0.3% (5) | 0.0% (0) |
| Health and personal care, except drug, stores | 0.1% (4) | 0.1% (2) | 0.1% (2) |
| Jewelry, luggage, and leather goods stores | 0.1% (4) | 0.0% (0) | 0.3% (4) |
| Petroleum and petroleum products merchant wholesalers | 0.1% (4) | 0.2% (4) | 0.0% (0) |
| Professional and commercial equipment and supplies merchant wholesalers | 0.1% (4) | 0.2% (4) | 0.0% (0) |
| Machinery, equipment, and supplies merchant wholesalers | 0.1% (3) | 0.1% (2) | 0.1% (1) |
| Vending machine operators | 0.1% (2) | 0.1% (2) | 0.0% (0) |
| Pharmacies and drug stores | 0.1% (2) | 0.1% (2) | 0.0% (0) |
| Electrical and electronic goods merchant wholesalers | 0.1% (2) | 0.1% (2) | 0.0% (0) |
Unemployment in District 17, Hagerstown
- Unemployment by race in 2000
- Unemployment rate for White non-Hispanic residents
- 3.3%Males
- 4.3%Females
- Unemployment rate for Black residents
- 11.1%Males
Time leaving home to go to work

<5am:
| District 17, Hagerstown: | 4.8% (155) |
| Maryland: | 3.0% (77,561) |
5:30am:
| District 17, Hagerstown: | 4.6% (150) |
| Maryland: | 3.2% (81,972) |
6am:
| District 17, Hagerstown: | 5.8% (187) |
| Maryland: | 4.7% (120,768) |
6:30am:
| District 17, Hagerstown: | 8.0% (260) |
| Maryland: | 9.1% (235,203) |
7am:
| District 17, Hagerstown: | 12.5% (403) |
| Maryland: | 10.3% (267,702) |
7:30am:
| District 17, Hagerstown: | 14.2% (459) |
| Maryland: | 14.9% (386,941) |
8am:
| District 17, Hagerstown: | 9.7% (314) |
| Maryland: | 14.3% (370,838) |
8:30am:
| District 17, Hagerstown: | 8.6% (277) |
| Maryland: | 11.6% (300,061) |
9am:
| District 17, Hagerstown: | 3.7% (119) |
| Maryland: | 6.0% (154,337) |
10am:
| District 17, Hagerstown: | 2.9% (94) |
| Maryland: | 5.9% (151,747) |
11am:
| District 17, Hagerstown: | 4.1% (133) |
| Maryland: | 2.2% (56,218) |
12pm:
| District 17, Hagerstown: | 0.9% (28) |
| Maryland: | 1.0% (26,260) |
4pm:
| District 17, Hagerstown: | 9.6% (309) |
| Maryland: | 5.3% (136,187) |
>4pm:
| District 17, Hagerstown: | 8.7% (280) |
| Maryland: | 5.4% (139,172) |
Travel time to work


Less than 5 minutes:
| District 17, Hagerstown: | 3.2% (105) |
| Maryland: | 1.8% (47,843) |
5 to 9 minutes:
| District 17, Hagerstown: | 17.4% (563) |
| Maryland: | 6.6% (169,884) |
10 to 14 minutes:
| District 17, Hagerstown: | 21.1% (682) |
| Maryland: | 10.5% (271,204) |
15 to 19 minutes:
| District 17, Hagerstown: | 22.9% (741) |
| Maryland: | 12.4% (320,679) |
20 to 24 minutes:
| District 17, Hagerstown: | 10.0% (323) |
| Maryland: | 13.0% (337,452) |
25 to 29 minutes:
| District 17, Hagerstown: | 3.2% (105) |
| Maryland: | 6.1% (158,702) |
30 to 34 minutes:
| District 17, Hagerstown: | 7.6% (245) |
| Maryland: | 14.5% (375,140) |
35 to 39 minutes:
| District 17, Hagerstown: | 1.7% (55) |
| Maryland: | 3.5% (91,893) |
40 to 44 minutes:
| District 17, Hagerstown: | 2.4% (77) |
| Maryland: | 4.8% (123,823) |
45 to 59 minutes:
| District 17, Hagerstown: | 2.6% (83) |
| Maryland: | 11.3% (291,586) |
60 to 89 minutes:
| District 17, Hagerstown: | 4.2% (137) |
| Maryland: | 8.6% (223,613) |
90 or more minutes:
| District 17, Hagerstown: | 1.6% (52) |
| Maryland: | 3.6% (93,148) |
Means of transportation to work


Drove car alone:
| District 17, Hagerstown: | 75.9% (2,454) |
| Maryland: | 73.7% (1,910,917) |
Carpooled:
| District 17, Hagerstown: | 14.1% (456) |
| Maryland: | 12.4% (320,992) |
Bus or trolley bus:
| District 17, Hagerstown: | 1.0% (33) |
| Maryland: | 3.6% (93,111) |
Taxicab:
| District 17, Hagerstown: | 0.8% (26) |
| Maryland: | 0.3% (6,714) |
Bicycle:
| District 17, Hagerstown: | 0.1% (4) |
| Maryland: | 0.2% (4,843) |
Walked:
| District 17, Hagerstown: | 4.5% (146) |
| Maryland: | 2.5% (64,852) |
Other means:
| District 17, Hagerstown: | 1.5% (49) |
| Maryland: | 0.6% (14,621) |
Private vehicle occupancy

Drove alone:
| District 17, Hagerstown: | 84.3% (2,454) |
| Maryland: | 85.6% (1,910,917) |
In 2 person carpool:
| District 17, Hagerstown: | 12.1% (352) |
| Maryland: | 11.2% (249,591) |
In 3 person carpool:
| District 17, Hagerstown: | 2.7% (80) |
| Maryland: | 1.9% (43,068) |
In 4 person carpool:
| District 17, Hagerstown: | 0.0% (1) |
| Maryland: | 0.7% (15,540) |
In 5-6 person carpool:
| District 17, Hagerstown: | 0.5% (14) |
| Maryland: | 0.3% (6,773) |
In 7+ person carpool:
| District 17, Hagerstown: | 0.3% (9) |
| Maryland: | 0.3% (6,020) |
Class of workers
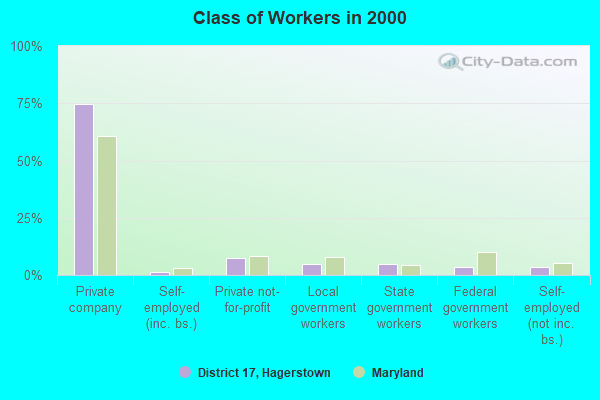
Employee of private company:
| District 17, Hagerstown: | 74.5% (2,461) |
| Maryland: | 60.5% (1,579,238) |
Self-employed in own incorporated business:
| District 17, Hagerstown: | 1.4% (47) |
| Maryland: | 3.2% (82,204) |
Private not-for-profit wage and salary workers:
| District 17, Hagerstown: | 7.2% (238) |
| Maryland: | 8.4% (219,162) |
Local government workers:
| District 17, Hagerstown: | 5.0% (165) |
| Maryland: | 7.9% (204,895) |
State government workers:
| District 17, Hagerstown: | 4.6% (152) |
| Maryland: | 4.4% (114,670) |
Federal government workers:
| District 17, Hagerstown: | 3.6% (118) |
| Maryland: | 10.0% (262,046) |
Self-employed workers in own not incorporated business:
| District 17, Hagerstown: | 3.7% (122) |
| Maryland: | 5.4% (140,769) |

Employee of private company - Males:
| District 17, Hagerstown: | 78.5% (1,374) |
| Maryland: | 64.1% (851,203) |
Self-employed in own incorporated business - Males:
| District 17, Hagerstown: | 0.8% (14) |
| Maryland: | 4.5% (59,935) |
Private not-for-profit wage and salary workers - Males:
| District 17, Hagerstown: | 3.3% (57) |
| Maryland: | 5.6% (74,545) |
Local government workers - Males:
| District 17, Hagerstown: | 5.1% (90) |
| Maryland: | 6.0% (80,099) |
State government workers - Males:
| District 17, Hagerstown: | 5.1% (90) |
| Maryland: | 3.8% (49,893) |
Federal government workers - Males:
| District 17, Hagerstown: | 4.4% (77) |
| Maryland: | 9.9% (131,256) |
Self-employed workers in own not incorporated business - Males:
| District 17, Hagerstown: | 2.8% (49) |
| Maryland: | 6.0% (79,372) |

Employee of private company - Females:
| District 17, Hagerstown: | 70.0% (1,087) |
| Maryland: | 56.9% (728,035) |
Self-employed in own incorporated business - Females:
| District 17, Hagerstown: | 2.1% (33) |
| Maryland: | 1.7% (22,269) |
Private not-for-profit wage and salary workers - Females:
| District 17, Hagerstown: | 11.7% (181) |
| Maryland: | 11.3% (144,617) |
Local government workers - Females:
| District 17, Hagerstown: | 4.8% (75) |
| Maryland: | 9.7% (124,796) |
State government workers - Females:
| District 17, Hagerstown: | 4.0% (62) |
| Maryland: | 5.1% (64,777) |
Federal government workers - Females:
| District 17, Hagerstown: | 2.6% (41) |
| Maryland: | 10.2% (130,790) |
Self-employed workers in own not incorporated business - Females:
| District 17, Hagerstown: | 4.7% (73) |
| Maryland: | 4.8% (61,397) |