Work and Jobs in East Contra Costa, California (CA) Detailed Stats
Occupations, Industries, Unemployment, Workers, Commute
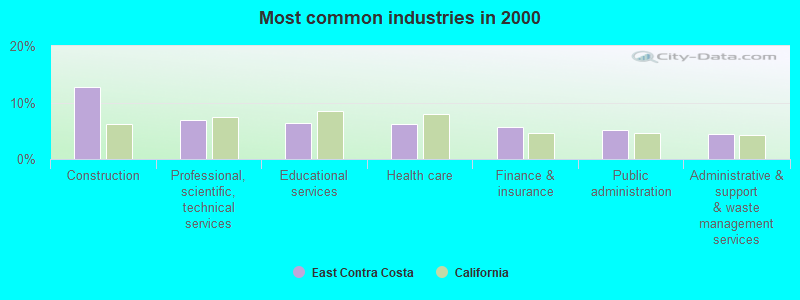
The most common industries in East Contra Costa are: Construction (12.8% of civilian employees), Professional, scientific, technical services (6.9% of civilian employees), Educational services (6.4% of civilian employees). 69.9% of workers are employees of private companies, which is 2.7% greater than the rate of 68.0% across the entire state of California.
Most common industries
Most common industries | |||
|---|---|---|---|
Industry | All | Males | Females |
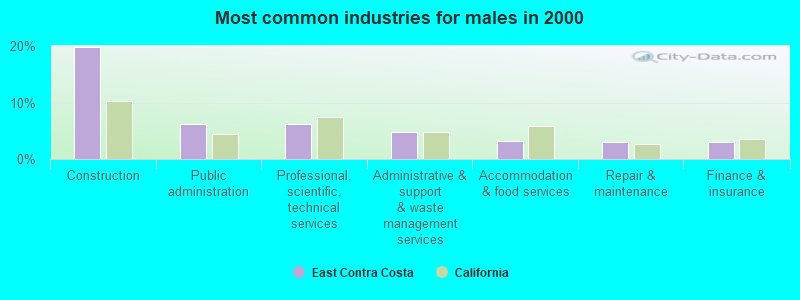
| Construction | 12.8% (4,267) | 19.9% (3,796) | 3.3% (471) |
| Professional, scientific, and technical services | 6.9% (2,315) | 6.1% (1,170) | 8.0% (1,145) |
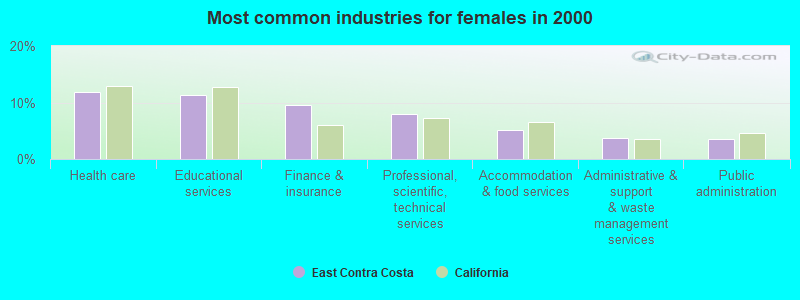
| Educational services | 6.4% (2,147) | 2.7% (519) | 11.4% (1,628) |
| Health care | 6.2% (2,062) | 1.9% (371) | 11.8% (1,691) |
| Finance and insurance | 5.7% (1,920) | 2.9% (560) | 9.5% (1,360) |
| Public administration | 5.1% (1,694) | 6.3% (1,198) | 3.5% (496) |
| Administrative and support and waste management services | 4.4% (1,454) | 4.8% (915) | 3.8% (539) |
| Accommodation and food services | 4.1% (1,368) | 3.3% (623) | 5.2% (745) |
| Food and beverage stores | 3.0% (1,007) | 2.8% (528) | 3.4% (479) |
| Real estate and rental and leasing | 2.4% (803) | 1.8% (343) | 3.2% (460) |
| Computer and electronic products | 2.3% (763) | 2.6% (491) | 1.9% (272) |
| Broadcasting and telecommunications | 2.2% (723) | 2.4% (461) | 1.8% (262) |
| Repair and maintenance | 2.1% (714) | 3.0% (576) | 1.0% (138) |
| Other transportation, and support activities, and couriers | 2.0% (661) | 2.5% (478) | 1.3% (183) |
| Agriculture, forestry, fishing and hunting | 1.8% (591) | 2.6% (495) | 0.7% (96) |
| Motor vehicle and parts dealers | 1.7% (584) | 2.5% (483) | 0.7% (101) |
| Personal and laundry services | 1.7% (561) | 0.9% (173) | 2.7% (388) |
| Social assistance | 1.7% (555) | 0.3% (63) | 3.4% (492) |
| Department and other general merchandise stores | 1.6% (546) | 1.1% (208) | 2.4% (338) |
| Utilities | 1.3% (431) | 2.1% (396) | 0.2% (35) |
| Arts, entertainment, and recreation | 1.3% (418) | 1.4% (268) | 1.0% (150) |
| Religious, grantmaking, civic, professional, and similar organizations | 1.2% (412) | 0.7% (126) | 2.0% (286) |
| U. S. Postal service | 1.1% (370) | 0.8% (158) | 1.5% (212) |
| Metal and metal products | 1.1% (368) | 1.6% (312) | 0.4% (56) |
| Radio, TV, and computer stores | 0.9% (316) | 1.1% (204) | 0.8% (112) |
| Building material and garden equipment and supplies dealers | 0.9% (302) | 1.0% (190) | 0.8% (112) |
| Groceries and related products merchant wholesalers | 0.9% (298) | 1.2% (231) | 0.5% (67) |
| Truck transportation | 0.8% (258) | 1.2% (221) | 0.3% (37) |
| Printing and related support activities | 0.8% (254) | 0.9% (166) | 0.6% (88) |
| Miscellaneous manufacturing | 0.7% (246) | 0.8% (162) | 0.6% (84) |
| Air transportation | 0.7% (236) | 1.0% (183) | 0.4% (53) |
| Machinery | 0.7% (234) | 1.1% (210) | 0.2% (24) |
| Pharmacies and drug stores | 0.6% (210) | 0.3% (63) | 1.0% (147) |
| Other direct selling establishments | 0.6% (202) | 0.5% (86) | 0.8% (116) |
| Furniture and home furnishings, and household appliance stores | 0.6% (194) | 0.6% (117) | 0.5% (77) |
| Publishing, and motion picture and sound recording industries | 0.6% (192) | 0.6% (107) | 0.6% (85) |
| Transportation equipment | 0.6% (190) | 0.8% (156) | 0.2% (34) |
| Paper | 0.5% (179) | 0.8% (148) | 0.2% (31) |
| Petroleum and coal products | 0.5% (178) | 0.7% (130) | 0.3% (48) |
| Data processing, libraries, and other information services | 0.5% (176) | 0.3% (58) | 0.8% (118) |
| Food | 0.5% (171) | 0.7% (128) | 0.3% (43) |
| Nonmetallic mineral products | 0.5% (168) | 0.7% (129) | 0.3% (39) |
| Used merchandise, gift, novelty, and souvenir, and other miscellaneous stores | 0.5% (168) | 0.3% (60) | 0.8% (108) |
| Electrical and electronic goods merchant wholesalers | 0.5% (164) | 0.7% (131) | 0.2% (33) |
| Chemicals | 0.5% (162) | 0.7% (128) | 0.2% (34) |
| Professional and commercial equipment and supplies merchant wholesalers | 0.5% (158) | 0.7% (132) | 0.2% (26) |
| Private households | 0.5% (154) | 0.0% (8) | 1.0% (146) |
| Miscellaneous nondurable goods merchant wholesalers | 0.4% (131) | 0.4% (84) | 0.3% (47) |
| Electrical equipment, appliances, and components | 0.4% (121) | 0.4% (77) | 0.3% (44) |
| Motor vehicles, parts and supplies merchant wholesalers | 0.4% (118) | 0.5% (103) | 0.1% (15) |
| Machinery, equipment, and supplies merchant wholesalers | 0.3% (105) | 0.5% (90) | 0.1% (15) |
| Gasoline stations | 0.3% (104) | 0.2% (39) | 0.5% (65) |
| Sporting goods, camera, and hobby and toy stores | 0.3% (88) | 0.4% (71) | 0.1% (17) |
| Miscellaneous durable goods merchant wholesalers | 0.3% (87) | 0.4% (71) | 0.1% (16) |
| Mining, quarrying, and oil and gas extraction | 0.2% (82) | 0.3% (66) | 0.1% (16) |
| Rail transportation | 0.2% (71) | 0.3% (59) | 0.1% (12) |
| Drugs, sundries, and chemical and allied products merchant wholesalers | 0.2% (69) | 0.2% (38) | 0.2% (31) |
| Health and personal care, except drug, stores | 0.2% (68) | 0.2% (43) | 0.2% (25) |
| Furniture and related product manufacturing | 0.2% (65) | 0.3% (57) | 0.1% (8) |
| Beverage and tobacco products | 0.2% (64) | 0.2% (45) | 0.1% (19) |
| Plastics and rubber products | 0.2% (56) | 0.2% (40) | 0.1% (16) |
| Hardware, plumbing and heating equipment, and supplies merchant wholesalers | 0.2% (55) | 0.2% (37) | 0.1% (18) |
| Office supplies and stationery stores | 0.1% (50) | 0.3% (48) | 0.0% (2) |
| Music stores | 0.1% (44) | 0.1% (14) | 0.2% (30) |
| Furniture and home furnishing merchant wholesalers | 0.1% (43) | 0.2% (37) | 0.0% (6) |
| Petroleum and petroleum products merchant wholesalers | 0.1% (42) | 0.2% (37) | 0.0% (5) |
| Wood products | 0.1% (36) | 0.1% (11) | 0.2% (25) |
| Clothing and accessories, including shoe, stores | 0.1% (36) | 0.0% (7) | 0.2% (29) |
| Warehousing and storage | 0.1% (35) | 0.1% (27) | 0.1% (8) |
| Lumber and other construction materials merchant wholesalers | 0.1% (33) | 0.1% (25) | 0.1% (8) |
| Apparel | 0.1% (32) | 0.2% (32) | 0.0% (0) |
Unemployment in East Contra Costa
- Unemployment by race in 2000
- Unemployment rate for White non-Hispanic residents
- 2.9%Males
- 3.9%Females
- Unemployment rate for Black residents
- 4.8%Males
- 6.3%Females
- Unemployment rate for American Indian and Alaska Native residents
- 3.6%Males
- Unemployment rate for Asian residents
- 3.1%Males
- 2.2%Females
- Unemployment rate for other race residents
- 6.6%Males
- 8.8%Females
- Unemployment rate for two or more race residents
- 0.7%Males
- 5.2%Females
- Unemployment rate for Hispanic or Latino residents
- 4.0%Males
- 7.9%Females
Time leaving home to go to work

<5am:
| East Contra Costa: | 11.1% (3,605) |
| California: | 4.2% (606,086) |
5:30am:
| East Contra Costa: | 8.0% (2,590) |
| California: | 3.6% (523,209) |
6am:
| East Contra Costa: | 8.3% (2,709) |
| California: | 4.8% (692,256) |
6:30am:
| East Contra Costa: | 12.1% (3,922) |
| California: | 8.4% (1,216,867) |
7am:
| East Contra Costa: | 7.6% (2,478) |
| California: | 9.4% (1,362,830) |
7:30am:
| East Contra Costa: | 10.0% (3,241) |
| California: | 13.8% (2,006,950) |
8am:
| East Contra Costa: | 9.8% (3,179) |
| California: | 13.7% (1,986,831) |
8:30am:
| East Contra Costa: | 9.3% (3,038) |
| California: | 10.9% (1,577,815) |
9am:
| East Contra Costa: | 3.3% (1,070) |
| California: | 5.4% (778,152) |
10am:
| East Contra Costa: | 4.5% (1,452) |
| California: | 6.7% (972,355) |
11am:
| East Contra Costa: | 1.8% (581) |
| California: | 2.9% (414,479) |
12pm:
| East Contra Costa: | 0.9% (305) |
| California: | 1.3% (189,005) |
4pm:
| East Contra Costa: | 4.8% (1,576) |
| California: | 6.0% (865,284) |
>4pm:
| East Contra Costa: | 4.3% (1,393) |
| California: | 5.3% (776,167) |
Travel time to work


Less than 5 minutes:
| East Contra Costa: | 2.4% (783) |
| California: | 2.2% (324,703) |
5 to 9 minutes:
| East Contra Costa: | 7.7% (2,510) |
| California: | 8.8% (1,280,443) |
10 to 14 minutes:
| East Contra Costa: | 7.3% (2,386) |
| California: | 13.3% (1,930,263) |
15 to 19 minutes:
| East Contra Costa: | 8.4% (2,730) |
| California: | 14.9% (2,157,970) |
20 to 24 minutes:
| East Contra Costa: | 5.2% (1,684) |
| California: | 13.8% (2,004,060) |
25 to 29 minutes:
| East Contra Costa: | 1.8% (595) |
| California: | 5.4% (782,241) |
30 to 34 minutes:
| East Contra Costa: | 7.7% (2,493) |
| California: | 13.9% (2,025,657) |
35 to 39 minutes:
| East Contra Costa: | 2.7% (888) |
| California: | 2.5% (366,487) |
40 to 44 minutes:
| East Contra Costa: | 3.8% (1,240) |
| California: | 3.6% (528,043) |
45 to 59 minutes:
| East Contra Costa: | 14.2% (4,630) |
| California: | 7.9% (1,151,598) |
60 to 89 minutes:
| East Contra Costa: | 21.3% (6,934) |
| California: | 6.4% (933,123) |
90 or more minutes:
| East Contra Costa: | 13.1% (4,266) |
| California: | 3.3% (483,698) |
Means of transportation to work


Drove car alone:
| East Contra Costa: | 75.5% (24,559) |
| California: | 71.8% (10,432,462) |
Carpooled:
| East Contra Costa: | 15.0% (4,862) |
| California: | 14.5% (2,113,313) |
Bus or trolley bus:
| East Contra Costa: | 0.9% (287) |
| California: | 3.8% (549,425) |
Streetcar or trolley car:
| East Contra Costa: | 0.0% (9) |
| California: | 0.1% (21,158) |
Subway or elevated:
| East Contra Costa: | 1.3% (411) |
| California: | 0.7% (107,711) |
Railroad:
| East Contra Costa: | 0.3% (113) |
| California: | 0.3% (41,022) |
Ferryboat:
| East Contra Costa: | 0.0% (3) |
| California: | 0.0% (6,831) |
Taxicab:
| East Contra Costa: | 0.0% (15) |
| California: | 0.1% (9,890) |
Motorcycle:
| East Contra Costa: | 0.1% (20) |
| California: | 0.2% (36,262) |
Bicycle:
| East Contra Costa: | 0.1% (39) |
| California: | 0.8% (120,567) |
Walked:
| East Contra Costa: | 1.8% (570) |
| California: | 2.9% (414,581) |
Other means:
| East Contra Costa: | 0.8% (251) |
| California: | 0.8% (115,064) |
Private vehicle occupancy

Drove alone:
| East Contra Costa: | 83.5% (24,559) |
| California: | 83.2% (10,432,462) |
In 2 person carpool:
| East Contra Costa: | 12.8% (3,776) |
| California: | 12.5% (1,564,905) |
In 3 person carpool:
| East Contra Costa: | 2.3% (686) |
| California: | 2.6% (330,732) |
In 4 person carpool:
| East Contra Costa: | 0.8% (235) |
| California: | 1.0% (119,364) |
In 5-6 person carpool:
| East Contra Costa: | 0.2% (66) |
| California: | 0.5% (57,036) |
In 7+ person carpool:
| East Contra Costa: | 0.3% (99) |
| California: | 0.3% (41,276) |
Class of workers

Employee of private company:
| East Contra Costa: | 69.9% (23,331) |
| California: | 68.0% (10,009,465) |
Self-employed in own incorporated business:
| East Contra Costa: | 2.3% (772) |
| California: | 2.7% (402,392) |
Private not-for-profit wage and salary workers:
| East Contra Costa: | 4.0% (1,331) |
| California: | 5.7% (845,536) |
Local government workers:
| East Contra Costa: | 9.2% (3,073) |
| California: | 8.3% (1,218,764) |
State government workers:
| East Contra Costa: | 3.2% (1,061) |
| California: | 4.0% (594,953) |
Federal government workers:
| East Contra Costa: | 2.7% (912) |
| California: | 2.3% (344,354) |
Self-employed workers in own not incorporated business:
| East Contra Costa: | 8.4% (2,795) |
| California: | 8.5% (1,249,530) |
Unpaid family workers:
| East Contra Costa: | 0.4% (123) |
| California: | 0.4% (53,934) |

Employee of private company - Males:
| East Contra Costa: | 72.8% (13,906) |
| California: | 71.1% (5,716,697) |
Self-employed in own incorporated business - Males:
| East Contra Costa: | 2.7% (525) |
| California: | 3.6% (290,657) |
Private not-for-profit wage and salary workers - Males:
| East Contra Costa: | 2.4% (460) |
| California: | 3.8% (303,997) |
Local government workers - Males:
| East Contra Costa: | 8.1% (1,547) |
| California: | 6.2% (495,927) |
State government workers - Males:
| East Contra Costa: | 2.6% (493) |
| California: | 3.2% (255,434) |
Federal government workers - Males:
| East Contra Costa: | 2.3% (443) |
| California: | 2.5% (198,555) |
Self-employed workers in own not incorporated business - Males:
| East Contra Costa: | 8.6% (1,636) |
| California: | 9.5% (760,853) |
Unpaid family workers - Males:
| East Contra Costa: | 0.5% (100) |
| California: | 0.3% (23,230) |

Employee of private company - Females:
| East Contra Costa: | 66.0% (9,425) |
| California: | 64.3% (4,292,768) |
Self-employed in own incorporated business - Females:
| East Contra Costa: | 1.7% (247) |
| California: | 1.7% (111,735) |
Private not-for-profit wage and salary workers - Females:
| East Contra Costa: | 6.1% (871) |
| California: | 8.1% (541,539) |
Local government workers - Females:
| East Contra Costa: | 10.7% (1,526) |
| California: | 10.8% (722,837) |
State government workers - Females:
| East Contra Costa: | 4.0% (568) |
| California: | 5.1% (339,519) |
Federal government workers - Females:
| East Contra Costa: | 3.3% (469) |
| California: | 2.2% (145,799) |
Self-employed workers in own not incorporated business - Females:
| East Contra Costa: | 8.1% (1,159) |
| California: | 7.3% (488,677) |
Unpaid family workers - Females:
| East Contra Costa: | 0.2% (23) |
| California: | 0.5% (30,704) |