Work and Jobs in East Seattle, Washington (WA) Detailed Stats
Occupations, Industries, Unemployment, Workers, Commute
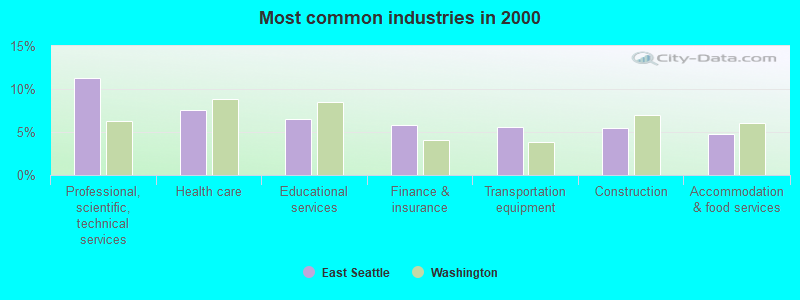
The most common industries in East Seattle are: Professional, scientific, technical services (11.2% of civilian employees), Health care (7.6% of civilian employees), Educational services (6.6% of civilian employees). 73.1% of workers are employees of private companies, which is 9.8% greater than the rate of 66.0% across the entire state of Washington.
Most common industries
Most common industries | |||
|---|---|---|---|
Industry | All | Males | Females |
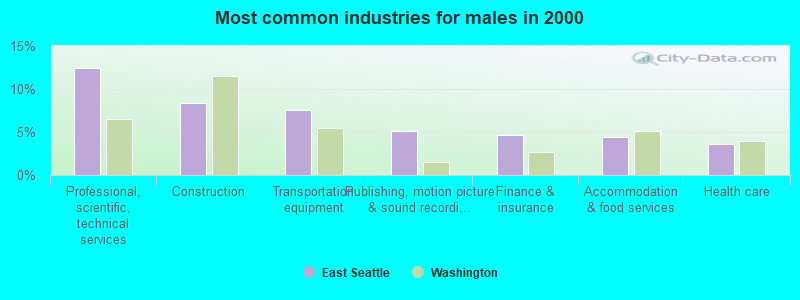
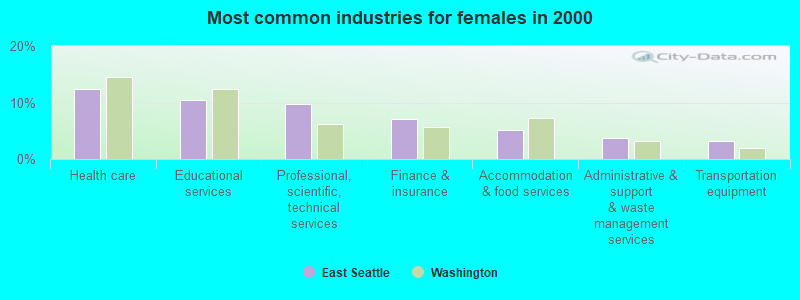
| Professional, scientific, and technical services | 11.2% (29,149) | 12.4% (17,689) | 9.8% (11,460) |
| Health care | 7.6% (19,573) | 3.6% (5,113) | 12.4% (14,460) |
| Educational services | 6.6% (17,007) | 3.3% (4,709) | 10.5% (12,298) |
| Finance and insurance | 5.8% (15,019) | 4.7% (6,636) | 7.2% (8,383) |
| Transportation equipment | 5.6% (14,441) | 7.5% (10,696) | 3.2% (3,745) |
| Construction | 5.5% (14,164) | 8.4% (11,960) | 1.9% (2,204) |
| Accommodation and food services | 4.7% (12,235) | 4.4% (6,274) | 5.1% (5,961) |
| Publishing, and motion picture and sound recording industries | 4.0% (10,447) | 5.1% (7,303) | 2.7% (3,144) |
| Administrative and support and waste management services | 3.4% (8,890) | 3.2% (4,558) | 3.7% (4,332) |
| Real estate and rental and leasing | 2.8% (7,169) | 2.7% (3,824) | 2.9% (3,345) |
| Public administration | 2.7% (6,946) | 2.6% (3,649) | 2.8% (3,297) |
| Broadcasting and telecommunications | 2.3% (6,039) | 2.4% (3,392) | 2.3% (2,647) |
| Computer and electronic products | 2.3% (6,016) | 2.9% (4,144) | 1.6% (1,872) |
| Radio, TV, and computer stores | 2.1% (5,489) | 2.7% (3,856) | 1.4% (1,633) |
| Food and beverage stores | 1.9% (4,889) | 1.7% (2,447) | 2.1% (2,442) |
| Miscellaneous manufacturing | 1.8% (4,604) | 2.2% (3,143) | 1.2% (1,461) |
| Department and other general merchandise stores | 1.7% (4,404) | 1.2% (1,647) | 2.4% (2,757) |
| Arts, entertainment, and recreation | 1.6% (4,182) | 1.4% (2,046) | 1.8% (2,136) |
| Social assistance | 1.5% (3,911) | 0.4% (535) | 2.9% (3,376) |
| Religious, grantmaking, civic, professional, and similar organizations | 1.4% (3,590) | 1.1% (1,574) | 1.7% (2,016) |
| Other transportation, and support activities, and couriers | 1.3% (3,337) | 1.8% (2,538) | 0.7% (799) |
| Personal and laundry services | 1.3% (3,312) | 0.6% (824) | 2.1% (2,488) |
| Data processing, libraries, and other information services | 1.2% (3,073) | 1.4% (2,030) | 0.9% (1,043) |
| Repair and maintenance | 1.1% (2,944) | 1.6% (2,336) | 0.5% (608) |
| Motor vehicle and parts dealers | 1.1% (2,837) | 1.6% (2,287) | 0.5% (550) |
| Air transportation | 1.1% (2,734) | 1.0% (1,385) | 1.2% (1,349) |
| Clothing and accessories, including shoe, stores | 0.8% (2,007) | 0.5% (677) | 1.1% (1,330) |
| Electronic shopping and mail-order houses | 0.7% (1,816) | 0.7% (1,042) | 0.7% (774) |
| Building material and garden equipment and supplies dealers | 0.7% (1,688) | 0.8% (1,139) | 0.5% (549) |
| Miscellaneous nondurable goods merchant wholesalers | 0.7% (1,686) | 0.7% (1,034) | 0.6% (652) |
| Groceries and related products merchant wholesalers | 0.6% (1,647) | 0.8% (1,147) | 0.4% (500) |
| Used merchandise, gift, novelty, and souvenir, and other miscellaneous stores | 0.6% (1,530) | 0.4% (598) | 0.8% (932) |
| Professional and commercial equipment and supplies merchant wholesalers | 0.6% (1,477) | 0.7% (1,031) | 0.4% (446) |
| Other direct selling establishments | 0.6% (1,476) | 0.5% (734) | 0.6% (742) |
| Machinery | 0.6% (1,470) | 0.9% (1,236) | 0.2% (234) |
| Furniture and home furnishings, and household appliance stores | 0.6% (1,462) | 0.6% (798) | 0.6% (664) |
| Metal and metal products | 0.6% (1,448) | 0.8% (1,195) | 0.2% (253) |
| Pharmacies and drug stores | 0.5% (1,407) | 0.4% (556) | 0.7% (851) |
| Private households | 0.5% (1,405) | 0.1% (115) | 1.1% (1,290) |
| U. S. Postal service | 0.5% (1,292) | 0.7% (965) | 0.3% (327) |
| Food | 0.5% (1,264) | 0.6% (845) | 0.4% (419) |
| Printing and related support activities | 0.5% (1,248) | 0.5% (776) | 0.4% (472) |
| Truck transportation | 0.5% (1,186) | 0.6% (893) | 0.3% (293) |
| Utilities | 0.5% (1,176) | 0.5% (671) | 0.4% (505) |
| Electrical and electronic goods merchant wholesalers | 0.4% (1,074) | 0.5% (724) | 0.3% (350) |
| Machinery, equipment, and supplies merchant wholesalers | 0.4% (1,070) | 0.5% (726) | 0.3% (344) |
| Sporting goods, camera, and hobby and toy stores | 0.4% (988) | 0.4% (584) | 0.3% (404) |
| Miscellaneous durable goods merchant wholesalers | 0.3% (726) | 0.4% (499) | 0.2% (227) |
| Agriculture, forestry, fishing and hunting | 0.3% (705) | 0.3% (481) | 0.2% (224) |
| Chemicals | 0.2% (548) | 0.2% (318) | 0.2% (230) |
| Lumber and other construction materials merchant wholesalers | 0.2% (544) | 0.3% (419) | 0.1% (125) |
| Drugs, sundries, and chemical and allied products merchant wholesalers | 0.2% (535) | 0.2% (230) | 0.3% (305) |
| Electrical equipment, appliances, and components | 0.2% (534) | 0.3% (374) | 0.1% (160) |
| Furniture and related product manufacturing | 0.2% (481) | 0.3% (417) | 0.1% (64) |
| Furniture and home furnishing merchant wholesalers | 0.2% (457) | 0.2% (257) | 0.2% (200) |
| Office supplies and stationery stores | 0.2% (447) | 0.2% (292) | 0.1% (155) |
| Health and personal care, except drug, stores | 0.2% (441) | 0.1% (88) | 0.3% (353) |
| Nonmetallic mineral products | 0.2% (424) | 0.2% (315) | 0.1% (109) |
| Gasoline stations | 0.2% (415) | 0.2% (261) | 0.1% (154) |
| Apparel, fabrics, and notions merchant wholesalers | 0.2% (410) | 0.1% (199) | 0.2% (211) |
| Alcoholic beverages merchant wholesalers | 0.1% (385) | 0.2% (355) | 0.0% (30) |
| Wood products | 0.1% (375) | 0.2% (282) | 0.1% (93) |
| Paper | 0.1% (373) | 0.2% (313) | 0.1% (60) |
| Motor vehicles, parts and supplies merchant wholesalers | 0.1% (371) | 0.2% (282) | 0.1% (89) |
| Plastics and rubber products | 0.1% (363) | 0.2% (261) | 0.1% (102) |
| Book stores and news dealers | 0.1% (348) | 0.1% (97) | 0.2% (251) |
| Beverage and tobacco products | 0.1% (348) | 0.2% (256) | 0.1% (92) |
| Apparel | 0.1% (345) | 0.1% (89) | 0.2% (256) |
| Hardware, plumbing and heating equipment, and supplies merchant wholesalers | 0.1% (311) | 0.2% (234) | 0.1% (77) |
| Music stores | 0.1% (283) | 0.1% (194) | 0.1% (89) |
| Management of companies and enterprises | 0.1% (275) | 0.1% (100) | 0.1% (175) |
| Petroleum and petroleum products merchant wholesalers | 0.1% (219) | 0.1% (197) | 0.0% (22) |
| Water transportation | 0.1% (216) | 0.1% (209) | 0.0% (7) |
| Rail transportation | 0.1% (183) | 0.1% (163) | 0.0% (20) |
Unemployment in East Seattle
- Unemployment by race in 2000
- Unemployment rate for White non-Hispanic residents
- 3.3%Males
- 3.2%Females
- Unemployment rate for Black residents
- 9.5%Males
- 5.8%Females
- Unemployment rate for American Indian and Alaska Native residents
- 6.2%Males
- 10.2%Females
- Unemployment rate for Asian residents
- 2.9%Males
- 3.9%Females
- Unemployment rate for other race residents
- 4.4%Males
- 6.4%Females
- Unemployment rate for two or more race residents
- 5.8%Males
- 3.0%Females
- Unemployment rate for Hispanic or Latino residents
- 4.3%Males
- 5.4%Females
Time leaving home to go to work

<5am:
| East Seattle: | 2.6% (6,491) |
| Washington: | 4.2% (115,997) |
5:30am:
| East Seattle: | 2.4% (6,186) |
| Washington: | 3.7% (102,868) |
6am:
| East Seattle: | 4.2% (10,652) |
| Washington: | 5.3% (147,812) |
6:30am:
| East Seattle: | 7.8% (19,887) |
| Washington: | 8.9% (248,462) |
7am:
| East Seattle: | 10.4% (26,322) |
| Washington: | 10.3% (288,005) |
7:30am:
| East Seattle: | 14.9% (37,893) |
| Washington: | 13.5% (375,030) |
8am:
| East Seattle: | 13.8% (35,045) |
| Washington: | 13.4% (372,576) |
8:30am:
| East Seattle: | 11.3% (28,735) |
| Washington: | 9.0% (252,058) |
9am:
| East Seattle: | 6.9% (17,635) |
| Washington: | 5.1% (141,936) |
10am:
| East Seattle: | 7.7% (19,617) |
| Washington: | 5.8% (161,204) |
11am:
| East Seattle: | 2.7% (6,813) |
| Washington: | 2.5% (70,123) |
12pm:
| East Seattle: | 1.2% (3,122) |
| Washington: | 1.3% (35,612) |
4pm:
| East Seattle: | 5.1% (13,053) |
| Washington: | 6.8% (190,565) |
>4pm:
| East Seattle: | 4.0% (10,131) |
| Washington: | 5.8% (162,401) |
Travel time to work


Less than 5 minutes:
| East Seattle: | 1.9% (4,871) |
| Washington: | 3.3% (91,132) |
5 to 9 minutes:
| East Seattle: | 7.6% (19,433) |
| Washington: | 10.3% (286,517) |
10 to 14 minutes:
| East Seattle: | 12.4% (31,579) |
| Washington: | 14.1% (391,606) |
15 to 19 minutes:
| East Seattle: | 15.2% (38,514) |
| Washington: | 15.0% (418,990) |
20 to 24 minutes:
| East Seattle: | 16.3% (41,294) |
| Washington: | 14.2% (394,209) |
25 to 29 minutes:
| East Seattle: | 7.4% (18,782) |
| Washington: | 5.8% (162,590) |
30 to 34 minutes:
| East Seattle: | 15.6% (39,752) |
| Washington: | 12.5% (348,311) |
35 to 39 minutes:
| East Seattle: | 3.3% (8,431) |
| Washington: | 2.6% (73,592) |
40 to 44 minutes:
| East Seattle: | 4.2% (10,599) |
| Washington: | 3.4% (95,182) |
45 to 59 minutes:
| East Seattle: | 6.7% (17,099) |
| Washington: | 7.0% (195,343) |
60 to 89 minutes:
| East Seattle: | 3.1% (7,845) |
| Washington: | 4.7% (131,691) |
90 or more minutes:
| East Seattle: | 1.3% (3,383) |
| Washington: | 2.7% (75,486) |
Means of transportation to work


Drove car alone:
| East Seattle: | 76.3% (193,806) |
| Washington: | 73.3% (2,040,833) |
Carpooled:
| East Seattle: | 11.0% (27,983) |
| Washington: | 12.8% (357,742) |
Bus or trolley bus:
| East Seattle: | 5.0% (12,586) |
| Washington: | 4.5% (124,450) |
Streetcar or trolley car:
| East Seattle: | 0.0% (69) |
| Washington: | 0.0% (589) |
Subway or elevated:
| East Seattle: | 0.0% (38) |
| Washington: | 0.0% (598) |
Railroad:
| East Seattle: | 0.0% (99) |
| Washington: | 0.0% (301) |
Ferryboat:
| East Seattle: | 0.0% (2) |
| Washington: | 0.3% (8,923) |
Taxicab:
| East Seattle: | 0.0% (115) |
| Washington: | 0.1% (1,417) |
Motorcycle:
| East Seattle: | 0.1% (298) |
| Washington: | 0.2% (4,353) |
Bicycle:
| East Seattle: | 0.3% (877) |
| Washington: | 0.6% (16,205) |
Walked:
| East Seattle: | 1.7% (4,352) |
| Washington: | 3.2% (89,739) |
Other means:
| East Seattle: | 0.5% (1,357) |
| Washington: | 0.7% (19,499) |
Private vehicle occupancy

Drove alone:
| East Seattle: | 87.4% (193,806) |
| Washington: | 85.1% (2,040,833) |
In 2 person carpool:
| East Seattle: | 10.4% (22,996) |
| Washington: | 11.8% (282,638) |
In 3 person carpool:
| East Seattle: | 1.4% (3,187) |
| Washington: | 1.9% (44,791) |
In 4 person carpool:
| East Seattle: | 0.4% (793) |
| Washington: | 0.6% (14,195) |
In 5-6 person carpool:
| East Seattle: | 0.2% (484) |
| Washington: | 0.3% (7,914) |
In 7+ person carpool:
| East Seattle: | 0.2% (523) |
| Washington: | 0.3% (8,204) |
Class of workers
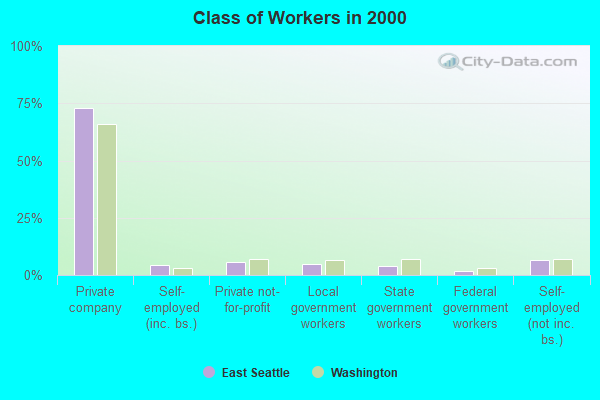
Employee of private company:
| East Seattle: | 73.1% (189,538) |
| Washington: | 66.0% (1,843,000) |
Self-employed in own incorporated business:
| East Seattle: | 4.2% (10,928) |
| Washington: | 3.2% (90,102) |
Private not-for-profit wage and salary workers:
| East Seattle: | 5.7% (14,721) |
| Washington: | 6.9% (191,927) |
Local government workers:
| East Seattle: | 4.7% (12,191) |
| Washington: | 6.4% (178,161) |
State government workers:
| East Seattle: | 4.0% (10,270) |
| Washington: | 6.9% (192,408) |
Federal government workers:
| East Seattle: | 1.6% (4,019) |
| Washington: | 3.2% (89,153) |
Self-employed workers in own not incorporated business:
| East Seattle: | 6.5% (16,907) |
| Washington: | 7.2% (199,827) |
Unpaid family workers:
| East Seattle: | 0.2% (584) |
| Washington: | 0.3% (9,144) |

Employee of private company - Males:
| East Seattle: | 76.9% (109,419) |
| Washington: | 69.7% (1,044,674) |
Self-employed in own incorporated business - Males:
| East Seattle: | 5.6% (7,915) |
| Washington: | 4.3% (64,169) |
Private not-for-profit wage and salary workers - Males:
| East Seattle: | 3.3% (4,628) |
| Washington: | 4.2% (63,257) |
Local government workers - Males:
| East Seattle: | 3.5% (4,992) |
| Washington: | 5.3% (79,844) |
State government workers - Males:
| East Seattle: | 2.5% (3,549) |
| Washington: | 5.1% (76,834) |
Federal government workers - Males:
| East Seattle: | 1.7% (2,408) |
| Washington: | 3.5% (52,763) |
Self-employed workers in own not incorporated business - Males:
| East Seattle: | 6.4% (9,046) |
| Washington: | 7.6% (114,199) |
Unpaid family workers - Males:
| East Seattle: | 0.2% (253) |
| Washington: | 0.3% (3,889) |

Employee of private company - Females:
| East Seattle: | 68.5% (80,119) |
| Washington: | 61.7% (798,326) |
Self-employed in own incorporated business - Females:
| East Seattle: | 2.6% (3,013) |
| Washington: | 2.0% (25,933) |
Private not-for-profit wage and salary workers - Females:
| East Seattle: | 8.6% (10,093) |
| Washington: | 9.9% (128,670) |
Local government workers - Females:
| East Seattle: | 6.2% (7,199) |
| Washington: | 7.6% (98,317) |
State government workers - Females:
| East Seattle: | 5.7% (6,721) |
| Washington: | 8.9% (115,574) |
Federal government workers - Females:
| East Seattle: | 1.4% (1,611) |
| Washington: | 2.8% (36,390) |
Self-employed workers in own not incorporated business - Females:
| East Seattle: | 6.7% (7,861) |
| Washington: | 6.6% (85,628) |
Unpaid family workers - Females:
| East Seattle: | 0.3% (331) |
| Washington: | 0.4% (5,255) |