Work and Jobs in Glenview Hills, Kentucky (KY) Detailed Stats
Data:
Unemployment (%)
Unemployment (% change since 2000)
Unemployment (%) - White
Unemployment (% change since 2000) - White
Unemployment (%) - Black or African American
Unemployment (% change since 2000) - Black or African American
Unemployment (%) - Asian
Unemployment (% change since 2000) - Asian
Unemployment (%) - Hispanic or Latino
Unemployment (% change since 2000) - Hispanic or Latino
Unemployment (%) - American Indian and Alaska Native
Unemployment (% change since 2000) - American Indian and Alaska Native
Unemployment (%) - Multirace
Unemployment (% change since 2000) - Multirace
Unemployment (%) - Other Race
Unemployment (% change since 2000) - Other Race
Industry diversity
Most Common Industries - Agriculture, forestry, fishing and hunting, and mining (%)
Most Common Industries - Agriculture, forestry, fishing and hunting (%)
Most Common Industries - Mining, quarrying, and oil and gas extraction (%)
Most Common Industries - Construction (%)
Most Common Industries - Manufacturing (%)
Most Common Industries - Wholesale trade (%)
Most Common Industries - Retail trade (%)
Most Common Industries - Transportation and warehousing, and utilities (%)
Most Common Industries - Transportation and warehousing (%)
Most Common Industries - Utilities (%)
Most Common Industries - Information (%)
Most Common Industries - Finance and insurance, and real estate and rental and leasing (%)
Most Common Industries - Finance and insurance (%)
Most Common Industries - Real estate and rental and leasing (%)
Most Common Industries - Professional, scientific, and management, and administrative and waste management services (%)
Most Common Industries - Professional, scientific, and technical services (%)
Most Common Industries - Management of companies and enterprises (%)
Most Common Industries - Administrative and support and waste management services (%)
Most Common Industries - Educational services, and health care and social assistance (%)
Most Common Industries - Educational services (%)
Most Common Industries - Health care and social assistance (%)
Most Common Industries - Arts, entertainment, and recreation, and accommodation and food services (%)
Most Common Industries - Arts, entertainment, and recreation (%)
Most Common Industries - Accommodation and food services (%)
Most Common Industries - Other services, except public administration (%)
Most Common Industries - Public administration (%)
Occupation diversity
Most Common Occupations - Management, business, science, and arts occupations (%)
Most Common Occupations - Management, business, and financial occupations (%)
Most Common Occupations - Management occupations (%)
Most Common Occupations - Business and financial operations occupations (%)
Most Common Occupations - Computer, engineering, and science occupations (%)
Most Common Occupations - Computer and mathematical occupations (%)
Most Common Occupations - Architecture and engineering occupations (%)
Most Common Occupations - Life, physical, and social science occupations (%)
Most Common Occupations - Education, legal, community service, arts, and media occupations (%)
Most Common Occupations - Community and social service occupations (%)
Most Common Occupations - Legal occupations (%)
Most Common Occupations - Education, training, and library occupations (%)
Most Common Occupations - Arts, design, entertainment, sports, and media occupations (%)
Most Common Occupations - Healthcare practitioners and technical occupations (%)
Most Common Occupations - Health diagnosing and treating practitioners and other technical occupations (%)
Most Common Occupations - Health technologists and technicians (%)
Most Common Occupations - Service occupations (%)
Most Common Occupations - Healthcare support occupations (%)
Most Common Occupations - Protective service occupations (%)
Most Common Occupations - Fire fighting and prevention, and other protective service workers including supervisors (%)
Most Common Occupations - Law enforcement workers including supervisors (%)
Most Common Occupations - Food preparation and serving related occupations (%)
Most Common Occupations - Building and grounds cleaning and maintenance occupations (%)
Most Common Occupations - Personal care and service occupations (%)
Most Common Occupations - Sales and office occupations (%)
Most Common Occupations - Sales and related occupations (%)
Most Common Occupations - Office and administrative support occupations (%)
Most Common Occupations - Natural resources, construction, and maintenance occupations (%)
Most Common Occupations - Farming, fishing, and forestry occupations (%)
Most Common Occupations - Construction and extraction occupations (%)
Most Common Occupations - Installation, maintenance, and repair occupations (%)
Most Common Occupations - Production, transportation, and material moving occupations (%)
Most Common Occupations - Production occupations (%)
Most Common Occupations - Transportation occupations (%)
Most Common Occupations - Material moving occupations (%)
Private vehicle occupancy - Drove alone (% change since 2000)
Private vehicle occupancy - Carpooled (%)
Private vehicle occupancy - Carpooled (% change since 2000)
Private vehicle occupancy - In 2-person carpool (%)
Private vehicle occupancy - In 2-person carpool (% change since 2000)
Private vehicle occupancy - In 3-person carpool (%)
Private vehicle occupancy - In 3-person carpool (% change since 2000)
Private vehicle occupancy - In 4-person carpool (%)
Private vehicle occupancy - In 4-person carpool (% change since 2000)
Private vehicle occupancy - In 5- or 6-person carpool (%)
Private vehicle occupancy - In 5- or 6-person carpool (% change since 2000)
Private vehicle occupancy - In 7-or-more-person carpool (%)
Private vehicle occupancy - In 7-or-more-person carpool (% change since 2000)
Time Leaving Home To Go To Work - 12:00 a.m. to 4:59 a.m. (%)
Time Leaving Home To Go To Work - 12:00 a.m. to 4:59 a.m. (% change since 2000)
Time Leaving Home To Go To Work - 5:00 a.m. to 5:59 a.m. (%)
Time Leaving Home To Go To Work - 5:00 a.m. to 5:59 a.m. (% change since 2000)
Time Leaving Home To Go To Work - 6:00 a.m. to 6:59 a.m. (%)
Time Leaving Home To Go To Work - 6:00 a.m. to 6:59 a.m. (% change since 2000)
Time Leaving Home To Go To Work - 7:00 a.m. to 7:59 a.m. (%)
Time Leaving Home To Go To Work - 7:00 a.m. to 7:59 a.m. (% change since 2000)
Time Leaving Home To Go To Work - 8:00 a.m. to 8:59 a.m. (%)
Time Leaving Home To Go To Work - 8:00 a.m. to 8:59 a.m. (% change since 2000)
Time Leaving Home To Go To Work - 9:00 a.m. to 9:59 a.m. (%)
Time Leaving Home To Go To Work - 9:00 a.m. to 9:59 a.m. (% change since 2000)
Time Leaving Home To Go To Work - 10:00 a.m. to 10:59 a.m. (%)
Time Leaving Home To Go To Work - 10:00 a.m. to 10:59 a.m. (% change since 2000)
Time Leaving Home To Go To Work - 11:00 a.m. to 11:59 a.m. (%)
Time Leaving Home To Go To Work - 11:00 a.m. to 11:59 a.m. (% change since 2000)
Time Leaving Home To Go To Work - 12:00 p.m. to 3:59 p.m. (%)
Time Leaving Home To Go To Work - 12:00 p.m. to 3:59 p.m. (% change since 2000)
Time Leaving Home To Go To Work - 4:00 p.m. to 11:59 p.m. (%)
Time Leaving Home To Go To Work - 4:00 p.m. to 11:59 p.m. (% change since 2000)
Class of Workers - Employee of private company (%)
Class of Workers - Employee of private company (% change since 2000)
Class of Workers - Self-employed in own incorporated business (%)
Class of Workers - Self-employed in own incorporated business (% change since 2000)
Class of Workers - Private not-for-profit wage and salary workers (%)
Class of Workers - Private not-for-profit wage and salary workers (% change since 2000)
Class of Workers - Local government workers (%)
Class of Workers - Local government workers (% change since 2000)
Class of Workers - State government workers (%)
Class of Workers - State government workers (% change since 2000)
Class of Workers - Federal government workers (%)
Class of Workers - Federal government workers (% change since 2000)
Class of Workers - Self-employed workers in own not incorporated business and Unpaid family workers (%)
Class of Workers - Self-employed workers in own not incorporated business and Unpaid family workers (% change since 2000)
Means of transportation to work - Drove car alone (%)
Means of transportation to work - Drove car alone (% change since 2000)
Means of transportation to work - Carpooled (%)
Means of transportation to work - Carpooled (% change since 2000)
Means of transportation to work - Public transportation (%)
Means of transportation to work - Public transportation (% change since 2000)
Means of transportation to work - Bus or trolley bus (%)
Means of transportation to work - Bus or trolley bus (% change since 2000)
Means of transportation to work - Streetcar or trolley car (%)
Means of transportation to work - Streetcar or trolley car (% change since 2000)
Means of transportation to work - Subway or elevated (%)
Means of transportation to work - Subway or elevated (% change since 2000)
Means of transportation to work - Railroad (%)
Means of transportation to work - Railroad (% change since 2000)
Means of transportation to work - Ferryboat (%)
Means of transportation to work - Ferryboat (% change since 2000)
Means of transportation to work - Taxicab (%)
Means of transportation to work - Taxicab (% change since 2000)
Means of transportation to work - Motorcycle (%)
Means of transportation to work - Motorcycle (% change since 2000)
Means of transportation to work - Bicycle (%)
Means of transportation to work - Bicycle (% change since 2000)
Means of transportation to work - Walked (%)
Means of transportation to work - Walked (% change since 2000)
Means of transportation to work - Other means (%)
Means of transportation to work - Other means (% change since 2000)
Working at home (%)
Working at home (% change since 2000)
Travel time to work - Less than 5 minutes (%)
Travel time to work - Less than 5 minutes (% change since 2000)
Travel time to work - 5 to 9 minutes (%)
Travel time to work - 5 to 9 minutes (% change since 2000)
Travel time to work - 10 to 19 minutes (%)
Travel time to work - 10 to 19 minutes (% change since 2000)
Travel time to work - 20 to 29 minutes (%)
Travel time to work - 20 to 29 minutes (% change since 2000)
Travel time to work - 30 to 39 minutes (%)
Travel time to work - 30 to 39 minutes (% change since 2000)
Travel time to work - 40 to 59 minutes (%)
Travel time to work - 40 to 59 minutes (% change since 2000)
Travel time to work - 60 to 89 minutes (%)
Travel time to work - 60 to 89 minutes (% change since 2000)
Travel time to work - 90 or more minutes (%)
Travel time to work - 90 or more minutes (% change since 2000)
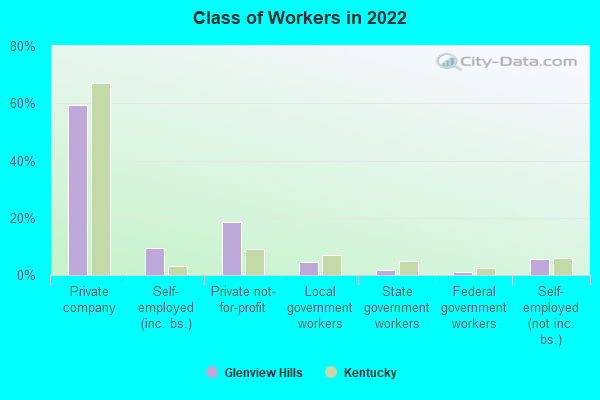
The most common industries in Glenview Hills are: Professional, scientific, technical services (20.9% of civilian employees), Health care (14.9% of civilian employees), Finance & insurance (11.5% of civilian employees). 89.0% of workers work in Jefferson County and 13.7% of all workers work at home. 59.3% of workers are employees of private companies, which is 13.3% less than the rate of 67.2% across the entire state of Kentucky.
Whole page based on the data from 2000 / 2022 when the population of Glenview Hills, Kentucky was 337 / 342
Most common industries
Most common industries Industry All Males Females
Professional, scientific, and technical services 20.9% 29.1% 9.7% Health care 14.9% 12.8% 17.7% Finance and insurance 11.5% 11.6% 11.3% Educational services 10.8% 5.8% 17.7% Administrative and support and waste management services 5.4% 2.3% 9.7% Construction 3.4% 5.8% 0.0% Building material and garden equipment and supplies dealers 3.4% 0.0% 8.1% Miscellaneous nondurable goods merchant wholesalers 3.4% 3.5% 3.2% Furniture and related product manufacturing 3.4% 3.5% 3.2% Public administration 3.4% 5.8% 0.0% Radio, TV, and computer stores 1.4% 2.3% 0.0% Metal and metal products 1.4% 2.3% 0.0% Lumber and other construction materials merchant wholesalers 1.4% 2.3% 0.0% Professional and commercial equipment and supplies merchant wholesalers 1.4% 2.3% 0.0% Petroleum and petroleum products merchant wholesalers 1.4% 2.3% 0.0% Paper 1.4% 2.3% 0.0% Miscellaneous manufacturing 1.4% 2.3% 0.0% Clothing and accessories, including shoe, stores 1.4% 0.0% 3.2% Used merchandise, gift, novelty, and souvenir, and other miscellaneous stores 1.4% 0.0% 3.2% Broadcasting and telecommunications 1.4% 0.0% 3.2% Real estate and rental and leasing 1.4% 2.3% 0.0% Social assistance 1.4% 0.0% 3.2% Religious, grantmaking, civic, professional, and similar organizations 1.4% 0.0% 3.2% Private households 1.4% 0.0% 3.2% Chemicals 0.7% 1.2% 0.0%
Unemployment in Glenview Hills Unemployment by race in 2000
Unemployment rate for White non-Hispanic residents 4.8% Males10.6% Females
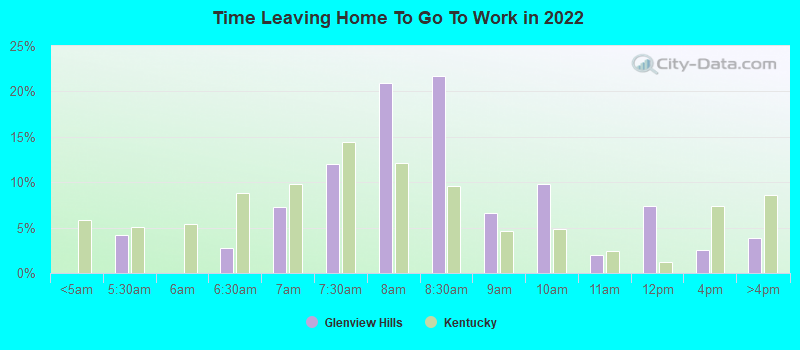
Time leaving home to go to work 5:00 a.m. to 5:29 a.m.: Glenview Hills:
4.2% (6)Kentucky:
5.0% (91,562)
6:00 a.m. to 6:29 a.m.: Glenview Hills:
2.8% (4)Kentucky:
8.8% (160,781)
6:30 a.m. to 6:59 a.m.: Glenview Hills:
7.3% (11)Kentucky:
9.8% (177,898)
7:00 a.m. to 7:29 a.m.: Glenview Hills:
12.0% (18)Kentucky:
14.4% (262,079)
7:30 a.m. to 7:59 a.m.: Glenview Hills:
20.9% (32)Kentucky:
12.2% (221,546)
8:00 a.m. to 8:29 a.m.: Glenview Hills:
21.7% (33)Kentucky:
9.6% (174,071)
8:30 a.m. to 8:59 a.m.: Glenview Hills:
6.6% (10)Kentucky:
4.6% (84,129)
9:00 a.m. to 9:59 a.m.: Glenview Hills:
9.8% (15)Kentucky:
4.9% (88,917)
10:00 a.m. to 10:59 a.m.: Glenview Hills:
1.9% (3)Kentucky:
2.4% (44,296)
11:00 a.m. to 11:59 a.m.: Glenview Hills:
7.3% (11)Kentucky:
1.2% (22,026)
12:00 p.m. to 3:59 p.m.: Glenview Hills:
2.5% (4)Kentucky:
7.4% (134,033)
4:00 p.m. to 11:59 p.m.: Glenview Hills:
3.8% (6)Kentucky:
8.6% (156,276)
6:30am: Glenview Hills:
1.4% (2)Kentucky:
8.8% (156,072)
7am: Glenview Hills:
5.4% (8)Kentucky:
10.8% (191,924)
7:30am: Glenview Hills:
6.8% (10)Kentucky:
14.4% (256,256)
8am: Glenview Hills:
16.2% (24)Kentucky:
15.6% (277,275)
8:30am: Glenview Hills:
21.6% (32)Kentucky:
8.8% (156,855)
9am: Glenview Hills:
8.1% (12)Kentucky:
4.2% (75,532)
10am: Glenview Hills:
17.6% (26)Kentucky:
4.4% (77,954)
11am: Glenview Hills:
3.4% (5)Kentucky:
1.9% (33,406)
12pm: Glenview Hills:
1.4% (2)Kentucky:
1.0% (17,303)
4pm: Glenview Hills:
7.4% (11)Kentucky:
7.6% (135,045)
>4pm: Glenview Hills:
1.4% (2)Kentucky:
8.4% (150,096)
6:00 a.m. to 6:29 a.m. - Males: Glenview Hills:
3.0% (2)Kentucky:
10.3% (101,417)
6:30 a.m. to 6:59 a.m. - Males: Glenview Hills:
11.9% (9)Kentucky:
9.5% (93,068)
7:00 a.m. to 7:29 a.m. - Males: Glenview Hills:
15.0% (12)Kentucky:
13.3% (130,226)
7:30 a.m. to 7:59 a.m. - Males: Glenview Hills:
18.5% (15)Kentucky:
9.8% (95,903)
8:00 a.m. to 8:29 a.m. - Males: Glenview Hills:
19.6% (16)Kentucky:
8.9% (86,957)
8:30 a.m. to 8:59 a.m. - Males: Glenview Hills:
8.1% (6)Kentucky:
3.9% (38,346)
9:00 a.m. to 9:59 a.m. - Males: Glenview Hills:
8.0% (6)Kentucky:
4.0% (39,548)
11:00 a.m. to 11:59 a.m. - Males: Glenview Hills:
8.1% (6)Kentucky:
1.0% (9,985)
4:00 p.m. to 11:59 p.m. - Males: Glenview Hills:
3.8% (3)Kentucky:
9.1% (89,441)
5:00 a.m. to 5:29 a.m. - Females: Glenview Hills:
10.1% (7)Kentucky:
3.3% (27,656)
6:00 a.m. to 6:29 a.m. - Females: Glenview Hills:
2.5% (2)Kentucky:
7.1% (59,364)
6:30 a.m. to 6:59 a.m. - Females: Glenview Hills:
1.5% (1)Kentucky:
10.1% (84,830)
7:00 a.m. to 7:29 a.m. - Females: Glenview Hills:
8.2% (6)Kentucky:
15.7% (131,853)
7:30 a.m. to 7:59 a.m. - Females: Glenview Hills:
23.3% (17)Kentucky:
14.9% (125,643)
8:00 a.m. to 8:29 a.m. - Females: Glenview Hills:
23.7% (17)Kentucky:
10.3% (87,114)
8:30 a.m. to 8:59 a.m. - Females: Glenview Hills:
5.5% (4)Kentucky:
5.4% (45,783)
9:00 a.m. to 9:59 a.m. - Females: Glenview Hills:
11.7% (8)Kentucky:
5.9% (49,369)
10:00 a.m. to 10:59 a.m. - Females: Glenview Hills:
4.1% (3)Kentucky:
2.9% (24,349)
11:00 a.m. to 11:59 a.m. - Females: Glenview Hills:
6.3% (5)Kentucky:
1.4% (12,041)
12:00 p.m. to 3:59 p.m. - Females: Glenview Hills:
5.6% (4)Kentucky:
7.2% (60,893)
4:00 p.m. to 11:59 p.m. - Females: Glenview Hills:
3.7% (3)Kentucky:
7.9% (66,835)
Travel time to work Percentage of workers working in this county: 89.0%Number of people working at home: 25 (13.7% of all workers )
5 to 9 minutes: Glenview Hills:
3.4% (5)Kentucky:
11.8% (210,440)
10 to 14 minutes: Glenview Hills:
16.2% (24)Kentucky:
16.3% (290,128)
15 to 19 minutes: Glenview Hills:
26.4% (39)Kentucky:
16.9% (301,009)
20 to 24 minutes: Glenview Hills:
31.1% (46)Kentucky:
14.7% (262,418)
25 to 29 minutes: Glenview Hills:
8.8% (13)Kentucky:
5.7% (101,130)
30 to 34 minutes: Glenview Hills:
4.7% (7)Kentucky:
11.7% (208,362)
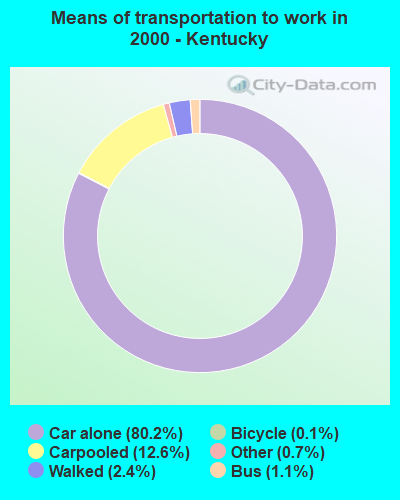
Means of transportation to work Drove car alone: Glenview Hills:
83.8% (124)Kentucky:
80.2% (1,429,053)
Carpooled: Glenview Hills:
4.7% (7)Kentucky:
12.6% (224,643)
Subway or elevated: Glenview Hills:
2.0% (3)Kentucky:
0.0% (154)
Private vehicle occupancy Drove alone: Glenview Hills:
91.4% (137)Kentucky:
88.5% (1,545,744)
In 2 person carpool: Glenview Hills:
8.6% (13)Kentucky:
9.0% (157,727)
Drove alone: Glenview Hills:
94.7% (124)Kentucky:
86.4% (1,429,053)
In 2 person carpool: Glenview Hills:
2.3% (3)Kentucky:
10.8% (178,387)
In 3 person carpool: Glenview Hills:
3.1% (4)Kentucky:
1.8% (30,156)
Class of workers
Employee of private company: Glenview Hills:
59.3% (109)Kentucky:
67.2% (1,385,496)
Self-employed in own incorporated business: Glenview Hills:
9.3% (17)Kentucky:
3.1% (63,067)
Private not-for-profit wage and salary workers: Glenview Hills:
18.7% (34)Kentucky:
8.9% (184,048)
Local government workers: Glenview Hills:
4.4% (8)Kentucky:
7.1% (147,000)
State government workers: Glenview Hills:
1.6% (3)Kentucky:
4.9% (100,503)
Federal government workers: Glenview Hills:
1.1% (2)Kentucky:
2.6% (53,473)
Self-employed workers in own not incorporated business: Glenview Hills:
5.5% (10)Kentucky:
6.0% (123,667)
Employee of private company: Glenview Hills:
54.1% (80)Kentucky:
68.7% (1,235,989)
Self-employed in own incorporated business: Glenview Hills:
8.8% (13)Kentucky:
3.0% (53,084)
Private not-for-profit wage and salary workers: Glenview Hills:
7.4% (11)Kentucky:
6.8% (121,764)
Local government workers: Glenview Hills:
1.4% (2)Kentucky:
5.6% (100,920)
State government workers: Glenview Hills:
7.4% (11)Kentucky:
6.4% (114,791)
Federal government workers: Glenview Hills:
3.4% (5)Kentucky:
2.5% (44,072)
Self-employed workers in own not incorporated business: Glenview Hills:
16.2% (24)Kentucky:
6.7% (120,288)
Unpaid family workers: Glenview Hills:
1.4% (2)Kentucky:
0.4% (7,356)
Employee of private company - Males: Glenview Hills:
63.1% (66)Kentucky:
71.5% (773,461)
Self-employed in own incorporated business - Males: Glenview Hills:
9.7% (10)Kentucky:
3.7% (40,392)
Private not-for-profit wage and salary workers - Males: Glenview Hills:
13.6% (14)Kentucky:
5.7% (61,487)
Local government workers - Males: Glenview Hills:
1.9% (2)Kentucky:
5.5% (59,107)
State government workers - Males: Glenview Hills:
2.9% (3)Kentucky:
3.6% (38,667)
Federal government workers - Males: Glenview Hills:
1.9% (2)Kentucky:
2.8% (30,519)
Self-employed workers in own not incorporated business - Males: Glenview Hills:
6.8% (7)Kentucky:
7.1% (76,456)
Employee of private company - Females: Glenview Hills:
54.4% (43)Kentucky:
62.5% (612,035)
Self-employed in own incorporated business - Females: Glenview Hills:
8.9% (7)Kentucky:
2.3% (22,675)
Private not-for-profit wage and salary workers - Females: Glenview Hills:
25.3% (20)Kentucky:
12.5% (122,561)
Local government workers - Females: Glenview Hills:
7.6% (6)Kentucky:
9.0% (87,893)
Self-employed workers in own not incorporated business - Females: Glenview Hills:
3.8% (3)Kentucky:
4.8% (47,211)