Work and Jobs in Graham-Thrift, Washington (WA) Detailed Stats
Occupations, Industries, Unemployment, Workers, Commute
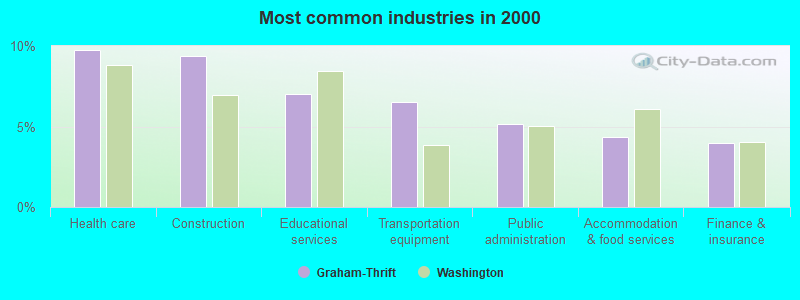
The most common industries in Graham-Thrift are: Health care (9.7% of civilian employees), Construction (9.4% of civilian employees), Educational services (7.0% of civilian employees). 70.0% of workers are employees of private companies, which is 5.8% greater than the rate of 66.0% across the entire state of Washington.
Most common industries
Most common industries | |||
|---|---|---|---|
Industry | All | Males | Females |
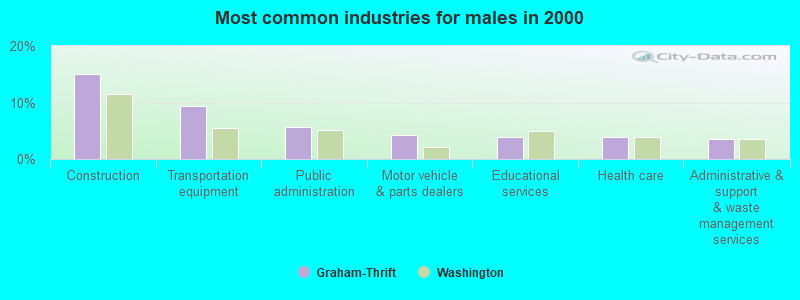
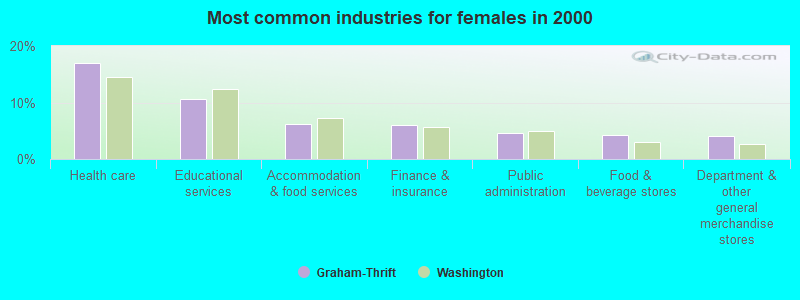
| Health care | 9.7% (2,602) | 3.8% (560) | 17.0% (2,042) |
| Construction | 9.4% (2,508) | 15.0% (2,202) | 2.5% (306) |
| Educational services | 7.0% (1,872) | 4.0% (584) | 10.7% (1,288) |
| Transportation equipment | 6.5% (1,736) | 9.3% (1,367) | 3.1% (369) |
| Public administration | 5.1% (1,374) | 5.6% (820) | 4.6% (554) |
| Accommodation and food services | 4.3% (1,161) | 2.9% (425) | 6.1% (736) |
| Finance and insurance | 4.0% (1,069) | 2.4% (350) | 6.0% (719) |
| Administrative and support and waste management services | 3.2% (868) | 3.5% (516) | 2.9% (352) |
| Food and beverage stores | 3.1% (820) | 2.2% (319) | 4.2% (501) |
| Motor vehicle and parts dealers | 2.9% (762) | 4.2% (618) | 1.2% (144) |
| Professional, scientific, and technical services | 2.5% (670) | 2.0% (294) | 3.1% (376) |
| Truck transportation | 2.4% (647) | 3.3% (489) | 1.3% (158) |
| Department and other general merchandise stores | 2.3% (613) | 0.8% (124) | 4.1% (489) |
| Other transportation, and support activities, and couriers | 2.0% (539) | 2.4% (346) | 1.6% (193) |
| Repair and maintenance | 1.8% (487) | 3.2% (465) | 0.2% (22) |
| Real estate and rental and leasing | 1.7% (467) | 1.7% (256) | 1.8% (211) |
| Metal and metal products | 1.5% (392) | 1.9% (285) | 0.9% (107) |
| Arts, entertainment, and recreation | 1.5% (390) | 1.2% (174) | 1.8% (216) |
| Social assistance | 1.4% (387) | 0.5% (69) | 2.6% (318) |
| Religious, grantmaking, civic, professional, and similar organizations | 1.3% (340) | 1.1% (165) | 1.5% (175) |
| Building material and garden equipment and supplies dealers | 1.2% (319) | 1.5% (215) | 0.9% (104) |
| Personal and laundry services | 1.2% (315) | 0.4% (60) | 2.1% (255) |
| Broadcasting and telecommunications | 1.1% (293) | 1.2% (180) | 0.9% (113) |
| Utilities | 1.0% (261) | 1.6% (234) | 0.2% (27) |
| Paper | 1.0% (257) | 1.4% (206) | 0.4% (51) |
| Agriculture, forestry, fishing and hunting | 0.9% (248) | 0.9% (137) | 0.9% (111) |
| Furniture and related product manufacturing | 0.9% (241) | 1.5% (225) | 0.1% (16) |
| Wood products | 0.9% (231) | 1.4% (201) | 0.2% (30) |
| Miscellaneous manufacturing | 0.8% (227) | 1.0% (153) | 0.6% (74) |
| U. S. Postal service | 0.8% (219) | 1.1% (159) | 0.5% (60) |
| Air transportation | 0.8% (217) | 0.6% (82) | 1.1% (135) |
| Used merchandise, gift, novelty, and souvenir, and other miscellaneous stores | 0.8% (216) | 0.6% (94) | 1.0% (122) |
| Machinery, equipment, and supplies merchant wholesalers | 0.8% (210) | 1.3% (192) | 0.1% (18) |
| Sporting goods, camera, and hobby and toy stores | 0.8% (204) | 0.2% (24) | 1.5% (180) |
| Furniture and home furnishings, and household appliance stores | 0.7% (196) | 0.6% (94) | 0.8% (102) |
| Publishing, and motion picture and sound recording industries | 0.7% (182) | 0.7% (96) | 0.7% (86) |
| Other direct selling establishments | 0.6% (173) | 0.2% (36) | 1.1% (137) |
| Groceries and related products merchant wholesalers | 0.6% (172) | 0.8% (115) | 0.5% (57) |
| Food | 0.5% (144) | 0.6% (94) | 0.4% (50) |
| Plastics and rubber products | 0.5% (143) | 0.5% (73) | 0.6% (70) |
| Lumber and other construction materials merchant wholesalers | 0.5% (138) | 0.7% (104) | 0.3% (34) |
| Machinery | 0.5% (135) | 0.8% (112) | 0.2% (23) |
| Electrical and electronic goods merchant wholesalers | 0.5% (128) | 0.5% (72) | 0.5% (56) |
| Printing and related support activities | 0.5% (125) | 0.6% (88) | 0.3% (37) |
| Motor vehicles, parts and supplies merchant wholesalers | 0.4% (114) | 0.8% (114) | 0.0% (0) |
| Private households | 0.4% (112) | 0.0% (0) | 0.9% (112) |
| Radio, TV, and computer stores | 0.4% (103) | 0.4% (54) | 0.4% (49) |
| Nonmetallic mineral products | 0.4% (100) | 0.5% (75) | 0.2% (25) |
| Clothing and accessories, including shoe, stores | 0.3% (92) | 0.1% (16) | 0.6% (76) |
| Computer and electronic products | 0.3% (91) | 0.5% (67) | 0.2% (24) |
| Data processing, libraries, and other information services | 0.3% (90) | 0.3% (40) | 0.4% (50) |
| Recyclable material merchant wholesalers | 0.3% (87) | 0.6% (87) | 0.0% (0) |
| Professional and commercial equipment and supplies merchant wholesalers | 0.3% (75) | 0.3% (44) | 0.3% (31) |
| Warehousing and storage | 0.3% (74) | 0.5% (74) | 0.0% (0) |
| Health and personal care, except drug, stores | 0.3% (73) | 0.1% (13) | 0.5% (60) |
| Hardware, plumbing and heating equipment, and supplies merchant wholesalers | 0.3% (68) | 0.2% (35) | 0.3% (33) |
| Apparel | 0.2% (66) | 0.1% (10) | 0.5% (56) |
| Petroleum and coal products | 0.2% (65) | 0.4% (65) | 0.0% (0) |
| Mining, quarrying, and oil and gas extraction | 0.2% (63) | 0.4% (63) | 0.0% (0) |
| Pharmacies and drug stores | 0.2% (61) | 0.2% (25) | 0.3% (36) |
| Alcoholic beverages merchant wholesalers | 0.2% (60) | 0.2% (31) | 0.2% (29) |
| Miscellaneous nondurable goods merchant wholesalers | 0.2% (56) | 0.1% (21) | 0.3% (35) |
| Rail transportation | 0.2% (55) | 0.4% (55) | 0.0% (0) |
| Paper and paper products merchant wholesalers | 0.2% (50) | 0.3% (50) | 0.0% (0) |
| Gasoline stations | 0.2% (49) | 0.2% (32) | 0.1% (17) |
| Jewelry, luggage, and leather goods stores | 0.2% (47) | 0.0% (6) | 0.3% (41) |
| Chemicals | 0.2% (41) | 0.3% (37) | 0.0% (4) |
| Office supplies and stationery stores | 0.1% (39) | 0.2% (28) | 0.1% (11) |
| Petroleum and petroleum products merchant wholesalers | 0.1% (38) | 0.3% (38) | 0.0% (0) |
| Furniture and home furnishing merchant wholesalers | 0.1% (35) | 0.1% (17) | 0.1% (18) |
| Water transportation | 0.1% (29) | 0.2% (29) | 0.0% (0) |
| Metals and minerals, except petroleum, merchant wholesalers | 0.1% (27) | 0.2% (27) | 0.0% (0) |
| Beverage and tobacco products | 0.1% (17) | 0.1% (17) | 0.0% (0) |
Unemployment in Graham-Thrift
- Unemployment by race in 2000
- Unemployment rate for White non-Hispanic residents
- 4.9%Males
- 6.4%Females
- Unemployment rate for Black residents
- 3.3%Females
- Unemployment rate for American Indian and Alaska Native residents
- 4.9%Males
- 10.5%Females
- Unemployment rate for Asian residents
- 2.4%Males
- 11.9%Females
- Unemployment rate for other race residents
- 10.1%Males
- Unemployment rate for two or more race residents
- 14.0%Males
- 9.8%Females
- Unemployment rate for Hispanic or Latino residents
- 8.2%Males
- 8.8%Females
Time leaving home to go to work

<5am:
| Graham-Thrift: | 8.0% (2,126) |
| Washington: | 4.2% (115,997) |
5:30am:
| Graham-Thrift: | 5.9% (1,582) |
| Washington: | 3.7% (102,868) |
6am:
| Graham-Thrift: | 6.4% (1,714) |
| Washington: | 5.3% (147,812) |
6:30am:
| Graham-Thrift: | 11.3% (3,015) |
| Washington: | 8.9% (248,462) |
7am:
| Graham-Thrift: | 10.2% (2,714) |
| Washington: | 10.3% (288,005) |
7:30am:
| Graham-Thrift: | 12.9% (3,434) |
| Washington: | 13.5% (375,030) |
8am:
| Graham-Thrift: | 9.9% (2,641) |
| Washington: | 13.4% (372,576) |
8:30am:
| Graham-Thrift: | 5.8% (1,536) |
| Washington: | 9.0% (252,058) |
9am:
| Graham-Thrift: | 3.3% (877) |
| Washington: | 5.1% (141,936) |
10am:
| Graham-Thrift: | 5.2% (1,376) |
| Washington: | 5.8% (161,204) |
11am:
| Graham-Thrift: | 2.3% (601) |
| Washington: | 2.5% (70,123) |
12pm:
| Graham-Thrift: | 1.0% (273) |
| Washington: | 1.3% (35,612) |
4pm:
| Graham-Thrift: | 7.7% (2,043) |
| Washington: | 6.8% (190,565) |
>4pm:
| Graham-Thrift: | 6.7% (1,773) |
| Washington: | 5.8% (162,401) |
Travel time to work


Less than 5 minutes:
| Graham-Thrift: | 0.9% (237) |
| Washington: | 3.3% (91,132) |
5 to 9 minutes:
| Graham-Thrift: | 2.9% (782) |
| Washington: | 10.3% (286,517) |
10 to 14 minutes:
| Graham-Thrift: | 7.2% (1,924) |
| Washington: | 14.1% (391,606) |
15 to 19 minutes:
| Graham-Thrift: | 8.8% (2,340) |
| Washington: | 15.0% (418,990) |
20 to 24 minutes:
| Graham-Thrift: | 10.2% (2,727) |
| Washington: | 14.2% (394,209) |
25 to 29 minutes:
| Graham-Thrift: | 5.5% (1,466) |
| Washington: | 5.8% (162,590) |
30 to 34 minutes:
| Graham-Thrift: | 17.6% (4,690) |
| Washington: | 12.5% (348,311) |
35 to 39 minutes:
| Graham-Thrift: | 5.4% (1,443) |
| Washington: | 2.6% (73,592) |
40 to 44 minutes:
| Graham-Thrift: | 6.7% (1,779) |
| Washington: | 3.4% (95,182) |
45 to 59 minutes:
| Graham-Thrift: | 16.2% (4,309) |
| Washington: | 7.0% (195,343) |
60 to 89 minutes:
| Graham-Thrift: | 9.9% (2,646) |
| Washington: | 4.7% (131,691) |
90 or more minutes:
| Graham-Thrift: | 5.1% (1,362) |
| Washington: | 2.7% (75,486) |
Means of transportation to work


Drove car alone:
| Graham-Thrift: | 80.6% (21,474) |
| Washington: | 73.3% (2,040,833) |
Carpooled:
| Graham-Thrift: | 13.5% (3,610) |
| Washington: | 12.8% (357,742) |
Bus or trolley bus:
| Graham-Thrift: | 0.7% (194) |
| Washington: | 4.5% (124,450) |
Motorcycle:
| Graham-Thrift: | 0.2% (41) |
| Washington: | 0.2% (4,353) |
Walked:
| Graham-Thrift: | 0.8% (205) |
| Washington: | 3.2% (89,739) |
Other means:
| Graham-Thrift: | 0.7% (181) |
| Washington: | 0.7% (19,499) |
Private vehicle occupancy

Drove alone:
| Graham-Thrift: | 85.6% (21,474) |
| Washington: | 85.1% (2,040,833) |
In 2 person carpool:
| Graham-Thrift: | 11.5% (2,875) |
| Washington: | 11.8% (282,638) |
In 3 person carpool:
| Graham-Thrift: | 1.3% (322) |
| Washington: | 1.9% (44,791) |
In 4 person carpool:
| Graham-Thrift: | 0.2% (61) |
| Washington: | 0.6% (14,195) |
In 5-6 person carpool:
| Graham-Thrift: | 0.4% (97) |
| Washington: | 0.3% (7,914) |
In 7+ person carpool:
| Graham-Thrift: | 1.0% (255) |
| Washington: | 0.3% (8,204) |
Class of workers
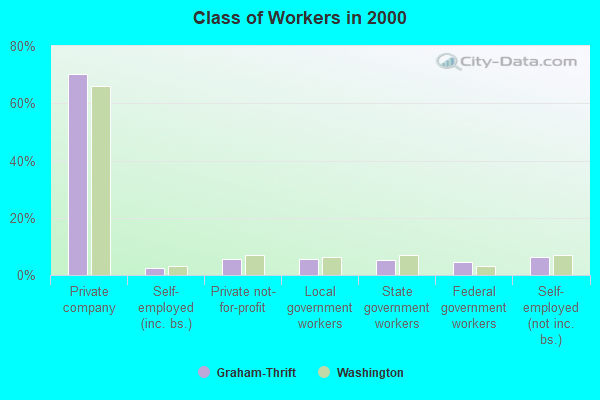
Employee of private company:
| Graham-Thrift: | 70.0% (18,725) |
| Washington: | 66.0% (1,843,000) |
Self-employed in own incorporated business:
| Graham-Thrift: | 2.4% (630) |
| Washington: | 3.2% (90,102) |
Private not-for-profit wage and salary workers:
| Graham-Thrift: | 5.5% (1,477) |
| Washington: | 6.9% (191,927) |
Local government workers:
| Graham-Thrift: | 5.6% (1,507) |
| Washington: | 6.4% (178,161) |
State government workers:
| Graham-Thrift: | 5.3% (1,411) |
| Washington: | 6.9% (192,408) |
Federal government workers:
| Graham-Thrift: | 4.6% (1,233) |
| Washington: | 3.2% (89,153) |
Self-employed workers in own not incorporated business:
| Graham-Thrift: | 6.2% (1,656) |
| Washington: | 7.2% (199,827) |
Unpaid family workers:
| Graham-Thrift: | 0.3% (92) |
| Washington: | 0.3% (9,144) |

Employee of private company - Males:
| Graham-Thrift: | 73.7% (10,831) |
| Washington: | 69.7% (1,044,674) |
Self-employed in own incorporated business - Males:
| Graham-Thrift: | 3.0% (436) |
| Washington: | 4.3% (64,169) |
Private not-for-profit wage and salary workers - Males:
| Graham-Thrift: | 3.2% (466) |
| Washington: | 4.2% (63,257) |
Local government workers - Males:
| Graham-Thrift: | 5.1% (742) |
| Washington: | 5.3% (79,844) |
State government workers - Males:
| Graham-Thrift: | 3.4% (502) |
| Washington: | 5.1% (76,834) |
Federal government workers - Males:
| Graham-Thrift: | 5.2% (768) |
| Washington: | 3.5% (52,763) |
Self-employed workers in own not incorporated business - Males:
| Graham-Thrift: | 6.2% (906) |
| Washington: | 7.6% (114,199) |
Unpaid family workers - Males:
| Graham-Thrift: | 0.3% (39) |
| Washington: | 0.3% (3,889) |

Employee of private company - Females:
| Graham-Thrift: | 65.6% (7,894) |
| Washington: | 61.7% (798,326) |
Self-employed in own incorporated business - Females:
| Graham-Thrift: | 1.6% (194) |
| Washington: | 2.0% (25,933) |
Private not-for-profit wage and salary workers - Females:
| Graham-Thrift: | 8.4% (1,011) |
| Washington: | 9.9% (128,670) |
Local government workers - Females:
| Graham-Thrift: | 6.4% (765) |
| Washington: | 7.6% (98,317) |
State government workers - Females:
| Graham-Thrift: | 7.5% (909) |
| Washington: | 8.9% (115,574) |
Federal government workers - Females:
| Graham-Thrift: | 3.9% (465) |
| Washington: | 2.8% (36,390) |
Self-employed workers in own not incorporated business - Females:
| Graham-Thrift: | 6.2% (750) |
| Washington: | 6.6% (85,628) |
Unpaid family workers - Females:
| Graham-Thrift: | 0.4% (53) |
| Washington: | 0.4% (5,255) |