Work and Jobs in Hatton, Alabama (AL) Detailed Stats
Occupations, Industries, Unemployment, Workers, Commute
Settings
X


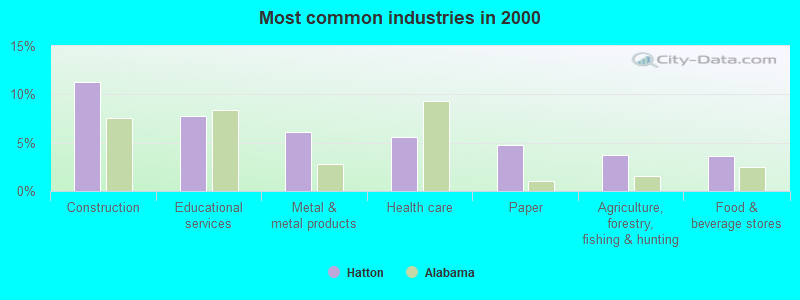
The most common industries in Hatton are: Construction (11.3% of civilian employees), Educational services (7.8% of civilian employees), Metal & metal products (6.1% of civilian employees). 70.9% of workers are employees of private companies, which is 2.3% greater than the rate of 69.3% across the entire state of Alabama.
Most common industries
Most common industries | |||
|---|---|---|---|
Industry | All | Males | Females |
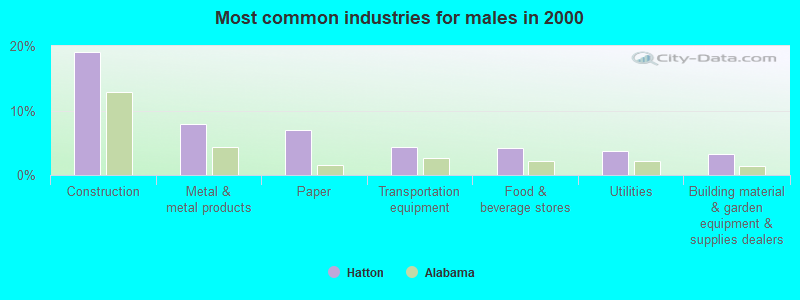
| Construction | 11.3% (235) | 19.1% (235) | 0.0% (0) |
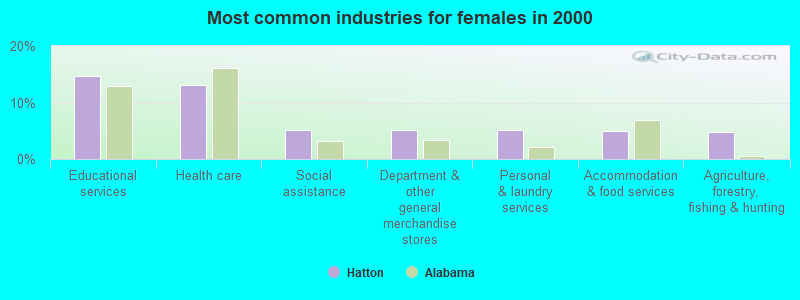
| Educational services | 7.8% (161) | 2.9% (36) | 14.8% (125) |
| Metal and metal products | 6.1% (127) | 7.9% (97) | 3.5% (30) |
| Health care | 5.5% (115) | 0.3% (4) | 13.1% (111) |
| Paper | 4.8% (99) | 6.9% (85) | 1.7% (14) |
| Agriculture, forestry, fishing and hunting | 3.8% (78) | 3.1% (38) | 4.7% (40) |
| Food and beverage stores | 3.7% (76) | 4.1% (51) | 3.0% (25) |
| Public administration | 3.5% (73) | 3.3% (40) | 3.9% (33) |
| Accommodation and food services | 3.1% (64) | 1.8% (22) | 5.0% (42) |
| Department and other general merchandise stores | 2.7% (55) | 1.0% (12) | 5.1% (43) |
| Professional, scientific, and technical services | 2.7% (55) | 1.5% (19) | 4.3% (36) |
| Utilities | 2.6% (54) | 3.7% (46) | 0.9% (8) |
| Transportation equipment | 2.6% (53) | 4.3% (53) | 0.0% (0) |
| Personal and laundry services | 2.4% (50) | 0.6% (7) | 5.1% (43) |
| Administrative and support and waste management services | 2.2% (45) | 1.9% (23) | 2.6% (22) |
| Social assistance | 2.1% (44) | 0.0% (0) | 5.2% (44) |
| Finance and insurance | 2.0% (42) | 1.6% (20) | 2.6% (22) |
| Building material and garden equipment and supplies dealers | 1.9% (40) | 3.3% (40) | 0.0% (0) |
| Furniture and home furnishings, and household appliance stores | 1.9% (40) | 2.1% (26) | 1.7% (14) |
| Truck transportation | 1.8% (38) | 2.2% (27) | 1.3% (11) |
| Food | 1.7% (35) | 2.8% (35) | 0.0% (0) |
| Wood products | 1.7% (35) | 1.1% (14) | 2.5% (21) |
| Plastics and rubber products | 1.7% (35) | 2.8% (35) | 0.0% (0) |
| Apparel | 1.6% (33) | 1.3% (16) | 2.0% (17) |
| U. S. Postal service | 1.5% (32) | 1.7% (21) | 1.3% (11) |
| Chemicals | 1.4% (29) | 2.0% (24) | 0.6% (5) |
| Repair and maintenance | 1.3% (28) | 2.3% (28) | 0.0% (0) |
| Other direct selling establishments | 1.1% (22) | 0.4% (5) | 2.0% (17) |
| Miscellaneous manufacturing | 1.0% (21) | 0.9% (11) | 1.2% (10) |
| Pharmacies and drug stores | 1.0% (20) | 0.6% (7) | 1.5% (13) |
| Real estate and rental and leasing | 1.0% (20) | 1.6% (20) | 0.0% (0) |
| Gasoline stations | 0.8% (17) | 0.9% (11) | 0.7% (6) |
| Machinery | 0.8% (16) | 1.3% (16) | 0.0% (0) |
| Computer and electronic products | 0.7% (15) | 0.7% (8) | 0.8% (7) |
| Other transportation, and support activities, and couriers | 0.7% (15) | 0.7% (9) | 0.7% (6) |
| Professional and commercial equipment and supplies merchant wholesalers | 0.7% (14) | 1.1% (14) | 0.0% (0) |
| Mining, quarrying, and oil and gas extraction | 0.7% (14) | 1.1% (14) | 0.0% (0) |
| Machinery, equipment, and supplies merchant wholesalers | 0.6% (13) | 1.1% (13) | 0.0% (0) |
| Motor vehicle and parts dealers | 0.5% (11) | 0.0% (0) | 1.3% (11) |
| Arts, entertainment, and recreation | 0.5% (11) | 0.4% (5) | 0.7% (6) |
| Motor vehicles, parts and supplies merchant wholesalers | 0.5% (11) | 0.9% (11) | 0.0% (0) |
| Religious, grantmaking, civic, professional, and similar organizations | 0.5% (11) | 0.0% (0) | 1.3% (11) |
| Used merchandise, gift, novelty, and souvenir, and other miscellaneous stores | 0.5% (10) | 0.3% (4) | 0.7% (6) |
| Private households | 0.5% (10) | 0.0% (0) | 1.2% (10) |
| Textile mills and textile products | 0.4% (9) | 0.5% (6) | 0.4% (3) |
| Furniture and related product manufacturing | 0.4% (8) | 0.7% (8) | 0.0% (0) |
| Vending machine operators | 0.3% (7) | 0.0% (0) | 0.8% (7) |
| Electrical equipment, appliances, and components | 0.3% (6) | 0.0% (0) | 0.7% (6) |
| Jewelry, luggage, and leather goods stores | 0.3% (6) | 0.5% (6) | 0.0% (0) |
| Health and personal care, except drug, stores | 0.2% (5) | 0.0% (0) | 0.6% (5) |
| Apparel, fabrics, and notions merchant wholesalers | 0.2% (5) | 0.0% (0) | 0.6% (5) |
| Hardware, plumbing and heating equipment, and supplies merchant wholesalers | 0.2% (4) | 0.3% (4) | 0.0% (0) |
| Nonmetallic mineral products | 0.1% (3) | 0.2% (3) | 0.0% (0) |
Unemployment in Hatton
- Unemployment by race in 2000
- Unemployment rate for White non-Hispanic residents
- 5.3%Males
- 6.9%Females
- Unemployment rate for American Indian and Alaska Native residents
- 13.4%Females
- Unemployment rate for two or more race residents
- 12.2%Females
Time leaving home to go to work

<5am:
| Hatton: | 4.6% (93) |
| Alabama: | 4.2% (80,283) |
5:30am:
| Hatton: | 6.9% (140) |
| Alabama: | 3.9% (73,270) |
6am:
| Hatton: | 9.0% (183) |
| Alabama: | 5.8% (109,814) |
6:30am:
| Hatton: | 11.7% (237) |
| Alabama: | 10.3% (195,070) |
7am:
| Hatton: | 14.5% (295) |
| Alabama: | 12.7% (242,086) |
7:30am:
| Hatton: | 13.4% (273) |
| Alabama: | 16.7% (317,590) |
8am:
| Hatton: | 9.7% (198) |
| Alabama: | 15.7% (298,086) |
8:30am:
| Hatton: | 4.0% (81) |
| Alabama: | 7.1% (135,165) |
9am:
| Hatton: | 2.6% (53) |
| Alabama: | 2.9% (55,392) |
10am:
| Hatton: | 2.5% (51) |
| Alabama: | 3.5% (67,166) |
11am:
| Hatton: | 0.5% (11) |
| Alabama: | 1.5% (29,085) |
12pm:
| Hatton: | 0.7% (14) |
| Alabama: | 0.7% (13,694) |
4pm:
| Hatton: | 6.2% (127) |
| Alabama: | 6.3% (119,754) |
>4pm:
| Hatton: | 10.2% (207) |
| Alabama: | 6.5% (124,331) |
Travel time to work


Less than 5 minutes:
| Hatton: | 1.6% (32) |
| Alabama: | 3.1% (58,125) |
5 to 9 minutes:
| Hatton: | 5.1% (104) |
| Alabama: | 10.3% (196,568) |
10 to 14 minutes:
| Hatton: | 8.8% (178) |
| Alabama: | 15.0% (284,405) |
15 to 19 minutes:
| Hatton: | 10.3% (210) |
| Alabama: | 17.0% (323,887) |
20 to 24 minutes:
| Hatton: | 11.0% (224) |
| Alabama: | 15.0% (285,904) |
25 to 29 minutes:
| Hatton: | 7.0% (142) |
| Alabama: | 5.8% (110,204) |
30 to 34 minutes:
| Hatton: | 19.4% (395) |
| Alabama: | 13.7% (260,798) |
35 to 39 minutes:
| Hatton: | 4.7% (96) |
| Alabama: | 2.5% (46,607) |
40 to 44 minutes:
| Hatton: | 7.5% (152) |
| Alabama: | 2.6% (49,212) |
45 to 59 minutes:
| Hatton: | 11.8% (239) |
| Alabama: | 6.7% (127,205) |
60 to 89 minutes:
| Hatton: | 5.9% (119) |
| Alabama: | 3.7% (69,866) |
90 or more minutes:
| Hatton: | 3.5% (72) |
| Alabama: | 2.5% (48,005) |
Means of transportation to work

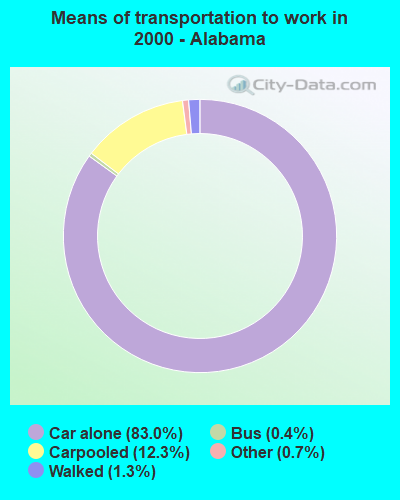
Drove car alone:
| Hatton: | 84.2% (1,712) |
| Alabama: | 83.0% (1,576,882) |
Carpooled:
| Hatton: | 11.5% (234) |
| Alabama: | 12.3% (234,020) |
Walked:
| Hatton: | 0.3% (7) |
| Alabama: | 1.3% (25,360) |
Other means:
| Hatton: | 0.5% (10) |
| Alabama: | 0.7% (12,430) |
Private vehicle occupancy

Drove alone:
| Hatton: | 88.0% (1,712) |
| Alabama: | 87.1% (1,576,882) |
In 2 person carpool:
| Hatton: | 6.8% (133) |
| Alabama: | 10.1% (182,201) |
In 3 person carpool:
| Hatton: | 3.1% (61) |
| Alabama: | 1.9% (33,742) |
In 4 person carpool:
| Hatton: | 1.4% (27) |
| Alabama: | 0.6% (10,909) |
In 7+ person carpool:
| Hatton: | 0.7% (13) |
| Alabama: | 0.1% (2,353) |
Class of workers

Employee of private company:
| Hatton: | 70.9% (1,472) |
| Alabama: | 69.3% (1,330,489) |
Self-employed in own incorporated business:
| Hatton: | 2.2% (46) |
| Alabama: | 3.0% (56,994) |
Private not-for-profit wage and salary workers:
| Hatton: | 2.7% (56) |
| Alabama: | 5.7% (109,055) |
Local government workers:
| Hatton: | 6.9% (144) |
| Alabama: | 6.7% (128,778) |
State government workers:
| Hatton: | 5.7% (118) |
| Alabama: | 5.5% (105,286) |
Federal government workers:
| Hatton: | 3.1% (65) |
| Alabama: | 3.4% (64,370) |
Self-employed workers in own not incorporated business:
| Hatton: | 7.7% (159) |
| Alabama: | 6.2% (119,345) |
Unpaid family workers:
| Hatton: | 0.7% (15) |
| Alabama: | 0.3% (5,872) |

Employee of private company - Males:
| Hatton: | 77.3% (950) |
| Alabama: | 71.8% (738,995) |
Self-employed in own incorporated business - Males:
| Hatton: | 2.8% (35) |
| Alabama: | 4.1% (42,283) |
Private not-for-profit wage and salary workers - Males:
| Hatton: | 1.9% (23) |
| Alabama: | 3.4% (35,197) |
Local government workers - Males:
| Hatton: | 6.0% (74) |
| Alabama: | 5.3% (54,489) |
State government workers - Males:
| Hatton: | 1.3% (16) |
| Alabama: | 3.9% (40,210) |
Federal government workers - Males:
| Hatton: | 4.4% (54) |
| Alabama: | 3.4% (35,105) |
Self-employed workers in own not incorporated business - Males:
| Hatton: | 6.3% (77) |
| Alabama: | 7.8% (80,382) |

Employee of private company - Females:
| Hatton: | 61.7% (522) |
| Alabama: | 66.4% (591,494) |
Self-employed in own incorporated business - Females:
| Hatton: | 1.3% (11) |
| Alabama: | 1.7% (14,711) |
Private not-for-profit wage and salary workers - Females:
| Hatton: | 3.9% (33) |
| Alabama: | 8.3% (73,858) |
Local government workers - Females:
| Hatton: | 8.3% (70) |
| Alabama: | 8.3% (74,289) |
State government workers - Females:
| Hatton: | 12.1% (102) |
| Alabama: | 7.3% (65,076) |
Federal government workers - Females:
| Hatton: | 1.3% (11) |
| Alabama: | 3.3% (29,265) |
Self-employed workers in own not incorporated business - Females:
| Hatton: | 9.7% (82) |
| Alabama: | 4.4% (38,963) |
Unpaid family workers - Females:
| Hatton: | 1.8% (15) |
| Alabama: | 0.3% (3,046) |