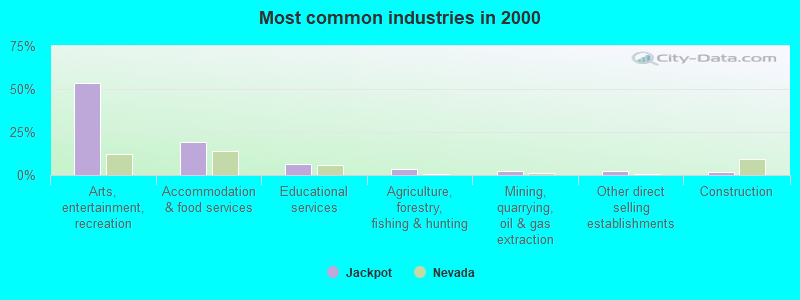
The most common industries in Jackpot are: Arts, entertainment, recreation (53.6% of civilian employees), Accommodation & food services (19.0% of civilian employees), Educational services (6.4% of civilian employees). 87.7% of workers are employees of private companies, which is 12.4% greater than the rate of 76.8% across the entire state of Nevada.
Most common industries
Most common industries
Industry
All
Males
Females
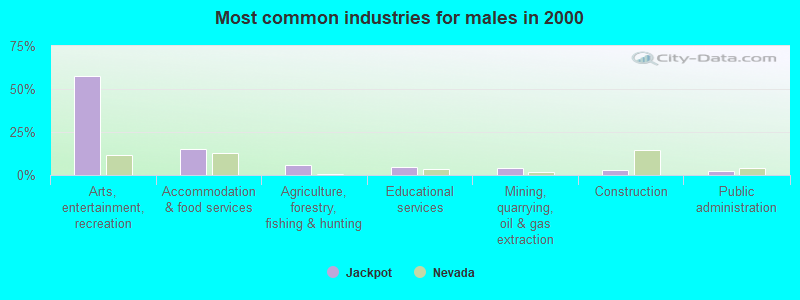
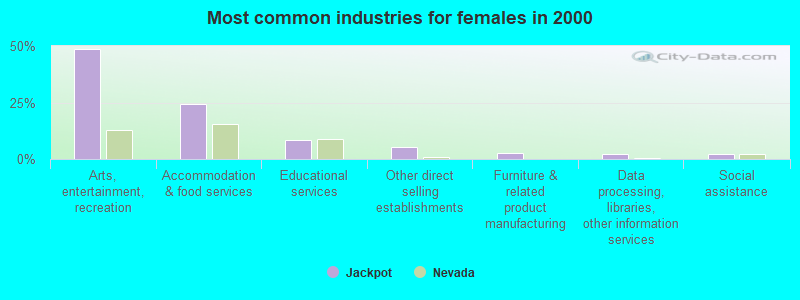
Arts, entertainment, and recreation
53.6% (435)
57.3% (266)
48.6% (169)
Accommodation and food services
19.0% (154)
14.9% (69)
24.4% (85)
Educational services
6.4% (52)
4.7% (22)
8.6% (30)
Agriculture, forestry, fishing and hunting
3.2% (26)
5.6% (26)
0.0% (0)
Mining, quarrying, and oil and gas extraction
2.3% (19)
4.1% (19)
0.0% (0)
Other direct selling establishments
2.3% (19)
0.0% (0)
5.5% (19)
Construction
1.6% (13)
2.8% (13)
0.0% (0)
Public administration
1.4% (11)
2.4% (11)
0.0% (0)
Furniture and related product manufacturing
1.2% (10)
0.0% (0)
2.9% (10)
Administrative and support and waste management services
1.2% (10)
0.9% (4)
1.7% (6)
Repair and maintenance
1.2% (10)
2.2% (10)
0.0% (0)
Wood products
1.0% (8)
1.7% (8)
0.0% (0)
Broadcasting and telecommunications
1.0% (8)
1.7% (8)
0.0% (0)
Data processing, libraries, and other information services
1.0% (8)
0.0% (0)
2.3% (8)
Social assistance
1.0% (8)
0.0% (0)
2.3% (8)
Personal and laundry services
1.0% (8)
1.7% (8)
0.0% (0)
Health care
0.9% (7)
0.0% (0)
2.0% (7)
Pharmacies and drug stores
0.7% (6)
0.0% (0)
1.7% (6)
Unemployment in Jackpot
Unemployment by race in 2000
Unemployment rate for White non-Hispanic residents
7.8%Females
Time leaving home to go to work
<5am:
Jackpot:
7.3% (58)
Nevada:
5.4% (49,950)
6am:
Jackpot:
1.9% (15)
Nevada:
5.1% (47,324)
6:30am:
Jackpot:
6.2% (49)
Nevada:
8.6% (79,614)
7am:
Jackpot:
5.4% (43)
Nevada:
9.1% (84,251)
7:30am:
Jackpot:
11.6% (92)
Nevada:
12.7% (117,088)
8am:
Jackpot:
7.0% (55)
Nevada:
12.3% (113,773)
8:30am:
Jackpot:
7.1% (56)
Nevada:
8.2% (75,666)
9am:
Jackpot:
0.9% (7)
Nevada:
4.2% (38,916)
10am:
Jackpot:
8.4% (66)
Nevada:
5.3% (48,591)
11am:
Jackpot:
3.3% (26)
Nevada:
2.6% (23,932)
4pm:
Jackpot:
27.3% (216)
Nevada:
9.0% (83,088)
>4pm:
Jackpot:
13.5% (107)
Nevada:
9.3% (86,164)
Travel time to work
Less than 5 minutes:
Jackpot:
35.6% (281)
Nevada:
2.7% (24,637)
5 to 9 minutes:
Jackpot:
47.2% (373)
Nevada:
9.6% (88,626)
10 to 14 minutes:
Jackpot:
9.1% (72)
Nevada:
14.9% (137,121)
15 to 19 minutes:
Jackpot:
5.1% (40)
Nevada:
17.9% (165,652)
20 to 24 minutes:
Jackpot:
2.0% (16)
Nevada:
18.3% (169,033)
90 or more minutes:
Jackpot:
1.0% (8)
Nevada:
2.2% (20,487)
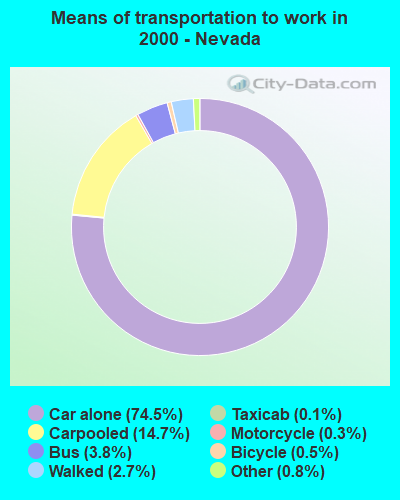
Means of transportation to work
Drove car alone:
Jackpot:
56.1% (443)
Nevada:
74.5% (687,368)
Carpooled:
Jackpot:
13.0% (103)
Nevada:
14.7% (135,874)
Motorcycle:
Jackpot:
0.8% (6)
Nevada:
0.3% (2,693)
Bicycle:
Jackpot:
1.0% (8)
Nevada:
0.5% (4,545)
Walked:
Jackpot:
29.1% (230)
Nevada:
2.7% (24,875)
Private vehicle occupancy
Drove alone:
Jackpot:
81.1% (443)
Nevada:
83.5% (687,368)
In 2 person carpool:
Jackpot:
14.8% (81)
Nevada:
13.1% (108,073)
In 3 person carpool:
Jackpot:
2.9% (16)
Nevada:
2.1% (17,292)
In 4 person carpool:
Jackpot:
1.1% (6)
Nevada:
0.8% (6,404)
Class of workers
Employee of private company:
Jackpot:
87.7% (712)
Nevada:
76.8% (716,774)
Self-employed in own incorporated business:
Jackpot:
1.0% (8)
Nevada:
2.8% (26,180)
Local government workers:
Jackpot:
7.4% (60)
Nevada:
7.0% (65,211)
State government workers:
Jackpot:
3.9% (32)
Nevada:
3.2% (30,014)
Employee of private company - Males:
Jackpot:
88.4% (410)
Nevada:
79.0% (405,296)
Self-employed in own incorporated business - Males:
Jackpot:
1.7% (8)
Nevada:
3.6% (18,490)
Local government workers - Males:
Jackpot:
4.7% (22)
Nevada:
5.3% (27,032)
State government workers - Males:
Jackpot:
5.2% (24)
Nevada:
2.6% (13,333)
Employee of private company - Females:
Jackpot:
86.8% (302)
Nevada:
74.2% (311,478)
Local government workers - Females:
Jackpot:
10.9% (38)
Nevada:
9.1% (38,179)
State government workers - Females:
Jackpot:
2.3% (8)
Nevada:
4.0% (16,681)
Discuss Jackpot, Nevada (NV) on our hugely popular Nevada forum.