Work and Jobs in Kongiganak, Alaska (AK) Detailed Stats
Data:
Unemployment (%)
Unemployment (% change since 2000)
Unemployment (%) - White
Unemployment (% change since 2000) - White
Unemployment (%) - Black or African American
Unemployment (% change since 2000) - Black or African American
Unemployment (%) - Asian
Unemployment (% change since 2000) - Asian
Unemployment (%) - Hispanic or Latino
Unemployment (% change since 2000) - Hispanic or Latino
Unemployment (%) - American Indian and Alaska Native
Unemployment (% change since 2000) - American Indian and Alaska Native
Unemployment (%) - Multirace
Unemployment (% change since 2000) - Multirace
Unemployment (%) - Other Race
Unemployment (% change since 2000) - Other Race
Industry diversity
Most Common Industries - Agriculture, forestry, fishing and hunting, and mining (%)
Most Common Industries - Agriculture, forestry, fishing and hunting (%)
Most Common Industries - Mining, quarrying, and oil and gas extraction (%)
Most Common Industries - Construction (%)
Most Common Industries - Manufacturing (%)
Most Common Industries - Wholesale trade (%)
Most Common Industries - Retail trade (%)
Most Common Industries - Transportation and warehousing, and utilities (%)
Most Common Industries - Transportation and warehousing (%)
Most Common Industries - Utilities (%)
Most Common Industries - Information (%)
Most Common Industries - Finance and insurance, and real estate and rental and leasing (%)
Most Common Industries - Finance and insurance (%)
Most Common Industries - Real estate and rental and leasing (%)
Most Common Industries - Professional, scientific, and management, and administrative and waste management services (%)
Most Common Industries - Professional, scientific, and technical services (%)
Most Common Industries - Management of companies and enterprises (%)
Most Common Industries - Administrative and support and waste management services (%)
Most Common Industries - Educational services, and health care and social assistance (%)
Most Common Industries - Educational services (%)
Most Common Industries - Health care and social assistance (%)
Most Common Industries - Arts, entertainment, and recreation, and accommodation and food services (%)
Most Common Industries - Arts, entertainment, and recreation (%)
Most Common Industries - Accommodation and food services (%)
Most Common Industries - Other services, except public administration (%)
Most Common Industries - Public administration (%)
Occupation diversity
Most Common Occupations - Management, business, science, and arts occupations (%)
Most Common Occupations - Management, business, and financial occupations (%)
Most Common Occupations - Management occupations (%)
Most Common Occupations - Business and financial operations occupations (%)
Most Common Occupations - Computer, engineering, and science occupations (%)
Most Common Occupations - Computer and mathematical occupations (%)
Most Common Occupations - Architecture and engineering occupations (%)
Most Common Occupations - Life, physical, and social science occupations (%)
Most Common Occupations - Education, legal, community service, arts, and media occupations (%)
Most Common Occupations - Community and social service occupations (%)
Most Common Occupations - Legal occupations (%)
Most Common Occupations - Education, training, and library occupations (%)
Most Common Occupations - Arts, design, entertainment, sports, and media occupations (%)
Most Common Occupations - Healthcare practitioners and technical occupations (%)
Most Common Occupations - Health diagnosing and treating practitioners and other technical occupations (%)
Most Common Occupations - Health technologists and technicians (%)
Most Common Occupations - Service occupations (%)
Most Common Occupations - Healthcare support occupations (%)
Most Common Occupations - Protective service occupations (%)
Most Common Occupations - Fire fighting and prevention, and other protective service workers including supervisors (%)
Most Common Occupations - Law enforcement workers including supervisors (%)
Most Common Occupations - Food preparation and serving related occupations (%)
Most Common Occupations - Building and grounds cleaning and maintenance occupations (%)
Most Common Occupations - Personal care and service occupations (%)
Most Common Occupations - Sales and office occupations (%)
Most Common Occupations - Sales and related occupations (%)
Most Common Occupations - Office and administrative support occupations (%)
Most Common Occupations - Natural resources, construction, and maintenance occupations (%)
Most Common Occupations - Farming, fishing, and forestry occupations (%)
Most Common Occupations - Construction and extraction occupations (%)
Most Common Occupations - Installation, maintenance, and repair occupations (%)
Most Common Occupations - Production, transportation, and material moving occupations (%)
Most Common Occupations - Production occupations (%)
Most Common Occupations - Transportation occupations (%)
Most Common Occupations - Material moving occupations (%)
Private vehicle occupancy - Drove alone (% change since 2000)
Private vehicle occupancy - Carpooled (%)
Private vehicle occupancy - Carpooled (% change since 2000)
Private vehicle occupancy - In 2-person carpool (%)
Private vehicle occupancy - In 2-person carpool (% change since 2000)
Private vehicle occupancy - In 3-person carpool (%)
Private vehicle occupancy - In 3-person carpool (% change since 2000)
Private vehicle occupancy - In 4-person carpool (%)
Private vehicle occupancy - In 4-person carpool (% change since 2000)
Private vehicle occupancy - In 5- or 6-person carpool (%)
Private vehicle occupancy - In 5- or 6-person carpool (% change since 2000)
Private vehicle occupancy - In 7-or-more-person carpool (%)
Private vehicle occupancy - In 7-or-more-person carpool (% change since 2000)
Time Leaving Home To Go To Work - 12:00 a.m. to 4:59 a.m. (%)
Time Leaving Home To Go To Work - 12:00 a.m. to 4:59 a.m. (% change since 2000)
Time Leaving Home To Go To Work - 5:00 a.m. to 5:59 a.m. (%)
Time Leaving Home To Go To Work - 5:00 a.m. to 5:59 a.m. (% change since 2000)
Time Leaving Home To Go To Work - 6:00 a.m. to 6:59 a.m. (%)
Time Leaving Home To Go To Work - 6:00 a.m. to 6:59 a.m. (% change since 2000)
Time Leaving Home To Go To Work - 7:00 a.m. to 7:59 a.m. (%)
Time Leaving Home To Go To Work - 7:00 a.m. to 7:59 a.m. (% change since 2000)
Time Leaving Home To Go To Work - 8:00 a.m. to 8:59 a.m. (%)
Time Leaving Home To Go To Work - 8:00 a.m. to 8:59 a.m. (% change since 2000)
Time Leaving Home To Go To Work - 9:00 a.m. to 9:59 a.m. (%)
Time Leaving Home To Go To Work - 9:00 a.m. to 9:59 a.m. (% change since 2000)
Time Leaving Home To Go To Work - 10:00 a.m. to 10:59 a.m. (%)
Time Leaving Home To Go To Work - 10:00 a.m. to 10:59 a.m. (% change since 2000)
Time Leaving Home To Go To Work - 11:00 a.m. to 11:59 a.m. (%)
Time Leaving Home To Go To Work - 11:00 a.m. to 11:59 a.m. (% change since 2000)
Time Leaving Home To Go To Work - 12:00 p.m. to 3:59 p.m. (%)
Time Leaving Home To Go To Work - 12:00 p.m. to 3:59 p.m. (% change since 2000)
Time Leaving Home To Go To Work - 4:00 p.m. to 11:59 p.m. (%)
Time Leaving Home To Go To Work - 4:00 p.m. to 11:59 p.m. (% change since 2000)
Class of Workers - Employee of private company (%)
Class of Workers - Employee of private company (% change since 2000)
Class of Workers - Self-employed in own incorporated business (%)
Class of Workers - Self-employed in own incorporated business (% change since 2000)
Class of Workers - Private not-for-profit wage and salary workers (%)
Class of Workers - Private not-for-profit wage and salary workers (% change since 2000)
Class of Workers - Local government workers (%)
Class of Workers - Local government workers (% change since 2000)
Class of Workers - State government workers (%)
Class of Workers - State government workers (% change since 2000)
Class of Workers - Federal government workers (%)
Class of Workers - Federal government workers (% change since 2000)
Class of Workers - Self-employed workers in own not incorporated business and Unpaid family workers (%)
Class of Workers - Self-employed workers in own not incorporated business and Unpaid family workers (% change since 2000)
Means of transportation to work - Drove car alone (%)
Means of transportation to work - Drove car alone (% change since 2000)
Means of transportation to work - Carpooled (%)
Means of transportation to work - Carpooled (% change since 2000)
Means of transportation to work - Public transportation (%)
Means of transportation to work - Public transportation (% change since 2000)
Means of transportation to work - Bus or trolley bus (%)
Means of transportation to work - Bus or trolley bus (% change since 2000)
Means of transportation to work - Streetcar or trolley car (%)
Means of transportation to work - Streetcar or trolley car (% change since 2000)
Means of transportation to work - Subway or elevated (%)
Means of transportation to work - Subway or elevated (% change since 2000)
Means of transportation to work - Railroad (%)
Means of transportation to work - Railroad (% change since 2000)
Means of transportation to work - Ferryboat (%)
Means of transportation to work - Ferryboat (% change since 2000)
Means of transportation to work - Taxicab (%)
Means of transportation to work - Taxicab (% change since 2000)
Means of transportation to work - Motorcycle (%)
Means of transportation to work - Motorcycle (% change since 2000)
Means of transportation to work - Bicycle (%)
Means of transportation to work - Bicycle (% change since 2000)
Means of transportation to work - Walked (%)
Means of transportation to work - Walked (% change since 2000)
Means of transportation to work - Other means (%)
Means of transportation to work - Other means (% change since 2000)
Working at home (%)
Working at home (% change since 2000)
Travel time to work - Less than 5 minutes (%)
Travel time to work - Less than 5 minutes (% change since 2000)
Travel time to work - 5 to 9 minutes (%)
Travel time to work - 5 to 9 minutes (% change since 2000)
Travel time to work - 10 to 19 minutes (%)
Travel time to work - 10 to 19 minutes (% change since 2000)
Travel time to work - 20 to 29 minutes (%)
Travel time to work - 20 to 29 minutes (% change since 2000)
Travel time to work - 30 to 39 minutes (%)
Travel time to work - 30 to 39 minutes (% change since 2000)
Travel time to work - 40 to 59 minutes (%)
Travel time to work - 40 to 59 minutes (% change since 2000)
Travel time to work - 60 to 89 minutes (%)
Travel time to work - 60 to 89 minutes (% change since 2000)
Travel time to work - 90 or more minutes (%)
Travel time to work - 90 or more minutes (% change since 2000)
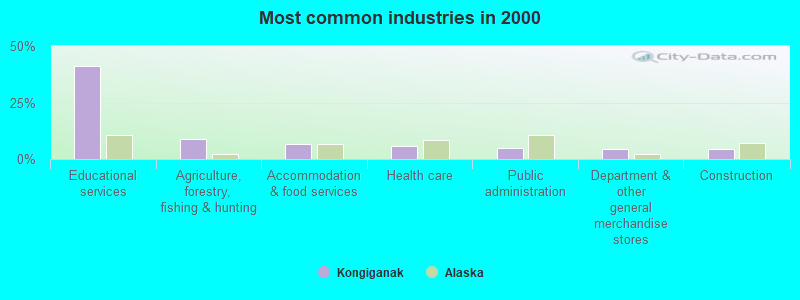
The most common industries in Kongiganak are: Educational services (41.3% of civilian employees), Agriculture, forestry, fishing & hunting (8.7% of civilian employees), Accommodation & food services (6.5% of civilian employees). 100.0% of workers work in Bethel Census Area and 3.4% of all workers work at home. 13.5% of workers are employees of private companies, which is 301.7% less than the rate of 54.2% across the entire state of Alaska.
Whole page based on the data from 2000 / 2022 when the population of Kongiganak, Alaska was 359 / 352
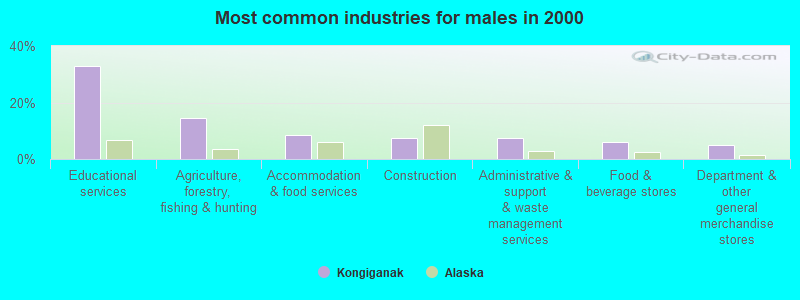
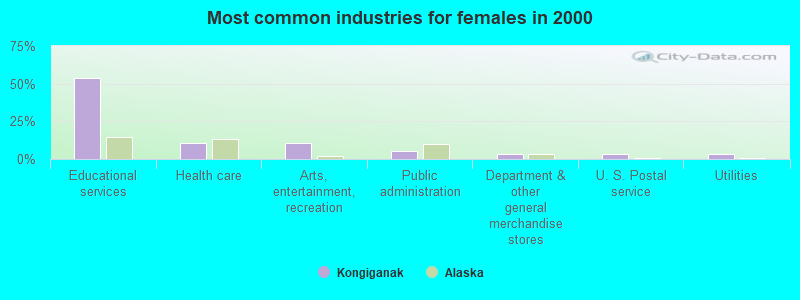
Most common industries
Most common industries Industry All Males Females
Educational services 41.3% 32.9% 53.6% Agriculture, forestry, fishing and hunting 8.7% 14.6% 0.0% Accommodation and food services 6.5% 8.5% 3.6% Health care 5.8% 2.4% 10.7% Public administration 5.1% 4.9% 5.4% Department and other general merchandise stores 4.3% 4.9% 3.6% Construction 4.3% 7.3% 0.0% Administrative and support and waste management services 4.3% 7.3% 0.0% Arts, entertainment, and recreation 4.3% 0.0% 10.7% Food and beverage stores 3.6% 6.1% 0.0% Utilities 2.9% 2.4% 3.6% Personal and laundry services 2.9% 2.4% 3.6% Miscellaneous nondurable goods merchant wholesalers 1.4% 2.4% 0.0% Air transportation 1.4% 2.4% 0.0% U. S. Postal service 1.4% 0.0% 3.6% Food 0.7% 1.2% 0.0% Broadcasting and telecommunications 0.7% 0.0% 1.8%
Unemployment in Kongiganak Unemployment by race in 2022
Unemployment rate for American Indian and Alaska Native residents 21.0% Males9.0% FemalesUnemployment by race in 2000
Unemployment rate for American Indian and Alaska Native residents 2.4% Males5.6% Females
Time leaving home to go to work 12:00 a.m. to 4:59 a.m.: Kongiganak:
6.1% (5)Alaska:
4.1% (13,394)
7:00 a.m. to 7:29 a.m.: Kongiganak:
3.7% (3)Alaska:
13.3% (43,345)
8:00 a.m. to 8:29 a.m.: Kongiganak:
5.1% (4)Alaska:
11.6% (37,835)
8:30 a.m. to 8:59 a.m.: Kongiganak:
15.9% (14)Alaska:
5.7% (18,676)
9:00 a.m. to 9:59 a.m.: Kongiganak:
40.4% (35)Alaska:
7.4% (23,996)
10:00 a.m. to 10:59 a.m.: Kongiganak:
21.7% (19)Alaska:
3.3% (10,720)
4:00 p.m. to 11:59 p.m.: Kongiganak:
4.6% (4)Alaska:
5.9% (19,101)
7:30am: Kongiganak:
3.1% (4)Alaska:
13.2% (38,331)
8am: Kongiganak:
0.8% (1)Alaska:
17.8% (51,692)
8:30am: Kongiganak:
10.2% (13)Alaska:
10.6% (30,799)
9am: Kongiganak:
30.5% (39)Alaska:
6.4% (18,465)
10am: Kongiganak:
30.5% (39)Alaska:
7.0% (20,202)
11am: Kongiganak:
5.5% (7)Alaska:
3.2% (9,274)
4pm: Kongiganak:
14.1% (18)Alaska:
6.2% (18,026)
>4pm: Kongiganak:
5.5% (7)Alaska:
6.6% (19,214)
12:00 a.m. to 4:59 a.m. - Males: Kongiganak:
9.1% (5)Alaska:
4.8% (9,061)
8:00 a.m. to 8:29 a.m. - Males: Kongiganak:
7.5% (4)Alaska:
9.7% (18,349)
8:30 a.m. to 8:59 a.m. - Males: Kongiganak:
18.0% (10)Alaska:
6.1% (11,490)
9:00 a.m. to 9:59 a.m. - Males: Kongiganak:
45.3% (26)Alaska:
6.4% (11,967)
10:00 a.m. to 10:59 a.m. - Males: Kongiganak:
20.7% (12)Alaska:
2.9% (5,512)
7:00 a.m. to 7:29 a.m. - Females: Kongiganak:
11.0% (3)Alaska:
14.6% (20,016)
8:30 a.m. to 8:59 a.m. - Females: Kongiganak:
14.2% (4)Alaska:
5.2% (7,186)
9:00 a.m. to 9:59 a.m. - Females: Kongiganak:
32.6% (10)Alaska:
8.8% (12,029)
10:00 a.m. to 10:59 a.m. - Females: Kongiganak:
23.3% (7)Alaska:
3.8% (5,208)
4:00 p.m. to 11:59 p.m. - Females: Kongiganak:
13.2% (4)Alaska:
5.5% (7,533)
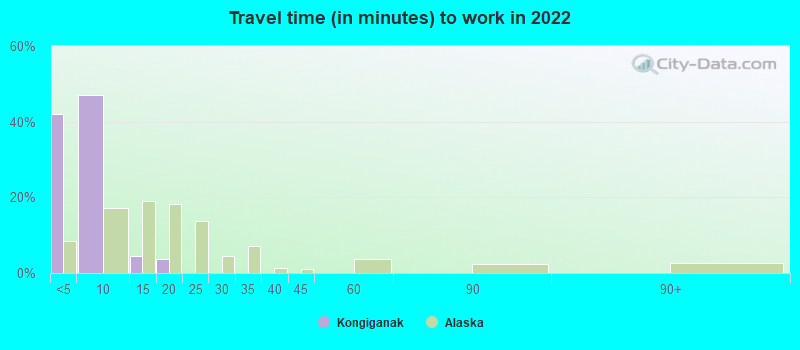
Travel time to work Percentage of workers working in this county: 100.0%Number of people working at home: 3 (3.4% of all workers )
Less than 5 minutes: Kongiganak:
42.0% (41)Alaska:
8.6% (28,330)
5 to 9 minutes: Kongiganak:
47.0% (46)Alaska:
17.3% (57,035)
10 to 14 minutes: Kongiganak:
4.5% (4)Alaska:
19.0% (62,801)
15 to 19 minutes: Kongiganak:
3.8% (4)Alaska:
18.3% (60,461)
Less than 5 minutes: Kongiganak:
30.5% (39)Alaska:
7.6% (22,212)
5 to 9 minutes: Kongiganak:
44.5% (57)Alaska:
17.6% (51,239)
10 to 14 minutes: Kongiganak:
19.5% (25)Alaska:
19.3% (56,182)
15 to 19 minutes: Kongiganak:
3.9% (5)Alaska:
18.5% (53,617)
30 to 34 minutes: Kongiganak:
1.6% (2)Alaska:
6.6% (19,056)
Less than 5 minutes - Males: Kongiganak:
48.0% (29)Alaska:
8.5% (16,422)
5 to 9 minutes - Males: Kongiganak:
45.3% (28)Alaska:
16.7% (32,328)
10 to 14 minutes - Males: Kongiganak:
3.0% (2)Alaska:
18.2% (35,279)
15 to 19 minutes - Males: Kongiganak:
1.5% (1)Alaska:
18.0% (34,761)
Less than 5 minutes - Females: Kongiganak:
31.1% (12)Alaska:
8.7% (11,908)
5 to 9 minutes - Females: Kongiganak:
49.5% (19)Alaska:
18.0% (24,707)
10 to 14 minutes - Females: Kongiganak:
6.7% (3)Alaska:
20.0% (27,522)
15 to 19 minutes - Females: Kongiganak:
7.8% (3)Alaska:
18.7% (25,700)
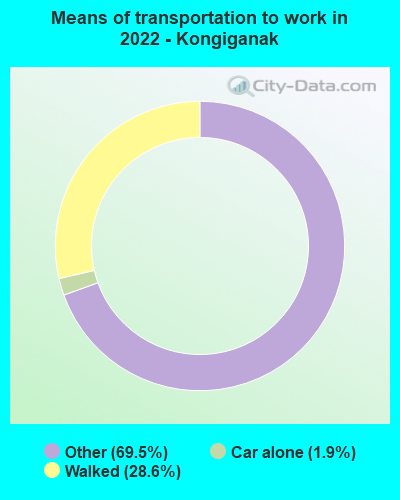
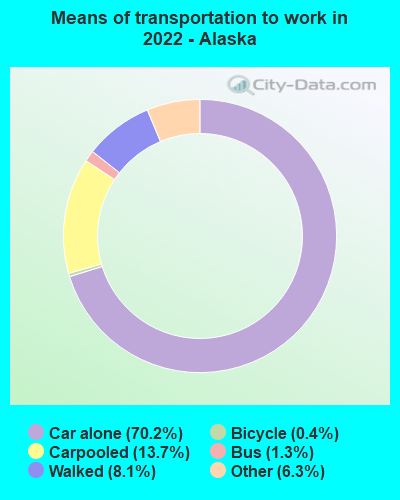
Means of transportation to work Drove car alone: Kongiganak:
1.9% (2)Alaska:
70.2% (98,742)
Walked: Kongiganak:
28.6% (29)Alaska:
8.1% (9,121)
Other means: Kongiganak:
69.5% (71)Alaska:
6.3% (5,997)
Motorcycle: Kongiganak:
2.3% (3)Alaska:
0.1% (244)
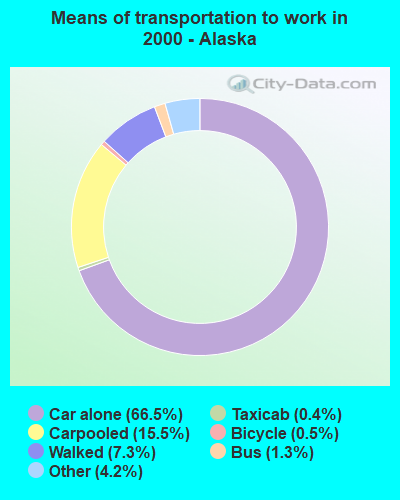
Walked: Kongiganak:
55.5% (71)Alaska:
7.3% (21,298)
Other means: Kongiganak:
42.2% (54)Alaska:
4.2% (12,081)
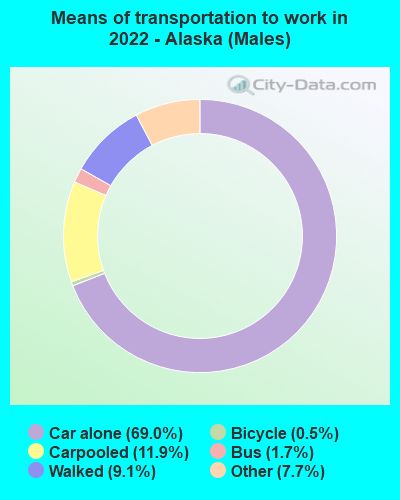
Walked - Males: Kongiganak:
37.5% (23)Alaska:
9.1% (9,121)
Other means - Males: Kongiganak:
62.5% (39)Alaska:
7.7% (5,997)
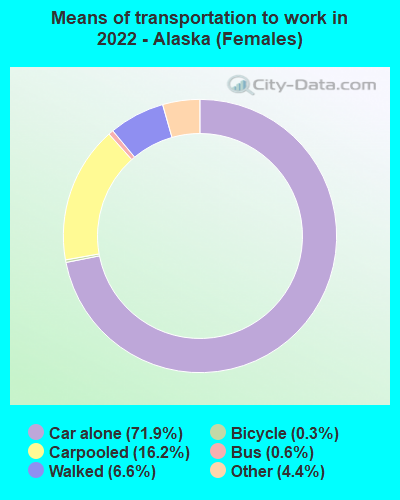
Drove car alone - Females: Kongiganak:
4.9% (2)Alaska:
71.9% (98,742)
Walked - Females: Kongiganak:
14.6% (6)Alaska:
6.6% (9,121)
Other means - Females: Kongiganak:
80.5% (32)Alaska:
4.4% (5,997)
Class of workers
Employee of private company: Kongiganak:
13.5% (12)Alaska:
54.2% (186,966)
Local government workers: Kongiganak:
70.8% (64)Alaska:
10.3% (35,550)
State government workers: Kongiganak:
12.4% (11)Alaska:
8.6% (29,695)
Federal government workers: Kongiganak:
3.4% (3)Alaska:
6.5% (22,411)
Employee of private company: Kongiganak:
38.4% (53)Alaska:
53.1% (149,602)
Local government workers: Kongiganak:
15.9% (22)Alaska:
9.8% (27,669)
State government workers: Kongiganak:
42.8% (59)Alaska:
9.3% (26,317)
Federal government workers: Kongiganak:
2.9% (4)Alaska:
7.6% (21,344)
Employee of private company - Males: Kongiganak:
16.9% (10)Alaska:
58.5% (109,636)
Local government workers - Males: Kongiganak:
67.8% (41)Alaska:
8.5% (15,913)
State government workers - Males: Kongiganak:
10.2% (6)Alaska:
7.8% (14,587)
Federal government workers - Males: Kongiganak:
5.1% (3)Alaska:
7.3% (13,745)
Employee of private company - Females: Kongiganak:
6.7% (2)Alaska:
49.0% (77,330)
Local government workers - Females: Kongiganak:
76.7% (23)Alaska:
12.5% (19,637)
State government workers - Females: Kongiganak:
16.7% (5)Alaska:
9.6% (15,108)