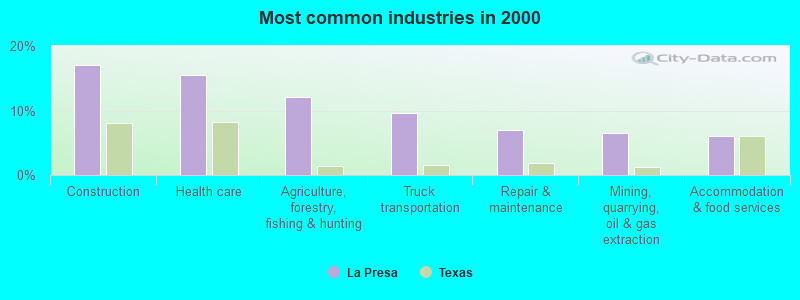
The most common industries in La Presa are: Construction (17.1% of civilian employees), Health care (15.6% of civilian employees), Agriculture, forestry, fishing & hunting (12.1% of civilian employees). 100.0% of workers work in Webb County. 46.0% of workers are employees of private companies, which is 51.3% less than the rate of 69.6% across the entire state of Texas.
Whole page based on the data from 2000 / 2022 when the population of La Presa, Texas was 508 / 220
Most common industries
Most common industries
Industry
All
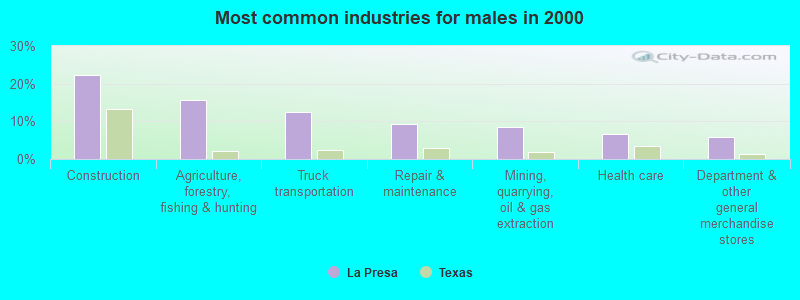
Males
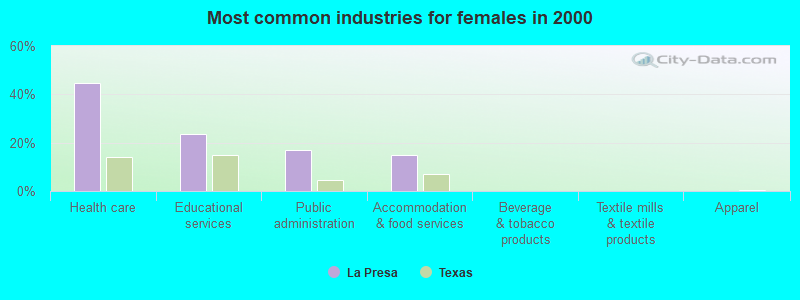
Females
Construction
17.1% (34)
22.4% (34)
0.0% (0)
Health care
15.6% (31)
6.6% (10)
44.7% (21)
Agriculture, forestry, fishing and hunting
12.1% (24)
15.8% (24)
0.0% (0)
Truck transportation
9.5% (19)
12.5% (19)
0.0% (0)
Repair and maintenance
7.0% (14)
9.2% (14)
0.0% (0)
Mining, quarrying, and oil and gas extraction
6.5% (13)
8.6% (13)
0.0% (0)
Accommodation and food services
6.0% (12)
3.3% (5)
14.9% (7)
Educational services
5.5% (11)
0.0% (0)
23.4% (11)
Department and other general merchandise stores
4.5% (9)
5.9% (9)
0.0% (0)
Professional, scientific, and technical services
4.5% (9)
5.9% (9)
0.0% (0)
Public administration
4.0% (8)
0.0% (0)
17.0% (8)
Used merchandise, gift, novelty, and souvenir, and other miscellaneous stores
4.0% (8)
5.3% (8)
0.0% (0)
Administrative and support and waste management services
3.5% (7)
4.6% (7)
0.0% (0)
Unemployment in La Presa
Unemployment by race in 2000
Unemployment rate for Hispanic or Latino residents
11.2%Males
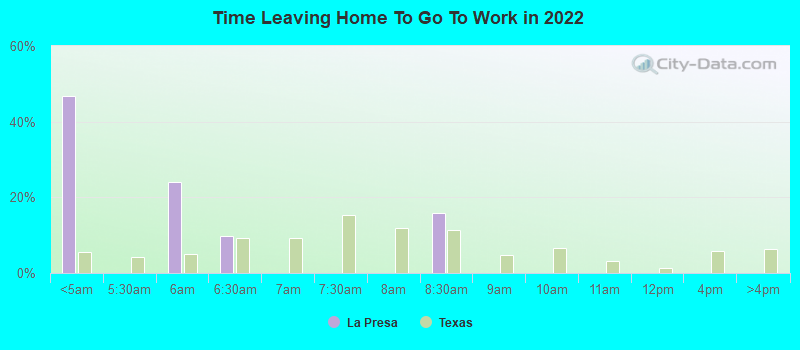
Time leaving home to go to work
12:00 a.m. to 4:59 a.m.:
La Presa:
46.8% (41)
Texas:
5.5% (678,264)
5:30 a.m. to 5:59 a.m.:
La Presa:
24.2% (21)
Texas:
4.9% (603,953)
6:00 a.m. to 6:29 a.m.:
La Presa:
9.7% (9)
Texas:
9.4% (1,155,020)
8:00 a.m. to 8:29 a.m.:
La Presa:
15.8% (14)
Texas:
11.3% (1,400,175)
6am:
La Presa:
30.7% (61)
Texas:
4.4% (403,423)
6:30am:
La Presa:
22.1% (44)
Texas:
8.8% (808,876)
7am:
La Presa:
5.0% (10)
Texas:
10.7% (976,557)
7:30am:
La Presa:
8.5% (17)
Texas:
16.4% (1,500,904)
8am:
La Presa:
17.6% (35)
Texas:
16.8% (1,536,308)
8:30am:
La Presa:
7.5% (15)
Texas:
10.0% (913,601)
9am:
La Presa:
4.5% (9)
Texas:
4.4% (398,656)
10am:
La Presa:
4.0% (8)
Texas:
5.2% (472,592)
12:00 a.m. to 4:59 a.m. - Males:
La Presa:
45.3% (33)
Texas:
7.0% (477,284)
5:30 a.m. to 5:59 a.m. - Males:
La Presa:
34.0% (25)
Texas:
5.9% (402,788)
6:00 a.m. to 6:29 a.m. - Males:
La Presa:
9.6% (7)
Texas:
10.9% (751,118)
8:00 a.m. to 8:29 a.m. - Females:
La Presa:
80.8% (13)
Texas:
12.2% (671,134)
Travel time to work
Percentage of workers working in this county: 100.0%
10 to 14 minutes:
La Presa:
5.0% (10)
Texas:
14.4% (1,317,555)
15 to 19 minutes:
La Presa:
19.6% (39)
Texas:
16.0% (1,467,945)
20 to 24 minutes:
La Presa:
4.5% (9)
Texas:
13.9% (1,276,781)
30 to 34 minutes:
La Presa:
32.7% (65)
Texas:
14.3% (1,309,699)
40 to 44 minutes:
La Presa:
12.6% (25)
Texas:
3.1% (280,916)
90 or more minutes:
La Presa:
25.6% (51)
Texas:
2.4% (218,800)
Means of transportation to work
Drove car alone:
La Presa:
56.8% (113)
Texas:
77.7% (7,115,590)
Carpooled:
La Presa:
43.2% (86)
Texas:
14.5% (1,326,012)
Private vehicle occupancy
Drove alone:
La Presa:
99.0% (33)
Texas:
87.6% (10,283,021)
Drove alone:
La Presa:
56.8% (113)
Texas:
84.3% (7,115,590)
In 2 person carpool:
La Presa:
4.5% (9)
Texas:
11.6% (982,994)
In 3 person carpool:
La Presa:
7.0% (14)
Texas:
2.4% (201,602)
In 5-6 person carpool:
La Presa:
9.5% (19)
Texas:
0.5% (40,662)
In 7+ person carpool:
La Presa:
22.1% (44)
Texas:
0.2% (17,236)
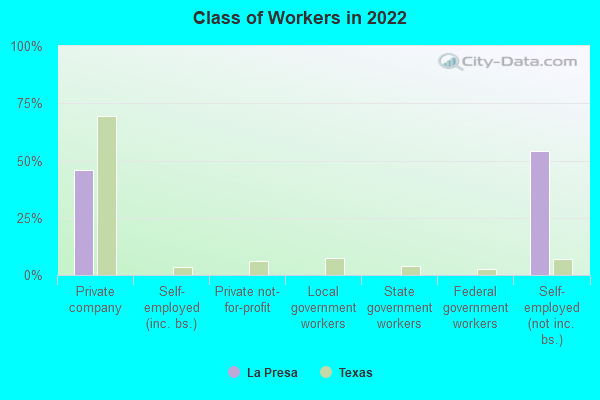
Class of workers
Employee of private company:
La Presa:
46.0% (41)
Texas:
69.6% (10,139,666)
Self-employed workers in own not incorporated business:
La Presa:
54.0% (49)
Texas:
6.8% (998,270)
Employee of private company:
La Presa:
68.3% (136)
Texas:
69.6% (6,425,274)
Self-employed in own incorporated business:
La Presa:
5.0% (10)
Texas:
2.7% (250,864)
Private not-for-profit wage and salary workers:
La Presa:
10.1% (20)
Texas:
5.7% (526,631)
Local government workers:
La Presa:
5.5% (11)
Texas:
6.6% (608,479)
Federal government workers:
La Presa:
4.0% (8)
Texas:
2.6% (237,177)
Self-employed workers in own not incorporated business:
La Presa:
7.0% (14)
Texas:
7.1% (653,527)
Employee of private company - Males:
La Presa:
33.8% (25)
Texas:
73.1% (5,788,450)
Self-employed workers in own not incorporated business - Males:
La Presa:
66.2% (49)
Texas:
7.7% (609,246)
Employee of private company - Females:
La Presa:
100.0% (17)
Texas:
65.4% (4,351,216)
Discuss La Presa, Texas (TX) on our hugely popular Texas forum.