Work and Jobs in Lanham-Seabrook, Maryland (MD) Detailed Stats
Occupations, Industries, Unemployment, Workers, Commute

Recent posts about work in Lanham-Seabrook, Maryland on our local forum with over 2,400,000 registered users:
 | How do I get a job in Maryland within the next few months? (15 replies) |
| Commute times to Lanham-Seabrook, MD (5 replies) |
| Thinking of moving to PG suburbs (68 replies) |
| Potential move to Landover, MD (from Raleigh, NC). Need advice (20 replies) |
| White Flight in Bowie?! (132 replies) |
| Can you give a Quick Summary of these PG County towns??? (7 replies) |
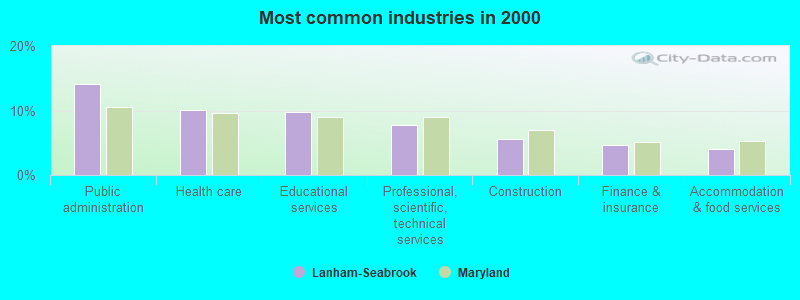
The most common industries in Lanham-Seabrook are: Public administration (14.2% of civilian employees), Health care (10.0% of civilian employees), Educational services (9.7% of civilian employees). 56.7% of workers are employees of private companies, which is 6.8% less than the rate of 60.5% across the entire state of Maryland.
Most common industries
Most common industries | |||
|---|---|---|---|
Industry | All | Males | Females |
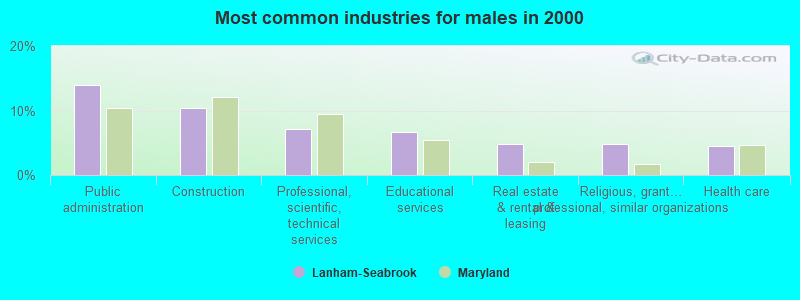
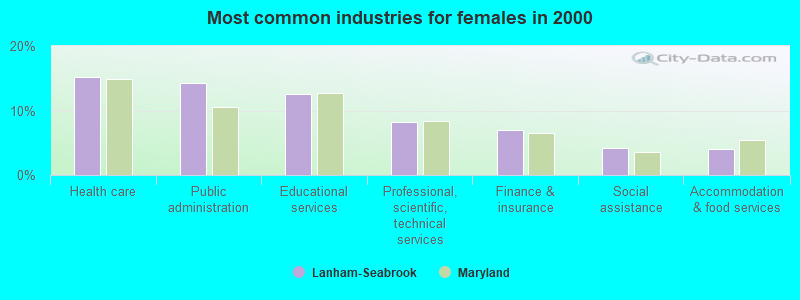
| Public administration | 14.2% (1,323) | 14.0% (633) | 14.3% (690) |
| Health care | 10.0% (938) | 4.6% (206) | 15.2% (732) |
| Educational services | 9.7% (907) | 6.6% (299) | 12.6% (608) |
| Professional, scientific, and technical services | 7.7% (719) | 7.2% (325) | 8.2% (394) |
| Construction | 5.6% (525) | 10.4% (470) | 1.1% (55) |
| Finance and insurance | 4.7% (438) | 2.2% (99) | 7.0% (339) |
| Accommodation and food services | 4.1% (379) | 4.2% (188) | 4.0% (191) |
| Religious, grantmaking, civic, professional, and similar organizations | 4.0% (375) | 4.8% (218) | 3.3% (157) |
| Real estate and rental and leasing | 3.8% (354) | 4.8% (219) | 2.8% (135) |
| Administrative and support and waste management services | 3.1% (294) | 3.5% (157) | 2.8% (137) |
| Social assistance | 2.8% (259) | 1.2% (56) | 4.2% (203) |
| Broadcasting and telecommunications | 2.7% (249) | 2.2% (99) | 3.1% (150) |
| Food and beverage stores | 2.6% (240) | 2.7% (120) | 2.5% (120) |
| U. S. Postal service | 2.3% (214) | 1.9% (85) | 2.7% (129) |
| Personal and laundry services | 2.2% (207) | 1.8% (81) | 2.6% (126) |
| Other transportation, and support activities, and couriers | 2.1% (193) | 4.0% (183) | 0.2% (10) |
| Repair and maintenance | 1.4% (128) | 2.8% (128) | 0.0% (0) |
| Motor vehicle and parts dealers | 1.3% (125) | 1.9% (85) | 0.8% (40) |
| Arts, entertainment, and recreation | 1.0% (94) | 0.7% (32) | 1.3% (62) |
| Department and other general merchandise stores | 1.0% (91) | 1.0% (45) | 1.0% (46) |
| Data processing, libraries, and other information services | 0.9% (83) | 1.0% (45) | 0.8% (38) |
| Radio, TV, and computer stores | 0.9% (81) | 1.2% (54) | 0.6% (27) |
| Truck transportation | 0.8% (73) | 1.4% (65) | 0.2% (8) |
| Utilities | 0.8% (73) | 0.9% (42) | 0.6% (31) |
| Publishing, and motion picture and sound recording industries | 0.7% (69) | 0.6% (28) | 0.9% (41) |
| Printing and related support activities | 0.7% (65) | 1.4% (65) | 0.0% (0) |
| Groceries and related products merchant wholesalers | 0.7% (64) | 1.4% (64) | 0.0% (0) |
| Clothing and accessories, including shoe, stores | 0.6% (55) | 0.7% (31) | 0.5% (24) |
| Pharmacies and drug stores | 0.5% (51) | 0.8% (35) | 0.3% (16) |
| Computer and electronic products | 0.5% (50) | 0.5% (22) | 0.6% (28) |
| Food | 0.5% (47) | 0.7% (30) | 0.4% (17) |
| Sporting goods, camera, and hobby and toy stores | 0.5% (45) | 0.2% (7) | 0.8% (38) |
| Transportation equipment | 0.4% (40) | 0.8% (37) | 0.1% (3) |
| Professional and commercial equipment and supplies merchant wholesalers | 0.4% (37) | 0.8% (37) | 0.0% (0) |
| Private households | 0.4% (33) | 0.0% (0) | 0.7% (33) |
| Building material and garden equipment and supplies dealers | 0.4% (33) | 0.4% (17) | 0.3% (16) |
| Used merchandise, gift, novelty, and souvenir, and other miscellaneous stores | 0.4% (33) | 0.4% (17) | 0.3% (16) |
| Air transportation | 0.3% (29) | 0.1% (6) | 0.5% (23) |
| Health and personal care, except drug, stores | 0.3% (28) | 0.0% (0) | 0.6% (28) |
| Rail transportation | 0.3% (28) | 0.6% (28) | 0.0% (0) |
| Book stores and news dealers | 0.3% (27) | 0.4% (17) | 0.2% (10) |
| Metal and metal products | 0.3% (26) | 0.3% (12) | 0.3% (14) |
| Warehousing and storage | 0.2% (19) | 0.2% (9) | 0.2% (10) |
| Motor vehicles, parts and supplies merchant wholesalers | 0.2% (18) | 0.4% (18) | 0.0% (0) |
| Miscellaneous manufacturing | 0.2% (18) | 0.1% (5) | 0.3% (13) |
| Furniture and home furnishings, and household appliance stores | 0.2% (17) | 0.4% (17) | 0.0% (0) |
| Electronic shopping and mail-order houses | 0.2% (17) | 0.3% (14) | 0.1% (3) |
| Textile mills and textile products | 0.2% (16) | 0.2% (9) | 0.1% (7) |
| Music stores | 0.2% (15) | 0.2% (7) | 0.2% (8) |
| Other direct selling establishments | 0.1% (11) | 0.0% (0) | 0.2% (11) |
| Electrical equipment, appliances, and components | 0.1% (10) | 0.0% (0) | 0.2% (10) |
| Office supplies and stationery stores | 0.1% (9) | 0.2% (9) | 0.0% (0) |
| Recyclable material merchant wholesalers | 0.1% (9) | 0.2% (9) | 0.0% (0) |
| Hardware, plumbing and heating equipment, and supplies merchant wholesalers | 0.1% (9) | 0.2% (9) | 0.0% (0) |
| Miscellaneous nondurable goods merchant wholesalers | 0.1% (9) | 0.2% (9) | 0.0% (0) |
| Chemicals | 0.1% (8) | 0.2% (8) | 0.0% (0) |
| Miscellaneous durable goods merchant wholesalers | 0.1% (6) | 0.1% (6) | 0.0% (0) |
| Nonmetallic mineral products | 0.1% (5) | 0.1% (5) | 0.0% (0) |
Unemployment in Lanham-Seabrook
- Unemployment by race in 2000
- Unemployment rate for White non-Hispanic residents
- 3.7%Males
- 1.6%Females
- Unemployment rate for Black residents
- 5.5%Males
- 5.3%Females
- Unemployment rate for Asian residents
- 2.9%Males
- 10.0%Females
- Unemployment rate for other race residents
- 14.3%Females
- Unemployment rate for two or more race residents
- 7.2%Females
- Unemployment rate for Hispanic or Latino residents
- 3.0%Males
- 19.1%Females
Time leaving home to go to work

<5am:
| Lanham-Seabrook: | 2.4% (220) |
| Maryland: | 3.0% (77,561) |
5:30am:
| Lanham-Seabrook: | 2.6% (238) |
| Maryland: | 3.2% (81,972) |
6am:
| Lanham-Seabrook: | 4.9% (453) |
| Maryland: | 4.7% (120,768) |
6:30am:
| Lanham-Seabrook: | 9.8% (906) |
| Maryland: | 9.1% (235,203) |
7am:
| Lanham-Seabrook: | 9.2% (848) |
| Maryland: | 10.3% (267,702) |
7:30am:
| Lanham-Seabrook: | 16.0% (1,470) |
| Maryland: | 14.9% (386,941) |
8am:
| Lanham-Seabrook: | 15.6% (1,434) |
| Maryland: | 14.3% (370,838) |
8:30am:
| Lanham-Seabrook: | 10.6% (975) |
| Maryland: | 11.6% (300,061) |
9am:
| Lanham-Seabrook: | 5.8% (531) |
| Maryland: | 6.0% (154,337) |
10am:
| Lanham-Seabrook: | 6.1% (558) |
| Maryland: | 5.9% (151,747) |
11am:
| Lanham-Seabrook: | 1.9% (176) |
| Maryland: | 2.2% (56,218) |
12pm:
| Lanham-Seabrook: | 1.1% (101) |
| Maryland: | 1.0% (26,260) |
4pm:
| Lanham-Seabrook: | 6.0% (551) |
| Maryland: | 5.3% (136,187) |
>4pm:
| Lanham-Seabrook: | 6.9% (636) |
| Maryland: | 5.4% (139,172) |
Travel time to work
Daytime population change due to commuting: -2,925 (-16.1%)
Workers who live and work in this place: 487 (5.3%)
Workers who live and work in this place: 487 (5.3%)


Less than 5 minutes:
| Lanham-Seabrook: | 1.0% (94) |
| Maryland: | 1.8% (47,843) |
5 to 9 minutes:
| Lanham-Seabrook: | 4.6% (424) |
| Maryland: | 6.6% (169,884) |
10 to 14 minutes:
| Lanham-Seabrook: | 10.2% (939) |
| Maryland: | 10.5% (271,204) |
15 to 19 minutes:
| Lanham-Seabrook: | 9.1% (834) |
| Maryland: | 12.4% (320,679) |
20 to 24 minutes:
| Lanham-Seabrook: | 13.0% (1,199) |
| Maryland: | 13.0% (337,452) |
25 to 29 minutes:
| Lanham-Seabrook: | 5.5% (504) |
| Maryland: | 6.1% (158,702) |
30 to 34 minutes:
| Lanham-Seabrook: | 18.1% (1,666) |
| Maryland: | 14.5% (375,140) |
35 to 39 minutes:
| Lanham-Seabrook: | 3.5% (325) |
| Maryland: | 3.5% (91,893) |
40 to 44 minutes:
| Lanham-Seabrook: | 5.4% (499) |
| Maryland: | 4.8% (123,823) |
45 to 59 minutes:
| Lanham-Seabrook: | 13.0% (1,202) |
| Maryland: | 11.3% (291,586) |
60 to 89 minutes:
| Lanham-Seabrook: | 9.9% (916) |
| Maryland: | 8.6% (223,613) |
90 or more minutes:
| Lanham-Seabrook: | 5.4% (495) |
| Maryland: | 3.6% (93,148) |
Means of transportation to work


Drove car alone:
| Lanham-Seabrook: | 70.4% (6,486) |
| Maryland: | 73.7% (1,910,917) |
Carpooled:
| Lanham-Seabrook: | 14.2% (1,310) |
| Maryland: | 12.4% (320,992) |
Bus or trolley bus:
| Lanham-Seabrook: | 2.6% (243) |
| Maryland: | 3.6% (93,111) |
Streetcar or trolley car:
| Lanham-Seabrook: | 0.3% (29) |
| Maryland: | 0.1% (1,619) |
Subway or elevated:
| Lanham-Seabrook: | 7.7% (712) |
| Maryland: | 2.9% (75,090) |
Railroad:
| Lanham-Seabrook: | 0.4% (35) |
| Maryland: | 0.4% (10,568) |
Taxicab:
| Lanham-Seabrook: | 0.7% (61) |
| Maryland: | 0.3% (6,714) |
Motorcycle:
| Lanham-Seabrook: | 0.2% (14) |
| Maryland: | 0.1% (1,496) |
Bicycle:
| Lanham-Seabrook: | 0.1% (10) |
| Maryland: | 0.2% (4,843) |
Walked:
| Lanham-Seabrook: | 1.8% (168) |
| Maryland: | 2.5% (64,852) |
Other means:
| Lanham-Seabrook: | 0.3% (29) |
| Maryland: | 0.6% (14,621) |
Private vehicle occupancy

Drove alone:
| Lanham-Seabrook: | 83.2% (6,486) |
| Maryland: | 85.6% (1,910,917) |
In 2 person carpool:
| Lanham-Seabrook: | 12.0% (938) |
| Maryland: | 11.2% (249,591) |
In 3 person carpool:
| Lanham-Seabrook: | 3.0% (233) |
| Maryland: | 1.9% (43,068) |
In 4 person carpool:
| Lanham-Seabrook: | 0.8% (64) |
| Maryland: | 0.7% (15,540) |
In 5-6 person carpool:
| Lanham-Seabrook: | 0.5% (40) |
| Maryland: | 0.3% (6,773) |
In 7+ person carpool:
| Lanham-Seabrook: | 0.4% (35) |
| Maryland: | 0.3% (6,020) |
Class of workers

Employee of private company:
| Lanham-Seabrook: | 56.7% (5,296) |
| Maryland: | 60.5% (1,579,238) |
Self-employed in own incorporated business:
| Lanham-Seabrook: | 1.8% (171) |
| Maryland: | 3.2% (82,204) |
Private not-for-profit wage and salary workers:
| Lanham-Seabrook: | 9.9% (923) |
| Maryland: | 8.4% (219,162) |
Local government workers:
| Lanham-Seabrook: | 8.0% (745) |
| Maryland: | 7.9% (204,895) |
State government workers:
| Lanham-Seabrook: | 3.5% (328) |
| Maryland: | 4.4% (114,670) |
Federal government workers:
| Lanham-Seabrook: | 16.4% (1,534) |
| Maryland: | 10.0% (262,046) |
Self-employed workers in own not incorporated business:
| Lanham-Seabrook: | 3.6% (333) |
| Maryland: | 5.4% (140,769) |
Unpaid family workers:
| Lanham-Seabrook: | 0.1% (13) |
| Maryland: | 0.2% (5,473) |

Employee of private company - Males:
| Lanham-Seabrook: | 59.4% (2,686) |
| Maryland: | 64.1% (851,203) |
Self-employed in own incorporated business - Males:
| Lanham-Seabrook: | 2.6% (118) |
| Maryland: | 4.5% (59,935) |
Private not-for-profit wage and salary workers - Males:
| Lanham-Seabrook: | 8.1% (366) |
| Maryland: | 5.6% (74,545) |
Local government workers - Males:
| Lanham-Seabrook: | 7.2% (324) |
| Maryland: | 6.0% (80,099) |
State government workers - Males:
| Lanham-Seabrook: | 3.3% (148) |
| Maryland: | 3.8% (49,893) |
Federal government workers - Males:
| Lanham-Seabrook: | 15.0% (676) |
| Maryland: | 9.9% (131,256) |
Self-employed workers in own not incorporated business - Males:
| Lanham-Seabrook: | 4.3% (194) |
| Maryland: | 6.0% (79,372) |
Unpaid family workers - Males:
| Lanham-Seabrook: | 0.2% (9) |
| Maryland: | 0.2% (2,117) |

Employee of private company - Females:
| Lanham-Seabrook: | 54.1% (2,610) |
| Maryland: | 56.9% (728,035) |
Self-employed in own incorporated business - Females:
| Lanham-Seabrook: | 1.1% (53) |
| Maryland: | 1.7% (22,269) |
Private not-for-profit wage and salary workers - Females:
| Lanham-Seabrook: | 11.6% (557) |
| Maryland: | 11.3% (144,617) |
Local government workers - Females:
| Lanham-Seabrook: | 8.7% (421) |
| Maryland: | 9.7% (124,796) |
State government workers - Females:
| Lanham-Seabrook: | 3.7% (180) |
| Maryland: | 5.1% (64,777) |
Federal government workers - Females:
| Lanham-Seabrook: | 17.8% (858) |
| Maryland: | 10.2% (130,790) |
Self-employed workers in own not incorporated business - Females:
| Lanham-Seabrook: | 2.9% (139) |
| Maryland: | 4.8% (61,397) |
Unpaid family workers - Females:
| Lanham-Seabrook: | 0.1% (4) |
| Maryland: | 0.3% (3,356) |