Work and Jobs in Lawrence, Michigan (MI) Detailed Stats
Occupations, Industries, Unemployment, Workers, Commute
Settings
X


Recent posts about work in Lawrence, Michigan on our local forum with over 2,400,000 registered users:
 | MI Unemployment Hit 15.2% Today... (148 replies) |
| is it worth comprimising walkability in a city? (137 replies) |
| Detroit - Top 15 Richest Cities in America (37 replies) |
| Boy was I sucker... (101 replies) |
| Want to get the HECK of of Central California one day, looking at different areas including SE Michigan/Ann Arbor (18 replies) |
| Go East... and become homeless (154 replies) |
Latest news about work in Lawrence, MI collected exclusively by city-data.com from local newspapers, TV, and radio stations
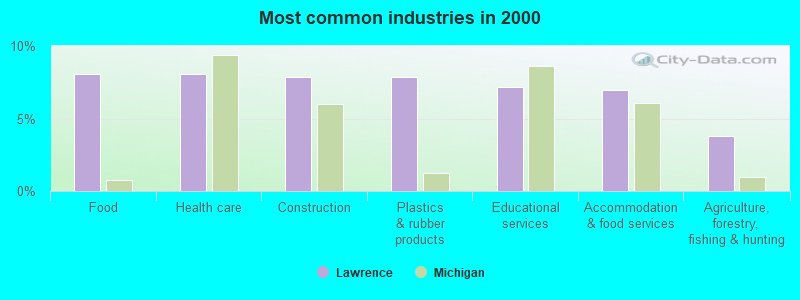
The most common industries in Lawrence are: Food (8.1% of civilian employees), Health care (8.1% of civilian employees), Construction (7.8% of civilian employees). 62.8% of workers work in Van Buren County and 5.1% of all workers work at home. 66.4% of workers are employees of private companies, which is 5.2% less than the rate of 69.8% across the entire state of Michigan.
Whole page based on the data from 2000 / 2022 when the population of Lawrence, Michigan was 1,059 / 1,008
Whole page based on the data from 2000 / 2022 when the population of Lawrence, Michigan was 1,059 / 1,008
Most common industries
Most common industries | |||
|---|---|---|---|
Industry | All | Males | Females |
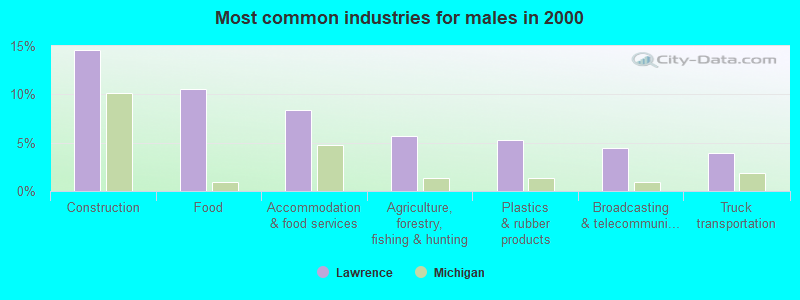
| Food | 8.1% (36) | 10.6% (24) | 5.5% (12) |
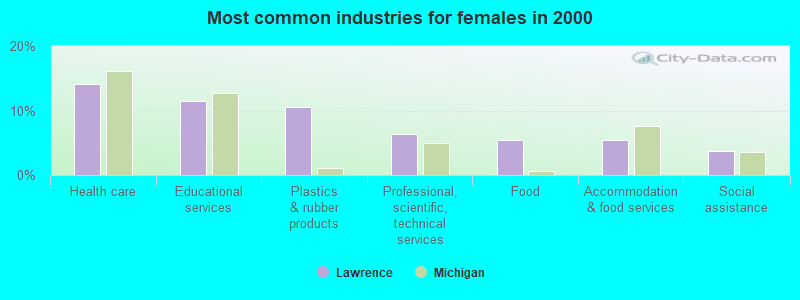
| Health care | 8.1% (36) | 2.2% (5) | 14.2% (31) |
| Construction | 7.8% (35) | 14.5% (33) | 0.9% (2) |
| Plastics and rubber products | 7.8% (35) | 5.3% (12) | 10.5% (23) |
| Educational services | 7.2% (32) | 3.1% (7) | 11.4% (25) |
| Accommodation and food services | 7.0% (31) | 8.4% (19) | 5.5% (12) |
| Agriculture, forestry, fishing and hunting | 3.8% (17) | 5.7% (13) | 1.8% (4) |
| Professional, scientific, and technical services | 3.4% (15) | 0.4% (1) | 6.4% (14) |
| Broadcasting and telecommunications | 2.9% (13) | 4.4% (10) | 1.4% (3) |
| Paper | 2.7% (12) | 2.6% (6) | 2.7% (6) |
| Transportation equipment | 2.5% (11) | 3.1% (7) | 1.8% (4) |
| Wood products | 2.5% (11) | 3.5% (8) | 1.4% (3) |
| Administrative and support and waste management services | 2.5% (11) | 3.5% (8) | 1.4% (3) |
| Religious, grantmaking, civic, professional, and similar organizations | 2.2% (10) | 3.1% (7) | 1.4% (3) |
| U. S. Postal service | 2.0% (9) | 2.6% (6) | 1.4% (3) |
| Truck transportation | 2.0% (9) | 4.0% (9) | 0.0% (0) |
| Metal and metal products | 2.0% (9) | 4.0% (9) | 0.0% (0) |
| Public administration | 2.0% (9) | 1.3% (3) | 2.7% (6) |
| Groceries and related products merchant wholesalers | 1.8% (8) | 0.0% (0) | 3.7% (8) |
| Social assistance | 1.8% (8) | 0.0% (0) | 3.7% (8) |
| Real estate and rental and leasing | 1.8% (8) | 1.3% (3) | 2.3% (5) |
| Food and beverage stores | 1.6% (7) | 0.0% (0) | 3.2% (7) |
| Chemicals | 1.3% (6) | 2.6% (6) | 0.0% (0) |
| Personal and laundry services | 1.1% (5) | 0.0% (0) | 2.3% (5) |
| Furniture and related product manufacturing | 1.1% (5) | 2.2% (5) | 0.0% (0) |
| Electrical and electronic goods merchant wholesalers | 1.1% (5) | 2.2% (5) | 0.0% (0) |
| Machinery | 0.9% (4) | 1.8% (4) | 0.0% (0) |
| Motor vehicle and parts dealers | 0.9% (4) | 1.8% (4) | 0.0% (0) |
| Professional and commercial equipment and supplies merchant wholesalers | 0.9% (4) | 0.9% (2) | 0.9% (2) |
| Other direct selling establishments | 0.9% (4) | 0.9% (2) | 0.9% (2) |
| Finance and insurance | 0.9% (4) | 0.0% (0) | 1.8% (4) |
| Used merchandise, gift, novelty, and souvenir, and other miscellaneous stores | 0.7% (3) | 0.0% (0) | 1.4% (3) |
| Hardware, plumbing and heating equipment, and supplies merchant wholesalers | 0.7% (3) | 0.0% (0) | 1.4% (3) |
| Gasoline stations | 0.7% (3) | 0.0% (0) | 1.4% (3) |
| Pharmacies and drug stores | 0.4% (2) | 0.0% (0) | 0.9% (2) |
| Beverage and tobacco products | 0.4% (2) | 0.9% (2) | 0.0% (0) |
| Sewing, needlework, and piece goods stores | 0.4% (2) | 0.0% (0) | 0.9% (2) |
| Electronic shopping and mail-order houses | 0.4% (2) | 0.0% (0) | 0.9% (2) |
| Data processing, libraries, and other information services | 0.4% (2) | 0.0% (0) | 0.9% (2) |
| Private households | 0.4% (2) | 0.0% (0) | 0.9% (2) |
| Nonmetallic mineral products | 0.4% (2) | 0.9% (2) | 0.0% (0) |
| Miscellaneous manufacturing | 0.4% (2) | 0.0% (0) | 0.9% (2) |
| Department and other general merchandise stores | 0.4% (2) | 0.0% (0) | 0.9% (2) |
| Petroleum and petroleum products merchant wholesalers | 0.4% (2) | 0.9% (2) | 0.0% (0) |
| Motor vehicles, parts and supplies merchant wholesalers | 0.4% (2) | 0.9% (2) | 0.0% (0) |
| Retail florists | 0.2% (1) | 0.0% (0) | 0.5% (1) |
| Repair and maintenance | 0.2% (1) | 0.4% (1) | 0.0% (0) |
Unemployment in Lawrence
- Unemployment by race in 2022
- Unemployment rate for White non-Hispanic residents
- 7.2%Males
- 6.0%Females
- Unemployment rate for other race residents
- 23.2%Males
- 5.2%Females
- Unemployment rate for Hispanic or Latino residents
- 12.4%Males
- 2.9%Females
- Unemployment by race in 2000
- Unemployment rate for White non-Hispanic residents
- 4.0%Males
- 7.3%Females
- Unemployment rate for Black residents
- 25.0%Females
- Unemployment rate for other race residents
- 17.9%Males
- 5.9%Females
- Unemployment rate for Hispanic or Latino residents
- 12.3%Males
- 3.1%Females
Time leaving home to go to work

12:00 a.m. to 4:59 a.m.:
| Lawrence: | 19.6% (75) |
| Michigan: | 5.3% (217,059) |
5:00 a.m. to 5:29 a.m.:
| Lawrence: | 6.6% (26) |
| Michigan: | 3.8% (153,609) |
5:30 a.m. to 5:59 a.m.:
| Lawrence: | 2.6% (10) |
| Michigan: | 5.1% (205,261) |
6:00 a.m. to 6:29 a.m.:
| Lawrence: | 12.6% (49) |
| Michigan: | 8.0% (325,839) |
6:30 a.m. to 6:59 a.m.:
| Lawrence: | 8.7% (33) |
| Michigan: | 9.1% (371,022) |
7:00 a.m. to 7:29 a.m.:
| Lawrence: | 16.2% (62) |
| Michigan: | 12.8% (521,843) |
7:30 a.m. to 7:59 a.m.:
| Lawrence: | 11.6% (45) |
| Michigan: | 12.4% (502,248) |
8:00 a.m. to 8:29 a.m.:
| Lawrence: | 2.2% (9) |
| Michigan: | 10.8% (438,208) |
8:30 a.m. to 8:59 a.m.:
| Lawrence: | 1.4% (5) |
| Michigan: | 5.6% (229,029) |
10:00 a.m. to 10:59 a.m.:
| Lawrence: | 7.7% (30) |
| Michigan: | 3.2% (130,748) |
12:00 p.m. to 3:59 p.m.:
| Lawrence: | 8.6% (33) |
| Michigan: | 8.5% (343,555) |
4:00 p.m. to 11:59 p.m.:
| Lawrence: | 6.4% (25) |
| Michigan: | 7.2% (293,541) |

<5am:
| Lawrence: | 3.9% (17) |
| Michigan: | 3.4% (156,327) |
5:30am:
| Lawrence: | 2.1% (9) |
| Michigan: | 3.1% (139,699) |
6am:
| Lawrence: | 1.4% (6) |
| Michigan: | 4.7% (211,446) |
6:30am:
| Lawrence: | 17.7% (77) |
| Michigan: | 7.7% (349,878) |
7am:
| Lawrence: | 7.4% (32) |
| Michigan: | 9.8% (446,636) |
7:30am:
| Lawrence: | 12.2% (53) |
| Michigan: | 13.2% (597,402) |
8am:
| Lawrence: | 21.6% (94) |
| Michigan: | 15.3% (692,901) |
8:30am:
| Lawrence: | 11.7% (51) |
| Michigan: | 9.9% (448,050) |
9am:
| Lawrence: | 2.1% (9) |
| Michigan: | 5.2% (235,689) |
10am:
| Lawrence: | 1.4% (6) |
| Michigan: | 5.1% (233,210) |
11am:
| Lawrence: | 1.8% (8) |
| Michigan: | 2.2% (98,395) |
4pm:
| Lawrence: | 6.9% (30) |
| Michigan: | 8.6% (391,612) |
>4pm:
| Lawrence: | 7.8% (34) |
| Michigan: | 8.0% (361,157) |

12:00 a.m. to 4:59 a.m. - Males:
| Lawrence: | 32.8% (66) |
| Michigan: | 6.9% (150,486) |
5:00 a.m. to 5:29 a.m. - Males:
| Lawrence: | 11.9% (24) |
| Michigan: | 5.0% (108,967) |
5:30 a.m. to 5:59 a.m. - Males:
| Lawrence: | 3.4% (7) |
| Michigan: | 6.3% (136,770) |
6:00 a.m. to 6:29 a.m. - Males:
| Lawrence: | 21.2% (43) |
| Michigan: | 9.5% (205,411) |
6:30 a.m. to 6:59 a.m. - Males:
| Lawrence: | 9.7% (20) |
| Michigan: | 9.5% (206,578) |
7:00 a.m. to 7:29 a.m. - Males:
| Lawrence: | 6.1% (12) |
| Michigan: | 12.2% (265,994) |
7:30 a.m. to 7:59 a.m. - Males:
| Lawrence: | 2.7% (5) |
| Michigan: | 11.2% (242,506) |
8:00 a.m. to 8:29 a.m. - Males:
| Lawrence: | 0.6% (1) |
| Michigan: | 9.7% (211,431) |
8:30 a.m. to 8:59 a.m. - Males:
| Lawrence: | 2.1% (4) |
| Michigan: | 4.7% (101,817) |
10:00 a.m. to 10:59 a.m. - Males:
| Lawrence: | 5.4% (11) |
| Michigan: | 2.7% (58,514) |
12:00 p.m. to 3:59 p.m. - Males:
| Lawrence: | 4.5% (9) |
| Michigan: | 8.3% (180,250) |
4:00 p.m. to 11:59 p.m. - Males:
| Lawrence: | 8.9% (18) |
| Michigan: | 6.8% (148,394) |

12:00 a.m. to 4:59 a.m. - Females:
| Lawrence: | 5.6% (10) |
| Michigan: | 3.5% (66,573) |
5:00 a.m. to 5:29 a.m. - Females:
| Lawrence: | 2.0% (4) |
| Michigan: | 2.4% (44,642) |
5:30 a.m. to 5:59 a.m. - Females:
| Lawrence: | 1.3% (2) |
| Michigan: | 3.6% (68,491) |
6:00 a.m. to 6:29 a.m. - Females:
| Lawrence: | 4.8% (9) |
| Michigan: | 6.4% (120,428) |
6:30 a.m. to 6:59 a.m. - Females:
| Lawrence: | 7.5% (14) |
| Michigan: | 8.7% (164,444) |
7:00 a.m. to 7:29 a.m. - Females:
| Lawrence: | 28.1% (52) |
| Michigan: | 13.5% (255,849) |
7:30 a.m. to 7:59 a.m. - Females:
| Lawrence: | 23.4% (43) |
| Michigan: | 13.7% (259,742) |
8:00 a.m. to 8:29 a.m. - Females:
| Lawrence: | 4.3% (8) |
| Michigan: | 12.0% (226,777) |
8:30 a.m. to 8:59 a.m. - Females:
| Lawrence: | 2.4% (4) |
| Michigan: | 6.7% (127,212) |
10:00 a.m. to 10:59 a.m. - Females:
| Lawrence: | 7.4% (14) |
| Michigan: | 3.8% (72,234) |
12:00 p.m. to 3:59 p.m. - Females:
| Lawrence: | 14.4% (27) |
| Michigan: | 8.6% (163,305) |
4:00 p.m. to 11:59 p.m. - Females:
| Lawrence: | 3.0% (6) |
| Michigan: | 7.7% (145,147) |
Travel time to work
Percentage of workers working in this county: 62.8%
Number of people working at home: 21 (5.1% of all workers)
Number of people working at home: 21 (5.1% of all workers)

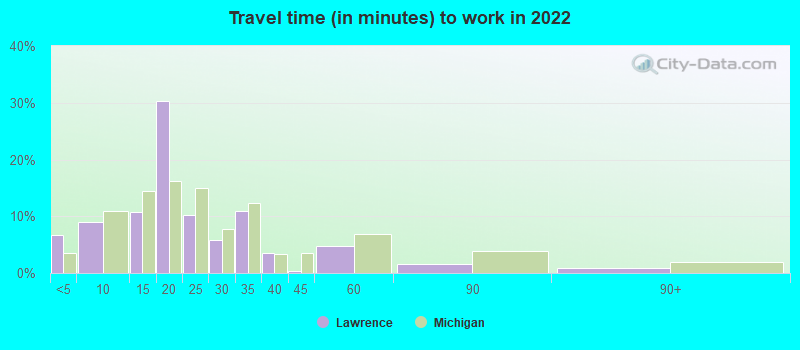

Less than 5 minutes:
| Lawrence: | 6.7% (58) |
| Michigan: | 3.6% (143,584) |
5 to 9 minutes:
| Lawrence: | 9.0% (79) |
| Michigan: | 11.0% (442,434) |
10 to 14 minutes:
| Lawrence: | 10.8% (94) |
| Michigan: | 14.5% (585,037) |
15 to 19 minutes:
| Lawrence: | 30.3% (265) |
| Michigan: | 16.2% (652,002) |
20 to 24 minutes:
| Lawrence: | 10.2% (89) |
| Michigan: | 15.0% (604,197) |
25 to 29 minutes:
| Lawrence: | 5.7% (50) |
| Michigan: | 7.7% (309,175) |
30 to 34 minutes:
| Lawrence: | 11.0% (96) |
| Michigan: | 12.4% (498,080) |
35 to 39 minutes:
| Lawrence: | 3.6% (31) |
| Michigan: | 3.4% (136,295) |
40 to 44 minutes:
| Lawrence: | 0.4% (3) |
| Michigan: | 3.6% (144,954) |
45 to 59 minutes:
| Lawrence: | 4.8% (42) |
| Michigan: | 6.9% (278,387) |
60 to 89 minutes:
| Lawrence: | 1.5% (13) |
| Michigan: | 4.0% (159,456) |
90 or more minutes:
| Lawrence: | 0.9% (8) |
| Michigan: | 1.9% (76,015) |


Less than 5 minutes:
| Lawrence: | 8.0% (35) |
| Michigan: | 3.5% (158,315) |
5 to 9 minutes:
| Lawrence: | 11.3% (49) |
| Michigan: | 11.2% (507,653) |
10 to 14 minutes:
| Lawrence: | 7.8% (34) |
| Michigan: | 15.0% (681,990) |
15 to 19 minutes:
| Lawrence: | 13.6% (59) |
| Michigan: | 15.6% (708,036) |
20 to 24 minutes:
| Lawrence: | 10.8% (47) |
| Michigan: | 14.9% (675,865) |
25 to 29 minutes:
| Lawrence: | 3.9% (17) |
| Michigan: | 6.4% (291,938) |
30 to 34 minutes:
| Lawrence: | 16.6% (72) |
| Michigan: | 12.0% (546,870) |
35 to 39 minutes:
| Lawrence: | 5.1% (22) |
| Michigan: | 2.8% (126,158) |
40 to 44 minutes:
| Lawrence: | 1.8% (8) |
| Michigan: | 3.3% (147,930) |
45 to 59 minutes:
| Lawrence: | 7.6% (33) |
| Michigan: | 6.7% (304,785) |
60 to 89 minutes:
| Lawrence: | 7.8% (34) |
| Michigan: | 3.8% (171,403) |
90 or more minutes:
| Lawrence: | 3.7% (16) |
| Michigan: | 2.0% (91,664) |

Less than 5 minutes - Males:
| Lawrence: | 9.5% (28) |
| Michigan: | 3.5% (75,744) |
5 to 9 minutes - Males:
| Lawrence: | 12.7% (37) |
| Michigan: | 9.5% (205,370) |
10 to 14 minutes - Males:
| Lawrence: | 8.9% (26) |
| Michigan: | 13.2% (284,763) |
15 to 19 minutes - Males:
| Lawrence: | 21.6% (64) |
| Michigan: | 15.9% (341,778) |
20 to 24 minutes - Males:
| Lawrence: | 16.8% (50) |
| Michigan: | 14.5% (312,847) |
25 to 29 minutes - Males:
| Lawrence: | 11.9% (35) |
| Michigan: | 7.8% (167,430) |
30 to 34 minutes - Males:
| Lawrence: | 7.1% (21) |
| Michigan: | 12.8% (274,470) |
35 to 39 minutes - Males:
| Lawrence: | 1.3% (4) |
| Michigan: | 3.6% (76,783) |
40 to 44 minutes - Males:
| Lawrence: | 0.9% (3) |
| Michigan: | 3.9% (84,238) |
60 to 89 minutes - Males:
| Lawrence: | 3.2% (9) |
| Michigan: | 4.8% (103,060) |
90 or more minutes - Males:
| Lawrence: | 2.9% (8) |
| Michigan: | 2.4% (51,962) |

Less than 5 minutes - Females:
| Lawrence: | 4.8% (29) |
| Michigan: | 3.6% (67,840) |
5 to 9 minutes - Females:
| Lawrence: | 6.7% (40) |
| Michigan: | 12.6% (237,064) |
10 to 14 minutes - Females:
| Lawrence: | 9.8% (59) |
| Michigan: | 16.0% (300,274) |
15 to 19 minutes - Females:
| Lawrence: | 28.2% (168) |
| Michigan: | 16.5% (310,224) |
20 to 24 minutes - Females:
| Lawrence: | 6.6% (39) |
| Michigan: | 15.5% (291,350) |
25 to 29 minutes - Females:
| Lawrence: | 0.4% (3) |
| Michigan: | 7.5% (141,745) |
30 to 34 minutes - Females:
| Lawrence: | 16.7% (100) |
| Michigan: | 11.9% (223,610) |
35 to 39 minutes - Females:
| Lawrence: | 6.9% (41) |
| Michigan: | 3.2% (59,512) |
45 to 59 minutes - Females:
| Lawrence: | 6.7% (40) |
| Michigan: | 5.6% (106,013) |
60 to 89 minutes - Females:
| Lawrence: | 1.7% (10) |
| Michigan: | 3.0% (56,396) |
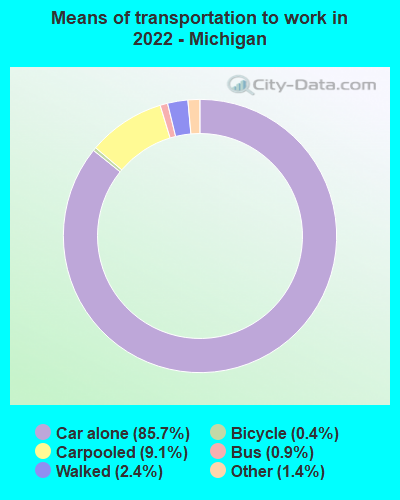
Means of transportation to work
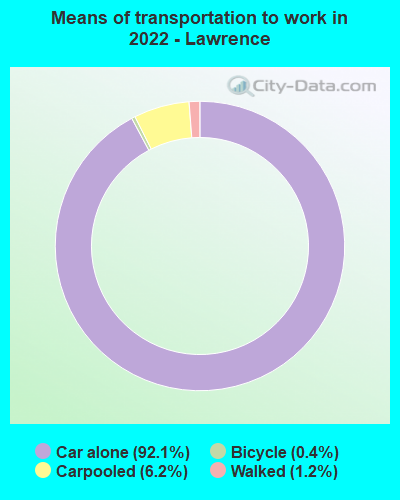
Drove car alone:
| Lawrence: | 92.1% (859) |
| Michigan: | 85.7% (1,595,046) |
Carpooled:
| Lawrence: | 6.2% (58) |
| Michigan: | 9.1% (187,180) |
Bicycle:
| Lawrence: | 0.4% (4) |
| Michigan: | 0.4% (5,746) |
Walked:
| Lawrence: | 1.2% (11) |
| Michigan: | 2.4% (44,504) |


Drove car alone:
| Lawrence: | 74.7% (325) |
| Michigan: | 83.2% (3,776,535) |
Carpooled:
| Lawrence: | 18.4% (80) |
| Michigan: | 9.7% (440,606) |
Bicycle:
| Lawrence: | 0.5% (2) |
| Michigan: | 0.2% (10,034) |
Walked:
| Lawrence: | 4.4% (19) |
| Michigan: | 2.2% (101,506) |


Drove car alone - Males:
| Lawrence: | 89.1% (299) |
| Michigan: | 86.5% (1,595,046) |
Carpooled - Males:
| Lawrence: | 7.0% (23) |
| Michigan: | 8.4% (187,180) |
Bicycle - Males:
| Lawrence: | 1.2% (4) |
| Michigan: | 0.5% (5,746) |
Walked - Males:
| Lawrence: | 2.7% (9) |
| Michigan: | 2.4% (44,504) |

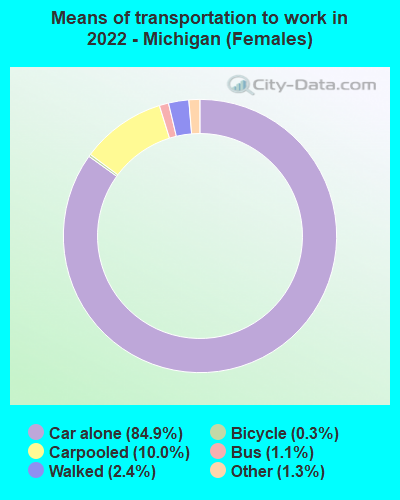
Drove car alone - Females:
| Lawrence: | 93.8% (561) |
| Michigan: | 84.9% (1,595,046) |
Carpooled - Females:
| Lawrence: | 5.8% (35) |
| Michigan: | 10.0% (187,180) |
Walked - Females:
| Lawrence: | 0.3% (2) |
| Michigan: | 2.4% (44,504) |
Private vehicle occupancy

Drove alone:
| Lawrence: | 85.6% (313) |
| Michigan: | 90.4% (3,484,723) |
In 2 person carpool:
| Lawrence: | 12.0% (44) |
| Michigan: | 7.3% (282,230) |
In 3 person carpool:
| Lawrence: | 0.3% (1) |
| Michigan: | 1.4% (52,118) |
In 5-6 person carpool:
| Lawrence: | 2.1% (8) |
| Michigan: | 0.3% (10,433) |

Drove alone:
| Lawrence: | 80.2% (325) |
| Michigan: | 89.6% (3,776,535) |
In 2 person carpool:
| Lawrence: | 14.8% (60) |
| Michigan: | 8.5% (358,473) |
In 3 person carpool:
| Lawrence: | 3.0% (12) |
| Michigan: | 1.3% (53,301) |
In 5-6 person carpool:
| Lawrence: | 0.7% (3) |
| Michigan: | 0.2% (8,051) |
In 7+ person carpool:
| Lawrence: | 1.2% (5) |
| Michigan: | 0.1% (4,041) |
Class of workers

Employee of private company:
| Lawrence: | 66.4% (282) |
| Michigan: | 69.8% (3,350,300) |
Self-employed in own incorporated business:
| Lawrence: | 6.4% (27) |
| Michigan: | 3.5% (168,846) |
Private not-for-profit wage and salary workers:
| Lawrence: | 8.0% (34) |
| Michigan: | 9.8% (468,535) |
Local government workers:
| Lawrence: | 9.6% (41) |
| Michigan: | 6.3% (300,493) |
State government workers:
| Lawrence: | 3.5% (15) |
| Michigan: | 3.6% (171,998) |
Federal government workers:
| Lawrence: | 3.8% (16) |
| Michigan: | 1.6% (76,540) |
Self-employed workers in own not incorporated business:
| Lawrence: | 2.4% (10) |
| Michigan: | 5.3% (256,382) |

Employee of private company:
| Lawrence: | 73.8% (329) |
| Michigan: | 71.9% (3,336,174) |
Self-employed in own incorporated business:
| Lawrence: | 0.4% (2) |
| Michigan: | 3.1% (145,931) |
Private not-for-profit wage and salary workers:
| Lawrence: | 9.2% (41) |
| Michigan: | 8.0% (370,593) |
Local government workers:
| Lawrence: | 4.7% (21) |
| Michigan: | 6.2% (285,684) |
State government workers:
| Lawrence: | 2.5% (11) |
| Michigan: | 3.7% (170,984) |
Federal government workers:
| Lawrence: | 2.5% (11) |
| Michigan: | 1.5% (71,533) |
Self-employed workers in own not incorporated business:
| Lawrence: | 7.0% (31) |
| Michigan: | 5.2% (243,300) |

Employee of private company - Males:
| Lawrence: | 70.7% (157) |
| Michigan: | 74.4% (1,882,423) |
Self-employed in own incorporated business - Males:
| Lawrence: | 8.1% (18) |
| Michigan: | 4.6% (115,825) |
Private not-for-profit wage and salary workers - Males:
| Lawrence: | 6.8% (15) |
| Michigan: | 6.0% (151,243) |
Local government workers - Males:
| Lawrence: | 5.0% (11) |
| Michigan: | 4.4% (111,027) |
State government workers - Males:
| Lawrence: | 2.3% (5) |
| Michigan: | 2.9% (74,018) |
Federal government workers - Males:
| Lawrence: | 5.4% (12) |
| Michigan: | 1.6% (39,580) |
Self-employed workers in own not incorporated business - Males:
| Lawrence: | 1.8% (4) |
| Michigan: | 6.0% (152,865) |

Employee of private company - Females:
| Lawrence: | 61.6% (125) |
| Michigan: | 64.7% (1,467,877) |
Self-employed in own incorporated business - Females:
| Lawrence: | 4.4% (9) |
| Michigan: | 2.3% (53,021) |
Private not-for-profit wage and salary workers - Females:
| Lawrence: | 9.4% (19) |
| Michigan: | 14.0% (317,292) |
Local government workers - Females:
| Lawrence: | 14.8% (30) |
| Michigan: | 8.3% (189,466) |
State government workers - Females:
| Lawrence: | 4.9% (10) |
| Michigan: | 4.3% (97,980) |
Federal government workers - Females:
| Lawrence: | 2.0% (4) |
| Michigan: | 1.6% (36,960) |
Self-employed workers in own not incorporated business - Females:
| Lawrence: | 3.0% (6) |
| Michigan: | 4.6% (103,517) |