Work and Jobs in Leacock-Leola-Bareville, Pennsylvania (PA) Detailed Stats
Occupations, Industries, Unemployment, Workers, Commute

Discuss Leacock-Leola-Bareville, Pennsylvania work on our local forum with over 2,400,000 registered users
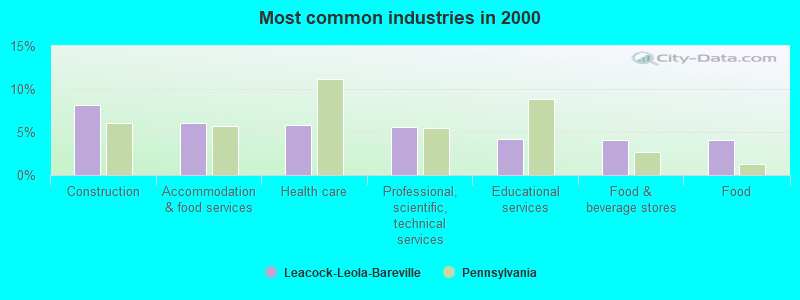
The most common industries in Leacock-Leola-Bareville are: Construction (8.1% of civilian employees), Accommodation & food services (6.0% of civilian employees), Health care (5.8% of civilian employees). 71.2% of workers are employees of private companies, which is 2.1% greater than the rate of 69.7% across the entire state of Pennsylvania.
Most common industries
Most common industries | |||
|---|---|---|---|
Industry | All | Males | Females |
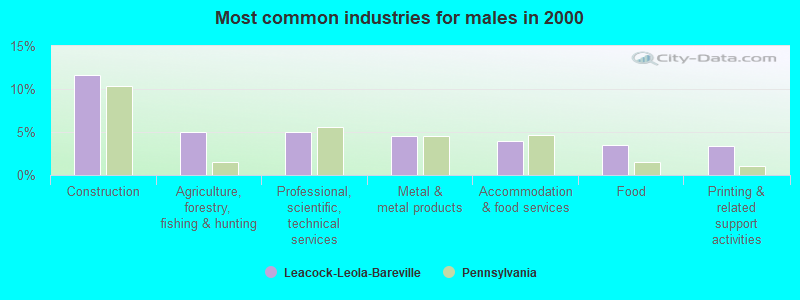
| Construction | 8.1% (278) | 11.6% (221) | 3.7% (57) |
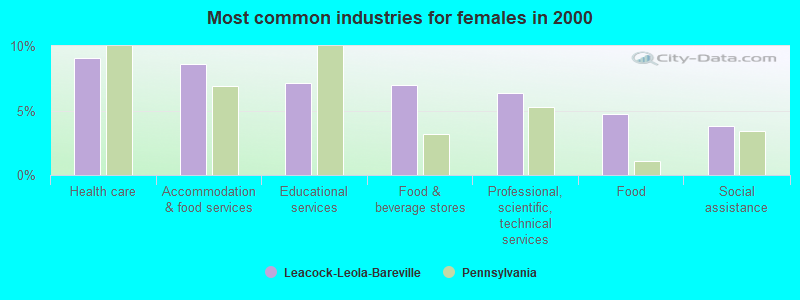
| Accommodation and food services | 6.0% (207) | 4.0% (76) | 8.6% (131) |
| Health care | 5.8% (198) | 3.2% (60) | 9.1% (138) |
| Professional, scientific, and technical services | 5.6% (192) | 5.0% (95) | 6.4% (97) |
| Educational services | 4.2% (145) | 1.9% (37) | 7.1% (108) |
| Food and beverage stores | 4.1% (140) | 1.8% (34) | 7.0% (106) |
| Food | 4.0% (138) | 3.5% (66) | 4.7% (72) |
| Agriculture, forestry, fishing and hunting | 3.8% (129) | 5.0% (95) | 2.2% (34) |
| Metal and metal products | 3.5% (121) | 4.6% (87) | 2.2% (34) |
| Plastics and rubber products | 2.7% (91) | 2.8% (53) | 2.5% (38) |
| Repair and maintenance | 2.4% (81) | 3.3% (63) | 1.2% (18) |
| Public administration | 2.3% (79) | 1.7% (33) | 3.0% (46) |
| Printing and related support activities | 2.2% (77) | 3.4% (64) | 0.9% (13) |
| Finance and insurance | 2.1% (72) | 1.4% (27) | 3.0% (45) |
| Miscellaneous manufacturing | 1.9% (64) | 2.5% (48) | 1.1% (16) |
| Transportation equipment | 1.8% (61) | 3.0% (57) | 0.3% (4) |
| Social assistance | 1.7% (58) | 0.0% (0) | 3.8% (58) |
| Wood products | 1.7% (58) | 2.6% (49) | 0.6% (9) |
| Apparel | 1.7% (57) | 1.1% (20) | 2.4% (37) |
| Administrative and support and waste management services | 1.6% (55) | 1.8% (34) | 1.4% (21) |
| Personal and laundry services | 1.5% (53) | 1.1% (20) | 2.2% (33) |
| Machinery | 1.5% (52) | 1.4% (26) | 1.7% (26) |
| Religious, grantmaking, civic, professional, and similar organizations | 1.5% (52) | 0.7% (14) | 2.5% (38) |
| Department and other general merchandise stores | 1.5% (51) | 1.1% (20) | 2.0% (31) |
| Real estate and rental and leasing | 1.4% (48) | 1.5% (28) | 1.3% (20) |
| U. S. Postal service | 1.4% (47) | 1.3% (24) | 1.5% (23) |
| Used merchandise, gift, novelty, and souvenir, and other miscellaneous stores | 1.3% (44) | 0.4% (8) | 2.4% (36) |
| Groceries and related products merchant wholesalers | 1.3% (43) | 1.3% (24) | 1.2% (19) |
| Furniture and related product manufacturing | 1.3% (43) | 2.1% (39) | 0.3% (4) |
| Motor vehicle and parts dealers | 1.2% (42) | 1.9% (36) | 0.4% (6) |
| Sporting goods, camera, and hobby and toy stores | 1.2% (42) | 1.2% (23) | 1.2% (19) |
| Clothing and accessories, including shoe, stores | 1.2% (40) | 0.4% (7) | 2.2% (33) |
| Truck transportation | 1.1% (39) | 1.6% (31) | 0.5% (8) |
| Other transportation, and support activities, and couriers | 1.1% (37) | 1.9% (37) | 0.0% (0) |
| Arts, entertainment, and recreation | 1.0% (34) | 1.6% (30) | 0.3% (4) |
| Building material and garden equipment and supplies dealers | 1.0% (33) | 1.4% (27) | 0.4% (6) |
| Furniture and home furnishings, and household appliance stores | 0.9% (32) | 1.3% (25) | 0.5% (7) |
| Warehousing and storage | 0.9% (31) | 1.3% (25) | 0.4% (6) |
| Motor vehicles, parts and supplies merchant wholesalers | 0.9% (30) | 1.6% (30) | 0.0% (0) |
| Computer and electronic products | 0.8% (28) | 1.5% (28) | 0.0% (0) |
| Miscellaneous nondurable goods merchant wholesalers | 0.8% (28) | 1.2% (23) | 0.3% (5) |
| Publishing, and motion picture and sound recording industries | 0.8% (26) | 1.0% (19) | 0.5% (7) |
| Nonmetallic mineral products | 0.7% (24) | 0.8% (15) | 0.6% (9) |
| Chemicals | 0.7% (23) | 1.0% (19) | 0.3% (4) |
| Electrical equipment, appliances, and components | 0.6% (19) | 1.0% (19) | 0.0% (0) |
| Textile mills and textile products | 0.5% (18) | 0.0% (0) | 1.2% (18) |
| Paper | 0.4% (15) | 0.4% (8) | 0.5% (7) |
| Broadcasting and telecommunications | 0.4% (15) | 0.3% (6) | 0.6% (9) |
| Farm supplies merchant wholesalers | 0.4% (14) | 0.5% (9) | 0.3% (5) |
| Pharmacies and drug stores | 0.4% (14) | 0.0% (0) | 0.9% (14) |
| Other direct selling establishments | 0.4% (12) | 0.0% (0) | 0.8% (12) |
| Machinery, equipment, and supplies merchant wholesalers | 0.4% (12) | 0.6% (12) | 0.0% (0) |
| Radio, TV, and computer stores | 0.3% (10) | 0.5% (10) | 0.0% (0) |
| Health and personal care, except drug, stores | 0.3% (9) | 0.5% (9) | 0.0% (0) |
| Jewelry, luggage, and leather goods stores | 0.2% (8) | 0.0% (0) | 0.5% (8) |
| Sewing, needlework, and piece goods stores | 0.2% (8) | 0.0% (0) | 0.5% (8) |
| Management of companies and enterprises | 0.2% (8) | 0.4% (8) | 0.0% (0) |
| Farm product raw materials merchant wholesalers | 0.2% (7) | 0.4% (7) | 0.0% (0) |
| Professional and commercial equipment and supplies merchant wholesalers | 0.2% (7) | 0.4% (7) | 0.0% (0) |
| Air transportation | 0.2% (6) | 0.0% (0) | 0.4% (6) |
| Utilities | 0.2% (6) | 0.3% (6) | 0.0% (0) |
| Lumber and other construction materials merchant wholesalers | 0.1% (5) | 0.0% (0) | 0.3% (5) |
| Leather and allied products | 0.1% (4) | 0.2% (4) | 0.0% (0) |
| Apparel, fabrics, and notions merchant wholesalers | 0.1% (4) | 0.0% (0) | 0.3% (4) |
Unemployment in Leacock-Leola-Bareville
- Unemployment by race in 2000
- Unemployment rate for White non-Hispanic residents
- 3.2%Males
- 2.4%Females
- Unemployment rate for two or more race residents
- 20.0%Females
- Unemployment rate for Hispanic or Latino residents
- 12.9%Females
Time leaving home to go to work

<5am:
| Leacock-Leola-Bareville: | 3.0% (98) |
| Pennsylvania: | 3.1% (172,304) |
5:30am:
| Leacock-Leola-Bareville: | 4.0% (132) |
| Pennsylvania: | 2.7% (150,168) |
6am:
| Leacock-Leola-Bareville: | 6.0% (198) |
| Pennsylvania: | 4.4% (245,004) |
6:30am:
| Leacock-Leola-Bareville: | 10.1% (333) |
| Pennsylvania: | 8.6% (478,636) |
7am:
| Leacock-Leola-Bareville: | 9.0% (295) |
| Pennsylvania: | 10.8% (599,808) |
7:30am:
| Leacock-Leola-Bareville: | 10.7% (354) |
| Pennsylvania: | 13.7% (759,372) |
8am:
| Leacock-Leola-Bareville: | 14.6% (482) |
| Pennsylvania: | 14.9% (826,968) |
8:30am:
| Leacock-Leola-Bareville: | 9.7% (321) |
| Pennsylvania: | 10.6% (588,440) |
9am:
| Leacock-Leola-Bareville: | 5.7% (189) |
| Pennsylvania: | 5.5% (304,765) |
10am:
| Leacock-Leola-Bareville: | 3.4% (113) |
| Pennsylvania: | 5.1% (280,812) |
11am:
| Leacock-Leola-Bareville: | 1.5% (51) |
| Pennsylvania: | 2.1% (114,676) |
12pm:
| Leacock-Leola-Bareville: | 1.5% (50) |
| Pennsylvania: | 1.0% (57,867) |
4pm:
| Leacock-Leola-Bareville: | 9.5% (313) |
| Pennsylvania: | 7.3% (404,775) |
>4pm:
| Leacock-Leola-Bareville: | 5.3% (176) |
| Pennsylvania: | 7.3% (408,070) |
Travel time to work
Daytime population change due to commuting: +1,500 (+22.6%)
Workers who live and work in this place: 803 (24.4%)
Workers who live and work in this place: 803 (24.4%)


Less than 5 minutes:
| Leacock-Leola-Bareville: | 5.6% (186) |
| Pennsylvania: | 3.5% (196,492) |
5 to 9 minutes:
| Leacock-Leola-Bareville: | 14.7% (483) |
| Pennsylvania: | 11.1% (615,919) |
10 to 14 minutes:
| Leacock-Leola-Bareville: | 13.1% (433) |
| Pennsylvania: | 14.9% (825,199) |
15 to 19 minutes:
| Leacock-Leola-Bareville: | 23.6% (777) |
| Pennsylvania: | 15.0% (836,006) |
20 to 24 minutes:
| Leacock-Leola-Bareville: | 16.5% (542) |
| Pennsylvania: | 14.1% (782,790) |
25 to 29 minutes:
| Leacock-Leola-Bareville: | 5.0% (166) |
| Pennsylvania: | 5.9% (327,459) |
30 to 34 minutes:
| Leacock-Leola-Bareville: | 7.3% (242) |
| Pennsylvania: | 11.8% (655,811) |
35 to 39 minutes:
| Leacock-Leola-Bareville: | 1.8% (58) |
| Pennsylvania: | 2.7% (148,906) |
40 to 44 minutes:
| Leacock-Leola-Bareville: | 0.7% (24) |
| Pennsylvania: | 3.4% (187,483) |
45 to 59 minutes:
| Leacock-Leola-Bareville: | 2.4% (80) |
| Pennsylvania: | 7.3% (407,516) |
60 to 89 minutes:
| Leacock-Leola-Bareville: | 1.1% (35) |
| Pennsylvania: | 4.8% (265,759) |
90 or more minutes:
| Leacock-Leola-Bareville: | 2.4% (79) |
| Pennsylvania: | 2.6% (142,325) |
Means of transportation to work


Drove car alone:
| Leacock-Leola-Bareville: | 76.6% (2,522) |
| Pennsylvania: | 76.5% (4,247,836) |
Carpooled:
| Leacock-Leola-Bareville: | 9.0% (297) |
| Pennsylvania: | 10.4% (577,364) |
Bus or trolley bus:
| Leacock-Leola-Bareville: | 0.9% (30) |
| Pennsylvania: | 3.6% (198,036) |
Bicycle:
| Leacock-Leola-Bareville: | 1.5% (49) |
| Pennsylvania: | 0.3% (14,001) |
Walked:
| Leacock-Leola-Bareville: | 5.8% (192) |
| Pennsylvania: | 4.1% (229,725) |
Other means:
| Leacock-Leola-Bareville: | 0.5% (15) |
| Pennsylvania: | 0.5% (29,805) |
Private vehicle occupancy

Drove alone:
| Leacock-Leola-Bareville: | 89.5% (2,522) |
| Pennsylvania: | 88.0% (4,247,836) |
In 2 person carpool:
| Leacock-Leola-Bareville: | 7.4% (210) |
| Pennsylvania: | 9.7% (470,174) |
In 3 person carpool:
| Leacock-Leola-Bareville: | 1.6% (44) |
| Pennsylvania: | 1.4% (67,610) |
In 4 person carpool:
| Leacock-Leola-Bareville: | 0.6% (18) |
| Pennsylvania: | 0.5% (22,718) |
In 5-6 person carpool:
| Leacock-Leola-Bareville: | 0.9% (25) |
| Pennsylvania: | 0.2% (9,833) |
Class of workers
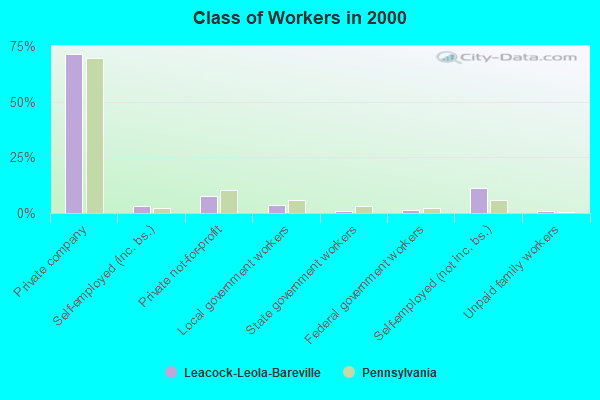
Employee of private company:
| Leacock-Leola-Bareville: | 71.2% (2,438) |
| Pennsylvania: | 69.7% (3,942,119) |
Self-employed in own incorporated business:
| Leacock-Leola-Bareville: | 3.2% (111) |
| Pennsylvania: | 2.4% (134,871) |
Private not-for-profit wage and salary workers:
| Leacock-Leola-Bareville: | 7.4% (255) |
| Pennsylvania: | 10.3% (580,382) |
Local government workers:
| Leacock-Leola-Bareville: | 3.5% (119) |
| Pennsylvania: | 5.8% (326,222) |
State government workers:
| Leacock-Leola-Bareville: | 1.0% (34) |
| Pennsylvania: | 3.2% (182,232) |
Federal government workers:
| Leacock-Leola-Bareville: | 1.5% (52) |
| Pennsylvania: | 2.3% (130,634) |
Self-employed workers in own not incorporated business:
| Leacock-Leola-Bareville: | 11.4% (389) |
| Pennsylvania: | 6.0% (339,631) |
Unpaid family workers:
| Leacock-Leola-Bareville: | 0.8% (26) |
| Pennsylvania: | 0.3% (17,409) |

Employee of private company - Males:
| Leacock-Leola-Bareville: | 74.4% (1,416) |
| Pennsylvania: | 72.1% (2,157,103) |
Self-employed in own incorporated business - Males:
| Leacock-Leola-Bareville: | 3.6% (69) |
| Pennsylvania: | 3.4% (103,200) |
Private not-for-profit wage and salary workers - Males:
| Leacock-Leola-Bareville: | 2.9% (55) |
| Pennsylvania: | 6.3% (187,590) |
Local government workers - Males:
| Leacock-Leola-Bareville: | 2.1% (39) |
| Pennsylvania: | 4.8% (143,607) |
State government workers - Males:
| Leacock-Leola-Bareville: | 1.2% (22) |
| Pennsylvania: | 3.1% (91,922) |
Federal government workers - Males:
| Leacock-Leola-Bareville: | 1.5% (29) |
| Pennsylvania: | 2.5% (73,391) |
Self-employed workers in own not incorporated business - Males:
| Leacock-Leola-Bareville: | 14.3% (272) |
| Pennsylvania: | 7.6% (228,618) |

Employee of private company - Females:
| Leacock-Leola-Bareville: | 67.1% (1,022) |
| Pennsylvania: | 67.1% (1,785,016) |
Self-employed in own incorporated business - Females:
| Leacock-Leola-Bareville: | 2.8% (42) |
| Pennsylvania: | 1.2% (31,671) |
Private not-for-profit wage and salary workers - Females:
| Leacock-Leola-Bareville: | 13.1% (200) |
| Pennsylvania: | 14.8% (392,792) |
Local government workers - Females:
| Leacock-Leola-Bareville: | 5.3% (80) |
| Pennsylvania: | 6.9% (182,615) |
State government workers - Females:
| Leacock-Leola-Bareville: | 0.8% (12) |
| Pennsylvania: | 3.4% (90,310) |
Federal government workers - Females:
| Leacock-Leola-Bareville: | 1.5% (23) |
| Pennsylvania: | 2.2% (57,243) |
Self-employed workers in own not incorporated business - Females:
| Leacock-Leola-Bareville: | 7.7% (117) |
| Pennsylvania: | 4.2% (111,013) |
Unpaid family workers - Females:
| Leacock-Leola-Bareville: | 1.7% (26) |
| Pennsylvania: | 0.4% (10,060) |