Work and Jobs in Madison, Connecticut (CT) Detailed Stats
Occupations, Industries, Unemployment, Workers, Commute

Discuss Madison, Connecticut work on our local forum with over 2,400,000 registered users
Latest news about work in Madison, CT collected exclusively by city-data.com from local newspapers, TV, and radio stations
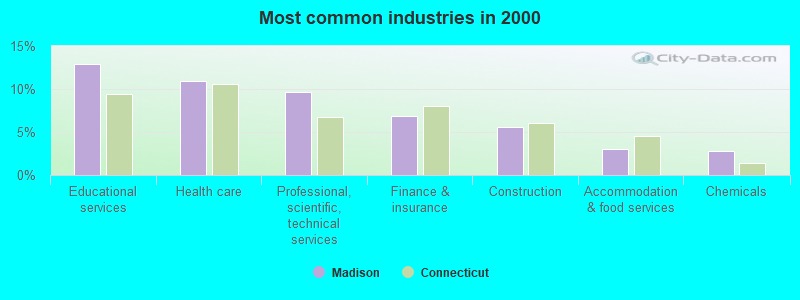
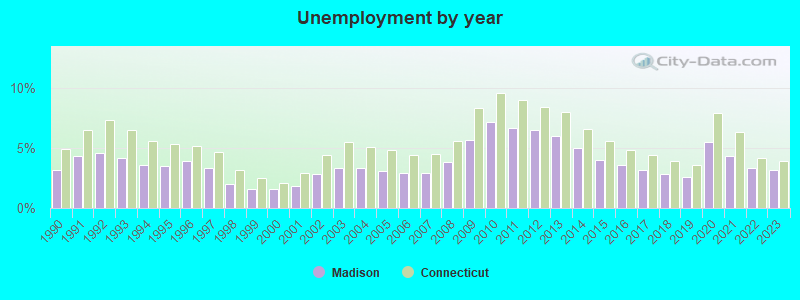
The unemployment rate in 2023 in Madison, CT was 3.2%, which was 21.9% less than the unemployment rate of 3.9% across the entire state of Connecticut. Compared to the unemployment rate of 6.0% in 2013, this represents a decrease of 87.5%. The most common industries in Madison are: Educational services (12.9% of civilian employees), Health care (11.0% of civilian employees), Professional, scientific, technical services (9.6% of civilian employees). 61.1% of workers are employees of private companies, which is 12.3% less than the rate of 68.6% across the entire state of Connecticut.
Most common industries
Most common industries | |||
|---|---|---|---|
Industry | All | Males | Females |
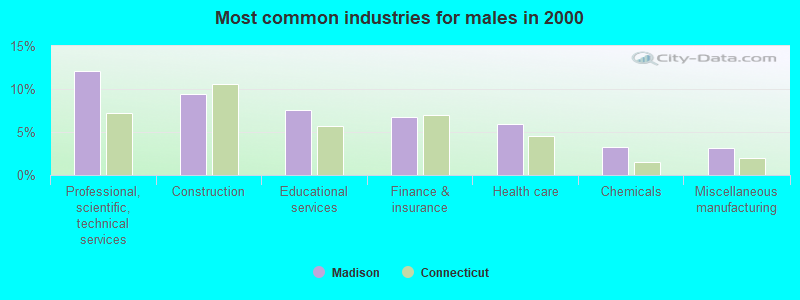
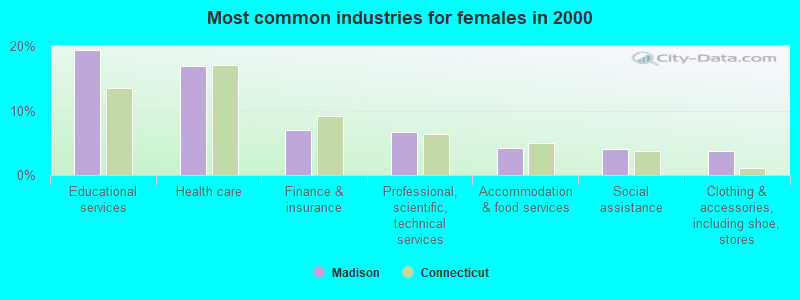
| Educational services | 12.9% (1,155) | 7.5% (365) | 19.4% (790) |
| Health care | 11.0% (980) | 6.0% (290) | 16.9% (690) |
| Professional, scientific, and technical services | 9.6% (858) | 12.1% (587) | 6.7% (271) |
| Finance and insurance | 6.8% (611) | 6.7% (328) | 7.0% (283) |
| Construction | 5.6% (500) | 9.4% (456) | 1.1% (44) |
| Accommodation and food services | 3.1% (273) | 2.1% (100) | 4.2% (173) |
| Chemicals | 2.7% (245) | 3.2% (156) | 2.2% (89) |
| Administrative and support and waste management services | 2.4% (210) | 2.7% (133) | 1.9% (77) |
| Broadcasting and telecommunications | 2.3% (206) | 2.3% (113) | 2.3% (93) |
| Miscellaneous manufacturing | 2.2% (199) | 3.2% (155) | 1.1% (44) |
| Food and beverage stores | 2.1% (190) | 2.2% (107) | 2.0% (83) |
| Public administration | 2.1% (187) | 2.3% (111) | 1.9% (76) |
| Social assistance | 2.0% (178) | 0.3% (17) | 4.0% (161) |
| Real estate and rental and leasing | 1.9% (170) | 1.3% (61) | 2.7% (109) |
| Transportation equipment | 1.9% (166) | 2.7% (133) | 0.8% (33) |
| Computer and electronic products | 1.8% (162) | 2.5% (121) | 1.0% (41) |
| Clothing and accessories, including shoe, stores | 1.8% (159) | 0.2% (9) | 3.7% (150) |
| Motor vehicle and parts dealers | 1.3% (116) | 1.7% (85) | 0.8% (31) |
| Pharmacies and drug stores | 1.3% (115) | 1.7% (83) | 0.8% (32) |
| Metal and metal products | 1.3% (115) | 2.0% (99) | 0.4% (16) |
| Used merchandise, gift, novelty, and souvenir, and other miscellaneous stores | 1.2% (111) | 0.6% (28) | 2.0% (83) |
| Machinery | 1.2% (110) | 1.7% (82) | 0.7% (28) |
| Arts, entertainment, and recreation | 1.2% (108) | 0.8% (40) | 1.7% (68) |
| Personal and laundry services | 1.1% (102) | 0.9% (42) | 1.5% (60) |
| Utilities | 1.1% (95) | 1.5% (73) | 0.5% (22) |
| Publishing, and motion picture and sound recording industries | 1.0% (93) | 1.4% (68) | 0.6% (25) |
| Repair and maintenance | 1.0% (87) | 1.5% (74) | 0.3% (13) |
| Electrical equipment, appliances, and components | 1.0% (86) | 1.2% (56) | 0.7% (30) |
| Printing and related support activities | 0.8% (68) | 1.0% (50) | 0.4% (18) |
| Religious, grantmaking, civic, professional, and similar organizations | 0.7% (66) | 0.9% (43) | 0.6% (23) |
| Radio, TV, and computer stores | 0.7% (65) | 0.8% (37) | 0.7% (28) |
| Department and other general merchandise stores | 0.7% (61) | 0.5% (26) | 0.9% (35) |
| Drugs, sundries, and chemical and allied products merchant wholesalers | 0.7% (60) | 0.4% (21) | 1.0% (39) |
| Professional and commercial equipment and supplies merchant wholesalers | 0.7% (60) | 0.9% (44) | 0.4% (16) |
| Data processing, libraries, and other information services | 0.7% (59) | 0.8% (38) | 0.5% (21) |
| Building material and garden equipment and supplies dealers | 0.6% (55) | 1.0% (49) | 0.1% (6) |
| Other transportation, and support activities, and couriers | 0.6% (51) | 0.6% (30) | 0.5% (21) |
| Miscellaneous durable goods merchant wholesalers | 0.5% (47) | 0.7% (34) | 0.3% (13) |
| Air transportation | 0.5% (46) | 0.7% (32) | 0.3% (14) |
| Miscellaneous nondurable goods merchant wholesalers | 0.5% (44) | 0.6% (30) | 0.3% (14) |
| Food | 0.5% (43) | 0.6% (31) | 0.3% (12) |
| U. S. Postal service | 0.4% (36) | 0.5% (22) | 0.3% (14) |
| Electrical and electronic goods merchant wholesalers | 0.4% (34) | 0.6% (28) | 0.1% (6) |
| Private households | 0.4% (32) | 0.2% (10) | 0.5% (22) |
| Furniture and home furnishings, and household appliance stores | 0.3% (30) | 0.3% (15) | 0.4% (15) |
| Other direct selling establishments | 0.3% (29) | 0.3% (16) | 0.3% (13) |
| Paper | 0.3% (29) | 0.6% (29) | 0.0% (0) |
| Sporting goods, camera, and hobby and toy stores | 0.3% (29) | 0.3% (17) | 0.3% (12) |
| Office supplies and stationery stores | 0.3% (28) | 0.4% (21) | 0.2% (7) |
| Petroleum and petroleum products merchant wholesalers | 0.3% (26) | 0.5% (26) | 0.0% (0) |
| Machinery, equipment, and supplies merchant wholesalers | 0.3% (26) | 0.3% (16) | 0.2% (10) |
| Jewelry, luggage, and leather goods stores | 0.3% (25) | 0.2% (11) | 0.3% (14) |
| Groceries and related products merchant wholesalers | 0.3% (25) | 0.5% (25) | 0.0% (0) |
| Management of companies and enterprises | 0.3% (23) | 0.3% (15) | 0.2% (8) |
| Electronic shopping and mail-order houses | 0.2% (22) | 0.2% (8) | 0.3% (14) |
| Truck transportation | 0.2% (20) | 0.4% (20) | 0.0% (0) |
| Rail transportation | 0.2% (20) | 0.4% (20) | 0.0% (0) |
| Lumber and other construction materials merchant wholesalers | 0.2% (19) | 0.4% (19) | 0.0% (0) |
| Agriculture, forestry, fishing and hunting | 0.2% (16) | 0.2% (8) | 0.2% (8) |
| Apparel | 0.2% (16) | 0.2% (8) | 0.2% (8) |
| Music stores | 0.2% (14) | 0.3% (14) | 0.0% (0) |
| Hardware, plumbing and heating equipment, and supplies merchant wholesalers | 0.1% (12) | 0.1% (6) | 0.1% (6) |
| Mining, quarrying, and oil and gas extraction | 0.1% (12) | 0.2% (12) | 0.0% (0) |
| Apparel, fabrics, and notions merchant wholesalers | 0.1% (10) | 0.2% (10) | 0.0% (0) |
| Recyclable material merchant wholesalers | 0.1% (9) | 0.0% (0) | 0.2% (9) |
| Paper and paper products merchant wholesalers | 0.1% (8) | 0.2% (8) | 0.0% (0) |
| Vending machine operators | 0.1% (8) | 0.2% (8) | 0.0% (0) |
| Fuel dealers | 0.1% (8) | 0.2% (8) | 0.0% (0) |
| Plastics and rubber products | 0.1% (8) | 0.2% (8) | 0.0% (0) |
| Wood products | 0.1% (8) | 0.2% (8) | 0.0% (0) |
| Metals and minerals, except petroleum, merchant wholesalers | 0.1% (7) | 0.1% (7) | 0.0% (0) |
Unemployment in Madison
- Unemployment by race in 2000
- Unemployment rate for White non-Hispanic residents
- 1.8%Males
- 2.2%Females
- Unemployment rate for Black residents
- 21.1%Males
- Unemployment rate for Hispanic or Latino residents
- 25.8%Males
Unemployment in 2023:
| Madison: | 3.2% |
| Connecticut: | 3.9% |
Unemployment in 2022:
| Madison: | 3.3% |
| Connecticut: | 4.2% |
Unemployment in 2021:
| Madison: | 4.3% |
| Connecticut: | 6.3% |
Unemployment in 2020:
| Madison: | 5.5% |
| Connecticut: | 7.9% |
Unemployment in 2019:
| Madison: | 2.6% |
| Connecticut: | 3.6% |
Unemployment in 2018:
| Madison: | 2.8% |
| Connecticut: | 3.9% |
Unemployment in 2017:
| Madison: | 3.2% |
| Connecticut: | 4.4% |
Unemployment in 2016:
| Madison: | 3.6% |
| Connecticut: | 4.8% |
Unemployment in 2015:
| Madison: | 4.0% |
| Connecticut: | 5.6% |
Unemployment in 2014:
| Madison: | 5.0% |
| Connecticut: | 6.6% |
Unemployment in 2013:
| Madison: | 6.0% |
| Connecticut: | 8.0% |
Unemployment in 2012:
| Madison: | 6.5% |
| Connecticut: | 8.4% |
Unemployment in 2011:
| Madison: | 6.7% |
| Connecticut: | 9.0% |
Unemployment in 2010:
| Madison: | 7.2% |
| Connecticut: | 9.6% |
Unemployment in 2009:
| Madison: | 5.7% |
| Connecticut: | 8.3% |
Unemployment in 2008:
| Madison: | 3.8% |
| Connecticut: | 5.6% |
Unemployment in 2007:
| Madison: | 2.9% |
| Connecticut: | 4.5% |
Unemployment in 2006:
| Madison: | 2.9% |
| Connecticut: | 4.4% |
Unemployment in 2005:
| Madison: | 3.1% |
| Connecticut: | 4.8% |
Unemployment in 2004:
| Madison: | 3.3% |
| Connecticut: | 5.1% |
Unemployment in 2003:
| Madison: | 3.3% |
| Connecticut: | 5.5% |
Unemployment in 2002:
| Madison: | 2.8% |
| Connecticut: | 4.4% |
Unemployment in 2001:
| Madison: | 1.8% |
| Connecticut: | 2.9% |
Unemployment in 2000:
| Madison: | 1.6% |
| Connecticut: | 2.1% |
Unemployment in 1999:
| Madison: | 1.6% |
| Connecticut: | 2.5% |
Unemployment in 1998:
| Madison: | 2.0% |
| Connecticut: | 3.2% |
Unemployment in 1997:
| Madison: | 3.3% |
| Connecticut: | 4.7% |
Unemployment in 1996:
| Madison: | 3.9% |
| Connecticut: | 5.2% |
Unemployment in 1995:
| Madison: | 3.5% |
| Connecticut: | 5.3% |
Unemployment in 1994:
| Madison: | 3.6% |
| Connecticut: | 5.6% |
Unemployment in 1993:
| Madison: | 4.2% |
| Connecticut: | 6.5% |
Unemployment in 1992:
| Madison: | 4.6% |
| Connecticut: | 7.3% |
Unemployment in 1991:
| Madison: | 4.3% |
| Connecticut: | 6.5% |
Unemployment in 1990:
| Madison: | 3.2% |
| Connecticut: | 4.9% |
Time leaving home to go to work
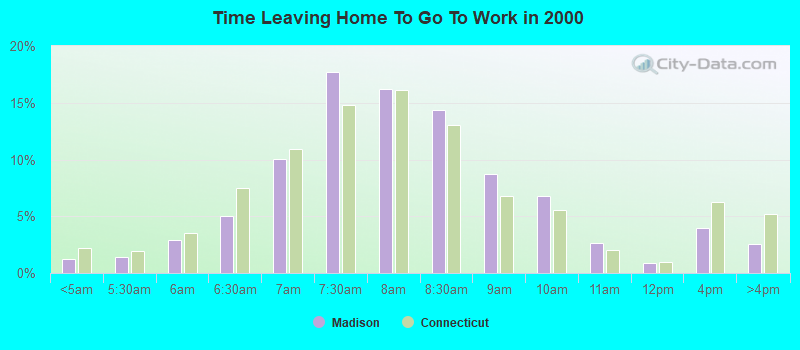
<5am:
| Madison: | 1.3% (112) |
| Connecticut: | 2.2% (35,436) |
5:30am:
| Madison: | 1.4% (126) |
| Connecticut: | 2.0% (32,039) |
6am:
| Madison: | 2.9% (259) |
| Connecticut: | 3.5% (57,499) |
6:30am:
| Madison: | 5.0% (440) |
| Connecticut: | 7.5% (123,062) |
7am:
| Madison: | 10.0% (885) |
| Connecticut: | 10.9% (179,325) |
7:30am:
| Madison: | 17.7% (1,567) |
| Connecticut: | 14.8% (242,766) |
8am:
| Madison: | 16.2% (1,433) |
| Connecticut: | 16.2% (265,137) |
8:30am:
| Madison: | 14.3% (1,266) |
| Connecticut: | 13.1% (214,263) |
9am:
| Madison: | 8.8% (773) |
| Connecticut: | 6.8% (110,992) |
10am:
| Madison: | 6.8% (602) |
| Connecticut: | 5.6% (91,313) |
11am:
| Madison: | 2.6% (233) |
| Connecticut: | 2.0% (33,574) |
12pm:
| Madison: | 0.9% (80) |
| Connecticut: | 1.0% (15,996) |
4pm:
| Madison: | 3.9% (347) |
| Connecticut: | 6.3% (102,744) |
>4pm:
| Madison: | 2.5% (225) |
| Connecticut: | 5.2% (85,259) |
Travel time to work
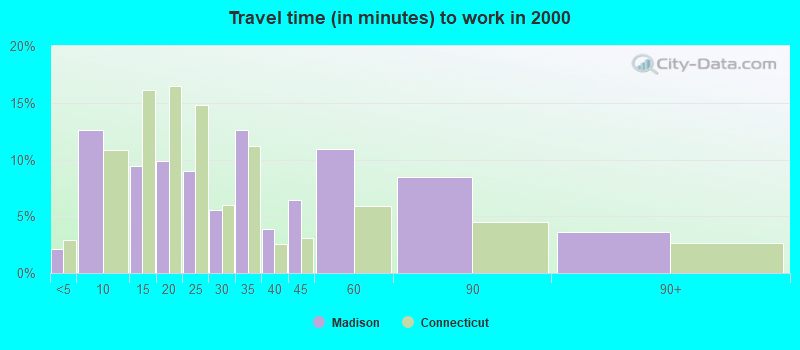
Less than 5 minutes:
| Madison: | 2.1% (189) |
| Connecticut: | 2.9% (47,035) |
5 to 9 minutes:
| Madison: | 12.6% (1,111) |
| Connecticut: | 10.8% (177,296) |
10 to 14 minutes:
| Madison: | 9.5% (836) |
| Connecticut: | 16.1% (264,948) |
15 to 19 minutes:
| Madison: | 9.9% (873) |
| Connecticut: | 16.4% (269,915) |
20 to 24 minutes:
| Madison: | 9.0% (791) |
| Connecticut: | 14.8% (242,914) |
25 to 29 minutes:
| Madison: | 5.6% (492) |
| Connecticut: | 6.0% (98,144) |
30 to 34 minutes:
| Madison: | 12.6% (1,111) |
| Connecticut: | 11.2% (184,005) |
35 to 39 minutes:
| Madison: | 3.9% (342) |
| Connecticut: | 2.6% (41,860) |
40 to 44 minutes:
| Madison: | 6.5% (570) |
| Connecticut: | 3.1% (50,084) |
45 to 59 minutes:
| Madison: | 11.0% (968) |
| Connecticut: | 5.9% (96,492) |
60 to 89 minutes:
| Madison: | 8.5% (747) |
| Connecticut: | 4.5% (74,032) |
90 or more minutes:
| Madison: | 3.6% (318) |
| Connecticut: | 2.6% (42,680) |
Means of transportation to work
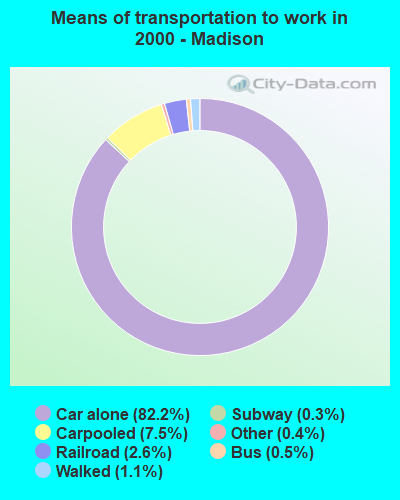
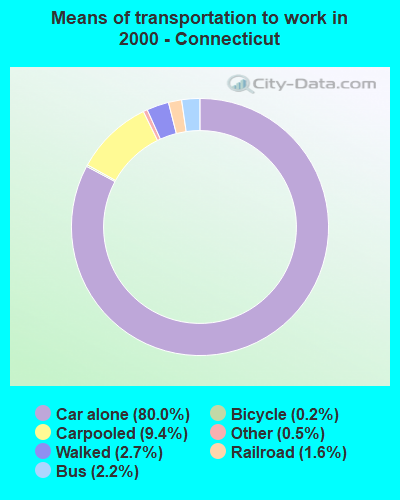
Drove car alone:
| Madison: | 82.2% (7,260) |
| Connecticut: | 80.0% (1,312,700) |
Carpooled:
| Madison: | 7.5% (660) |
| Connecticut: | 9.4% (154,400) |
Bus or trolley bus:
| Madison: | 0.5% (40) |
| Connecticut: | 2.2% (36,097) |
Subway or elevated:
| Madison: | 0.3% (25) |
| Connecticut: | 0.1% (1,111) |
Railroad:
| Madison: | 2.6% (226) |
| Connecticut: | 1.6% (26,659) |
Motorcycle:
| Madison: | 0.1% (5) |
| Connecticut: | 0.0% (776) |
Walked:
| Madison: | 1.1% (95) |
| Connecticut: | 2.7% (44,348) |
Other means:
| Madison: | 0.4% (37) |
| Connecticut: | 0.5% (8,479) |
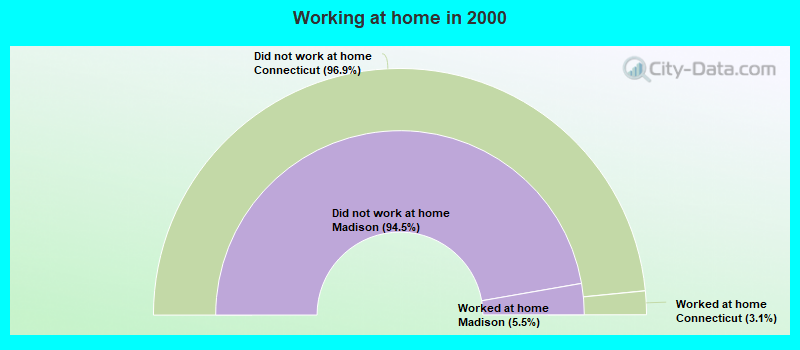
Private vehicle occupancy
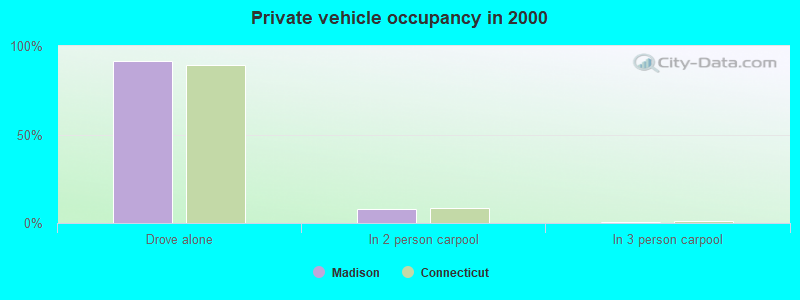
Drove alone:
| Madison: | 91.7% (7,260) |
| Connecticut: | 89.5% (1,312,700) |
In 2 person carpool:
| Madison: | 7.9% (628) |
| Connecticut: | 8.5% (124,051) |
In 3 person carpool:
| Madison: | 0.3% (25) |
| Connecticut: | 1.2% (17,722) |
In 4 person carpool:
| Madison: | 0.1% (7) |
| Connecticut: | 0.4% (5,991) |
Class of workers
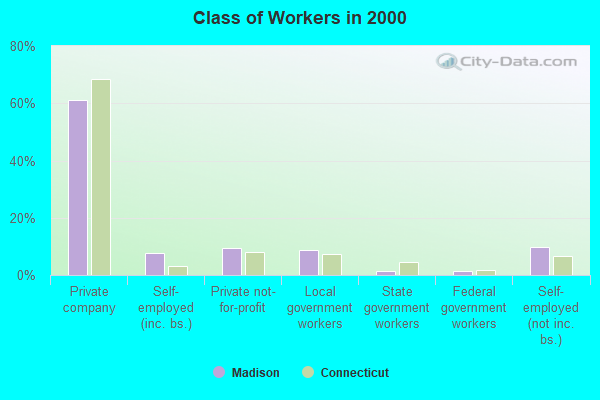
Employee of private company:
| Madison: | 61.1% (5,458) |
| Connecticut: | 68.6% (1,141,965) |
Self-employed in own incorporated business:
| Madison: | 7.8% (699) |
| Connecticut: | 3.3% (54,345) |
Private not-for-profit wage and salary workers:
| Madison: | 9.3% (828) |
| Connecticut: | 8.1% (134,058) |
Local government workers:
| Madison: | 8.7% (775) |
| Connecticut: | 7.3% (121,409) |
State government workers:
| Madison: | 1.4% (129) |
| Connecticut: | 4.4% (73,377) |
Federal government workers:
| Madison: | 1.5% (136) |
| Connecticut: | 1.6% (26,626) |
Self-employed workers in own not incorporated business:
| Madison: | 9.9% (883) |
| Connecticut: | 6.5% (108,945) |
Unpaid family workers:
| Madison: | 0.3% (23) |
| Connecticut: | 0.2% (3,715) |
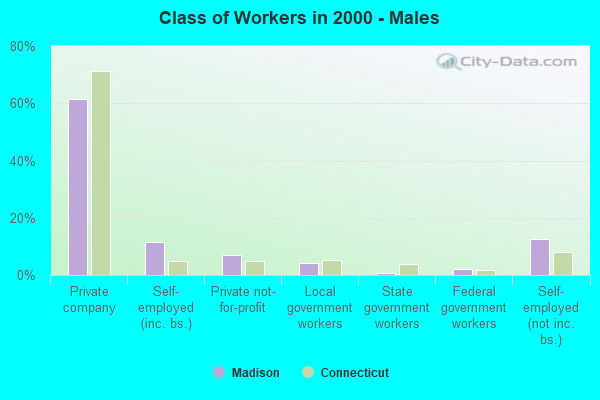
Employee of private company - Males:
| Madison: | 61.5% (2,991) |
| Connecticut: | 71.2% (617,694) |
Self-employed in own incorporated business - Males:
| Madison: | 11.5% (561) |
| Connecticut: | 4.8% (41,677) |
Private not-for-profit wage and salary workers - Males:
| Madison: | 7.0% (342) |
| Connecticut: | 4.9% (42,413) |
Local government workers - Males:
| Madison: | 4.3% (211) |
| Connecticut: | 5.3% (45,840) |
State government workers - Males:
| Madison: | 0.7% (36) |
| Connecticut: | 3.9% (34,214) |
Federal government workers - Males:
| Madison: | 2.2% (105) |
| Connecticut: | 1.8% (15,862) |
Self-employed workers in own not incorporated business - Males:
| Madison: | 12.5% (607) |
| Connecticut: | 7.9% (68,743) |
Unpaid family workers - Males:
| Madison: | 0.1% (7) |
| Connecticut: | 0.2% (1,617) |
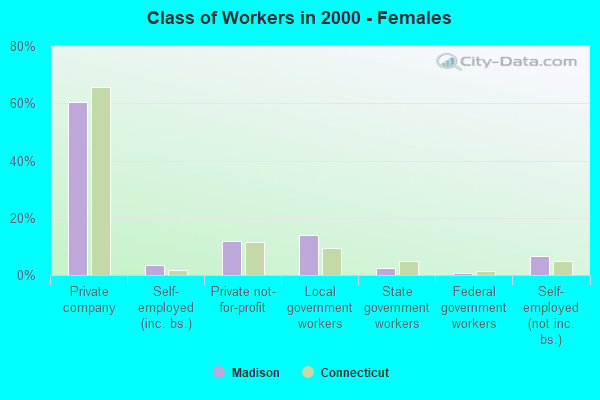
Employee of private company - Females:
| Madison: | 60.6% (2,467) |
| Connecticut: | 65.8% (524,271) |
Self-employed in own incorporated business - Females:
| Madison: | 3.4% (138) |
| Connecticut: | 1.6% (12,668) |
Private not-for-profit wage and salary workers - Females:
| Madison: | 11.9% (486) |
| Connecticut: | 11.5% (91,645) |
Local government workers - Females:
| Madison: | 13.9% (564) |
| Connecticut: | 9.5% (75,569) |
State government workers - Females:
| Madison: | 2.3% (93) |
| Connecticut: | 4.9% (39,163) |
Federal government workers - Females:
| Madison: | 0.8% (31) |
| Connecticut: | 1.4% (10,764) |
Self-employed workers in own not incorporated business - Females:
| Madison: | 6.8% (276) |
| Connecticut: | 5.0% (40,202) |
Unpaid family workers - Females:
| Madison: | 0.4% (16) |
| Connecticut: | 0.3% (2,098) |